ETH 45-Minute Chart Explanation
1. News Analysis
Bearish:
Recently, analysts pointed out that the highlights of Ethereum mainly come from the selling pressure of a single exchange, Binance, dominating short-term market behavior.
JPMorgan stated that ETH needs stronger network activity and DeFi usage rates to suppress the continuing rise relative to Bitcoin.
At the beginning of 2026, Ethereum prices experienced a significant decline, mainly due to concerns over funding, and the co-founder Vitalik Buterin selling millions of dollars worth of ETH triggered market panic.
Bullish:
Charles Schwab on May 13 opened direct trading of Ethereum spot for 39 million account users, which is an important signal for institutional entry.
The Ethereum Glamsterdam upgrade is scheduled for deployment in June 2026, expected to triple Layer 1 transaction throughput, a fundamental bullish factor that the market has yet to fully price in.
The large institution Bitmine Immersion Technologies holds over 5.27 million ETH, and its chairman Tom Lee sees $2,100 as a key support level for the May close, indicating the importance institutions place on price levels.
2. Technical Analysis (45-Minute Chart)
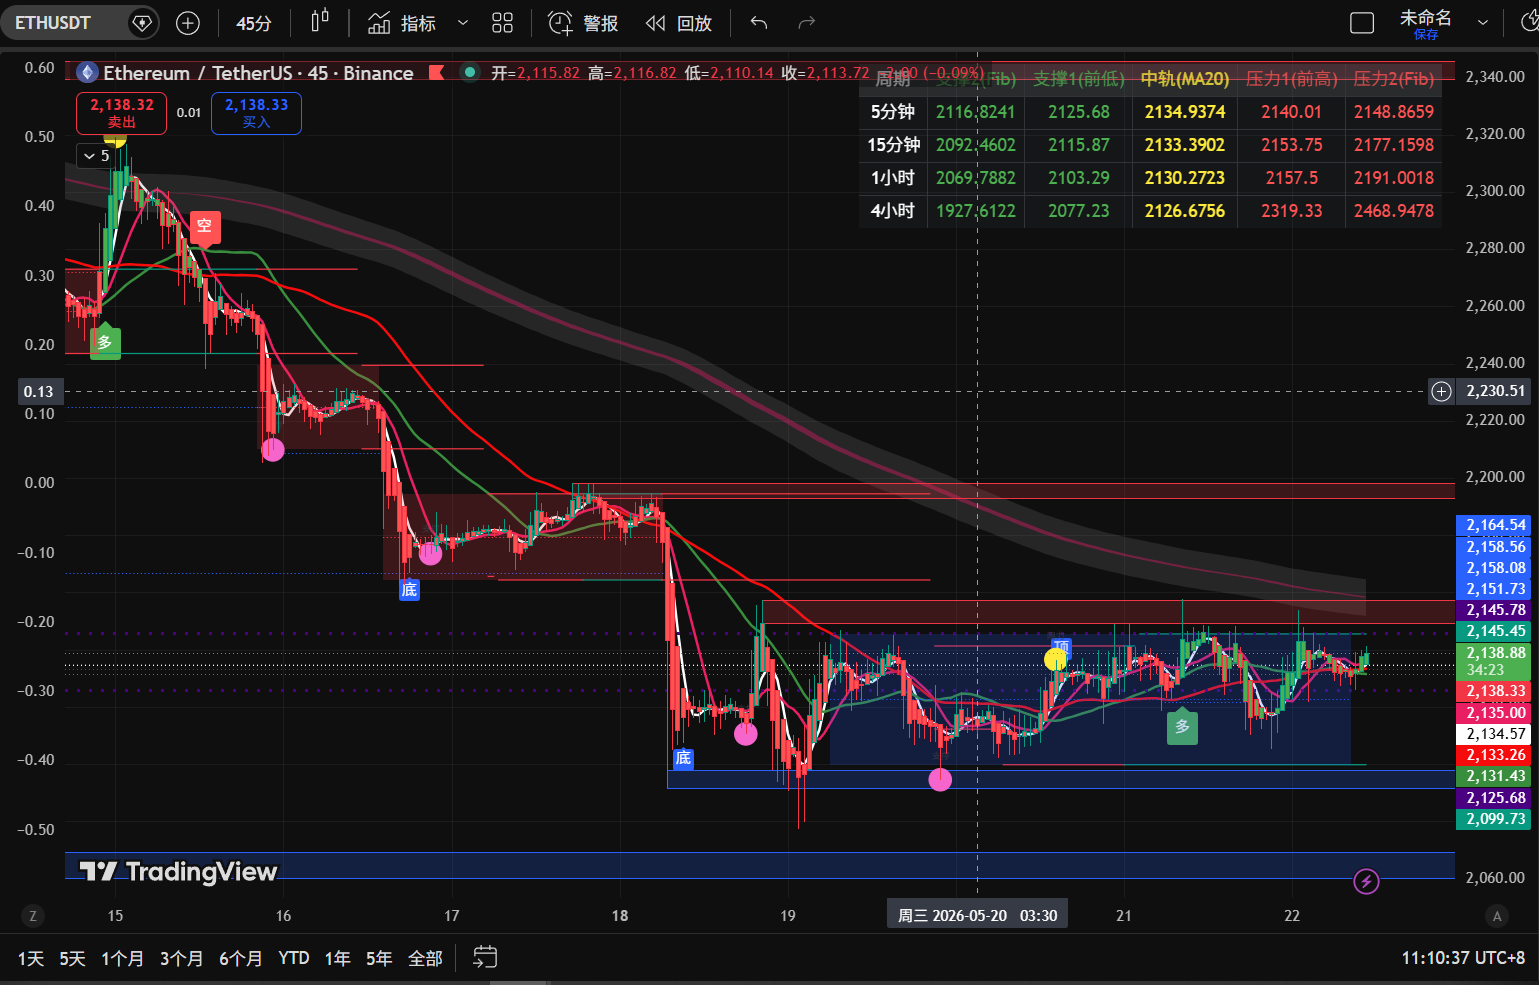
Current Price: 2138, Intraday Volatility Range 2125–2156
Candlestick Pattern Interpretation: From the chart, after a peak of approximately $2300 from May 15 to 16, the price continued to decline, experiencing a noticeable downward channel. On May 19, a deep penetration of approximately $2080 was recorded, followed by the price stabilizing around $2130-2160, forming a "consolidation at the bottom after a decline" pattern, currently in a low phase without confirming a clear direction.
Moving Average System (MA5/MA10/MA30):
Short-term MA5 (white) entangles with the price, direction unclear.
MA10 (red) is above the price, providing support.
MA30 (green) has an overall upward slope, with the bearish arrangement unchanged.
None of the three lines have shown a golden cross, indicating a definitive restart power in the short term.
Key Price Levels:
🔴Resistance Level 1: 2160 (near MA10, recent high transaction area)
🔴Resistance Level 2: 2200 (round number + previous support turned resistance)
Support Level 1: 2100 (psychological round number, key focus for institutions)
Support Level 2: 2080 (recent low, breaking it will accelerate the decline)
MACD/RSI:
On May 21, the MACD histogram turned green (+45.59), and the RSI fell back to 39.65, indicating that short-term momentum has improved, but still at the edge of the oversold range.
From a broader weekly perspective, the RSI is around 36, which is in an oversold state, indicating a technical rebound demand.
Bollinger Bands: The price is running near the lower Bollinger Band, with the bandwidth narrowing, suggesting a decrease in short-term volatility, but the choice of direction is imminent.
3. Operation Suggestions
Direction | Entry Interval | Take Profit Target | Stop Loss Level |
|---|---|---|---|
Light Long (Testing) | $2100 to $2120 | $2160/$2200 | $2,075 |
Short (Short-Term) | 2160–2180 doesn't rebound | $2110 / $2090 | $2210 |
Position Management Suggestions:
Currently in a consolidation range, heavy unidirectional positions are not recommended
Long positions should be controlled to 10-15% of total positions, entering in batches
If 2100 is effectively broken and stabilizes below, decisive losses should be taken.
Wait for confirmation of direction break at 2160 before adding positions.
4. Risk Warning
Breaking below 2100 risk: Recent technical analysis has warned of the potential risk of Ethereum falling below 2000, a psychological level, and once 2100 is lost, the next support is around 2000.
Continuous selling pressure from Binance: If large sell-offs from a single exchange continue, any rebounds will be hard to sustain.
Macro Environment: The ongoing rise in U.S. Treasury yields has put pressure on ETH, and macro uncertainty remains the biggest factor.
Countermeasures: Strictly execute stop-loss, do not chase after price increases, and act in the direction once it becomes clear.
The above article is provided by: Meridian Analysis, for more information about the crypto and forex market, scan to follow the public account and communicate with me. Article transmission may be delayed, and the content is for reference only. I have several years of research experience in the crypto and forex market, and everyone is welcome to learn.
免责声明:本文章仅代表作者个人观点,不代表本平台的立场和观点。本文章仅供信息分享,不构成对任何人的任何投资建议。用户与作者之间的任何争议,与本平台无关。如网页中刊载的文章或图片涉及侵权,请提供相关的权利证明和身份证明发送邮件到support@aicoin.com,本平台相关工作人员将会进行核查。


