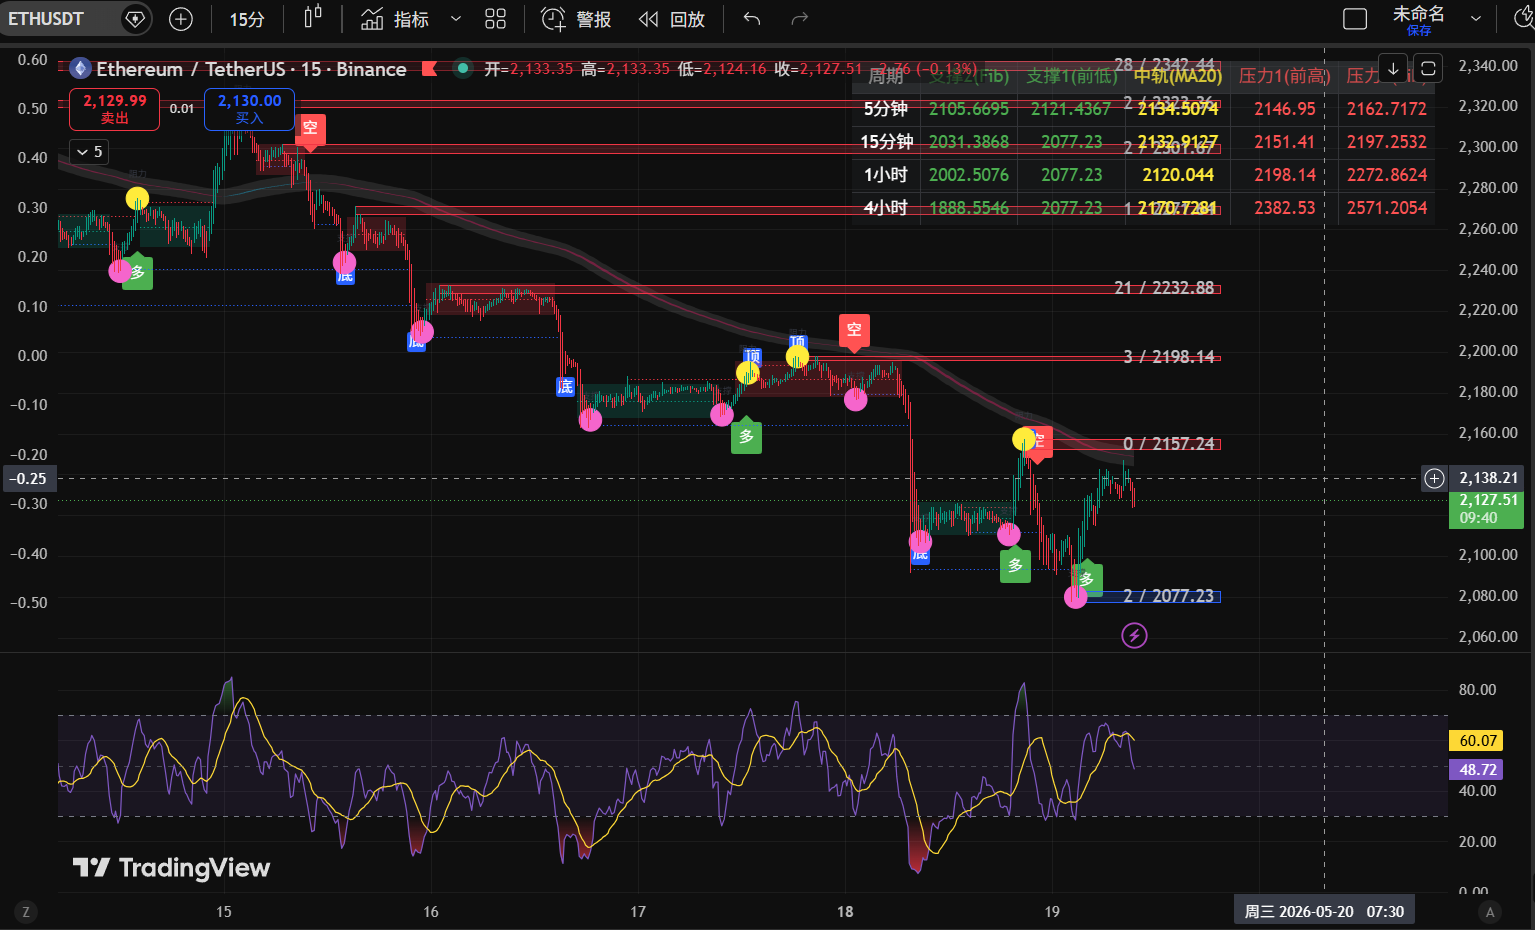
15 Minute ETH Cycle K-Line Analysis
I. News Analysis (Core Events in the Last 24 Hours)
🔴 Bearish Factors
Federal Reserve's High-Interest Rate Expectations Continue to Ferment
U.S. inflation data is stickier than expected, and the market has further postponed expectations for the first rate cut until 2027. The dollar index and U.S. Treasury yields are rising in sync, with the high-interest rate environment continuing to suppress high-volatility risk assets such as cryptocurrencies, leading to a lack of sustained rebound momentum for Ethereum.
Market Panic Sentiment Spreading, Continuous Capital Outflow
Bitcoin and Ethereum spot ETFs have seen net outflows for several consecutive days, with institutional funds accelerating their withdrawal and selling pressure continuing to intensify, resulting in a generally low risk appetite in the market.
Bullish Factors
On-chain Whale Addresses Increase Holdings at Low Levels
Multiple large Ethereum addresses have been continuously buying in the $2080-$2100 range, indicating long-term capital's acknowledgment of the bottom range, forming certain bottom support in the short term.
Staking Data Stabilizes, Network Fundamentals Remain Stable
The amount of staking on the Beacon Chain and the activity level of validators remain steady, with no large-scale outflows from the network. The fundamentals have not deteriorated, providing long-term emotional support for prices.
II. Technical Analysis Across Multiple Cycles
4-Hour Level
Price and Formation: Current price is about $2125, within a clear descending channel. The price is oscillating along the lower track of the channel, with bearish trend dominance and no clear reversal signals yet.
Moving Average System: The price is operating below the MA5/MA10/MA30/MA52 moving averages, which are in a standard bearish arrangement, with short-term moving averages pressing down continuously, exerting strong pressure on the price.
Key Levels: Resistance levels at $2160-$2180 (upper track of the descending channel + previous platform), support level at $2080 (previous low), with strong support below at $2076.
Indicators: MACD bearish momentum has slightly decreased, with the fast and slow lines still below the zero axis; RSI is in a neutral to bearish range, not entering oversold territory, with downside momentum still having room for release; the Bollinger Bands are opening downward, with the price operating below the mid-band, indicating a clear weak pattern.
30-Minute Level
Price and Formation: The price is oscillating narrowly in the $2100-$2130 range, forming a low-level consolidation structure, with rebound heights limited and a clear weak rhythm.
Indicators: The price is under pressure from the MA5/MA10 moving averages, with a reduction in MACD green bars. RSI is close to neutral, suggesting a possibility of a technical rebound repair in the short term, but with limited rebound heights, strong resistance exists above at $2150-$2180.
III. Operational Direction Recommendations
Table
Operational Direction | Key Point Levels (ETH/USDT) | Position Suggestions |
|---|---|---|
Short-term short position (following the trend) | Entry: $2150-$2180 (when rebound meets resistance, touching moving average / upper track of channel) Stop Loss: $2210 (breaks above the upper track of the 4-hour descending channel, a trend reversal signal) Take Profit: First target $2100, second target $2080 (previous low support) | Total position 10%-15%, enter in batches, do not chase shorts |
Low buy long position (counter-trend trial and error) | Entry: $2080-$2090 (previous low support area, when K-line signals a stop decline) Stop Loss: $2060 (breaks below previous low, support fails) Take Profit: First target $2130, second target $2160 | Total position within 5%, light positions for trial and error, do not heavily bottom fish |
IV. Risk Warning
Extreme Market Risk: Market panic sentiment persists, and further acceleration of declines cannot be ruled out. Strict stop losses are required to avoid emotional holding of positions.
False Breakout Risk: During the low-level consolidation phase, false rebounds may easily trigger long orders. It is necessary to wait for clear stabilization signals before entering the market to avoid being trapped by chasing highs.
Liquidity Risk: Volatility increases at the end of the descending channel. In oscillating markets, it is easy to incur losses from chasing up and down; hence, it is necessary to reduce frequent trading and patiently wait for key signal levels.
The above article is by: Meridian Analysis. To learn more about cryptocurrency and forex information, scan the QR code to follow the public account and communicate with me. There may be delays in article delivery, and content is for reference only. I have years of research experience in cryptocurrency and forex, and everyone is welcome to learn.
免责声明:本文章仅代表作者个人观点,不代表本平台的立场和观点。本文章仅供信息分享,不构成对任何人的任何投资建议。用户与作者之间的任何争议,与本平台无关。如网页中刊载的文章或图片涉及侵权,请提供相关的权利证明和身份证明发送邮件到support@aicoin.com,本平台相关工作人员将会进行核查。