Hello everyone, I am Sister Qinglan, welcome to the Crypto Classroom! Today we will analyze the latest market data using the Qinglan TPV three-point verification system to see what the market is really calculating. Without further ado, let's get started!
Step One: First, look at the overall direction (multi-cycle trend overview)
Let's reveal the foundation of the four cycles:
1-day cycle: Closing price 75717.98. The moving averages form a typical bullish arrangement, MA5 is 75626.86, MA10 is 74738.91, MA30 is 71028.09, the price is firmly above all moving averages, and the overall trend is still upward! As for on-chain sentiment, the Fear and Greed Index is 33, in the "Fear" zone, indicating that while the overall trend is upward, retail investor sentiment is cautious, showing some divergence.
4-hour cycle: Closing price 75727.78. The moving averages are intertwined, MA5 is 75755.04, MA10 is 75286.02, MA30 is 75626.36, the price is fluctuating within the moving averages, forming a typical consolidation pattern. The total market capitalization has changed by 1.42% in 24 hours, with funds inflowing but little change in price, indicating fierce competition between bulls and bears.
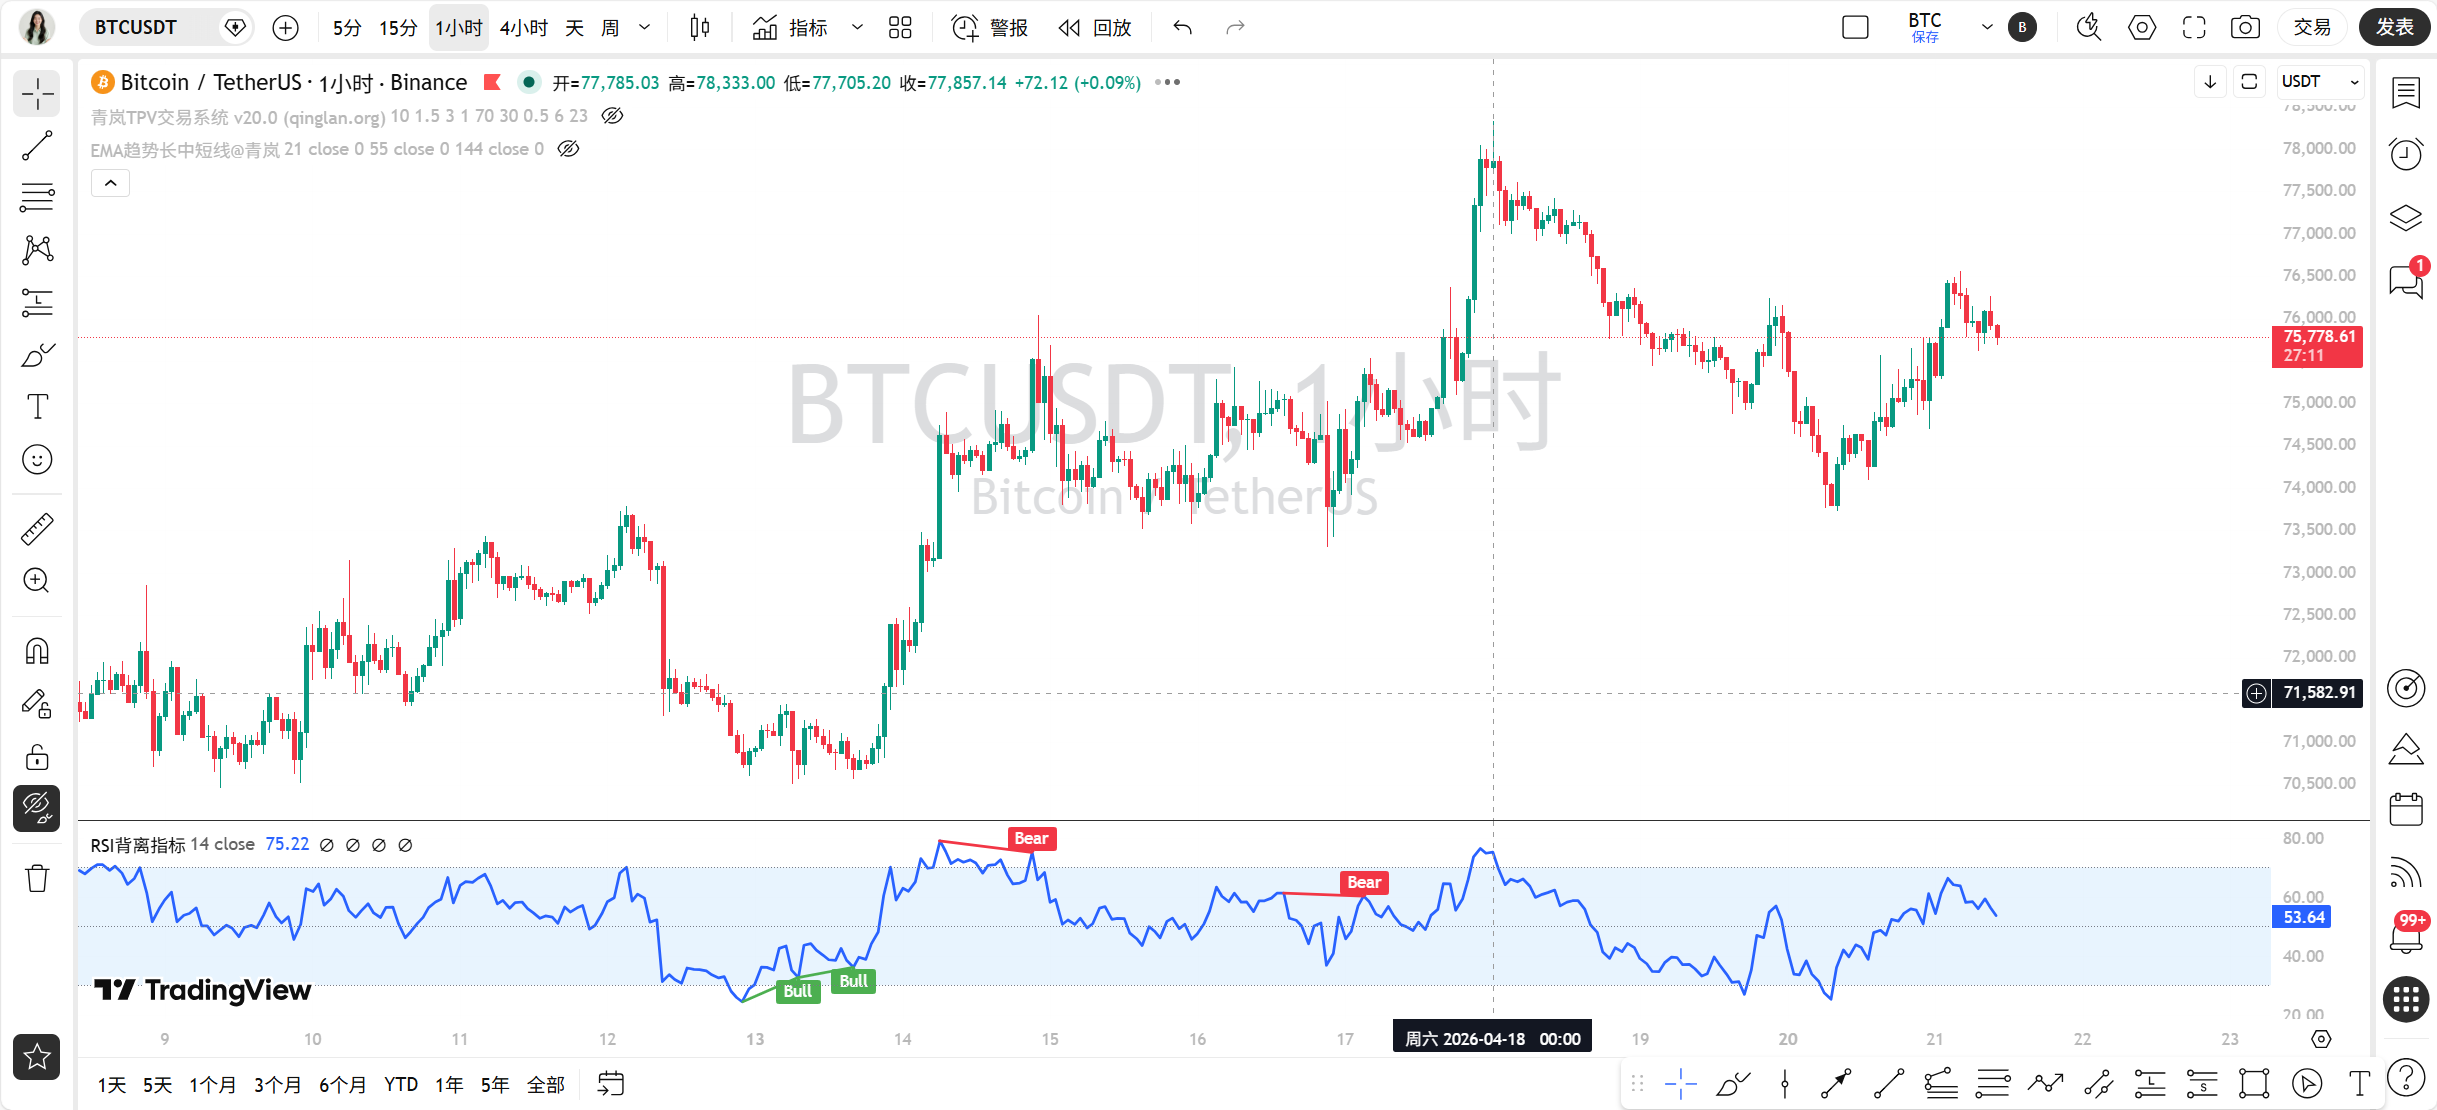
1-hour cycle: Closing price 75717.98. The moving averages are also intertwined, MA5 is 75910.65, MA10 is 76040.29, MA30 is 75190.44. The price is slightly below the short-term moving averages, showing a slightly weak short-term trend. The news states "The market's competition between bulls and bears intensifies," which aligns with this consolidation pattern.
15-minute cycle: Closing price 75717.98. Here, we should note that the moving averages are in a bearish arrangement! MA5 is 75916.55, MA10 is 75946.35, MA30 is 76016.60, and the price is clearly below the moving averages, signaling an adjustment from the shortest cycle.
Step Two: Find the pivot points and draw key lines (valid high and low points + trend lines)
Let's find the key turning points for each cycle:
1-day: The valid high point is 78052.49 (from the 4-hour high price sequence, corresponding to the daily level high), and the valid low point is 73724.31 (from the 4-hour low price sequence). The price is currently between the two.
4-hour: The recent valid high point is 76558.62 and the valid low point is 75691.03. The price is currently testing this low point area. Connecting the recent low points can draw an upward trend line, currently providing support around 75500.
1-hour: The valid high point is 76486.67, and the valid low point is 75691.03. A consolidation range has formed, and the price is currently close to the lower edge of the range.
15-minute: The valid high point is 76357.20, and the valid low point is 75691.03. The short cycle is also in a small downward channel.
The news mentions "The value of multiple tests: analysis of Bitcoin support effectiveness," which corresponds to what we see now, as the price repeatedly tests the area of 75600-75700.
Step Three: Use indicators for support (technical indicator validation)
Let's see what the indicators say:
1-day: The MACD histogram is 287.98, positive, but the DIF and DEA have not crossed, and momentum remains. The RSI is 60.89, neutral to strong, without being overbought. The indicators support the upward trend.
4-hour: The MACD histogram is -19.56, negative, momentum is weak. The RSI is 50.63, neutral. The indicators confirm the consolidation pattern.
1-hour: The MACD histogram is 13.18, positive but very small. The RSI is 55.87, neutral. This is also a consolidation signal.
15-minute: The MACD histogram is -28.99, clearly negative. The RSI is 39.85, approaching the oversold area. This is a clear signal of short-term adjustment!
Currently, no obvious top-bottom divergence has been observed.
Step Four: Bulls and bears wrestle (news + on-chain)
News:
Positive factors: Continuous inflow of ETF funds (BlackRock significantly bought 3372 coins), Morgan Stanley increased holdings, Bitcoin broke through 76000 USD, and the participation rate of US retail investors rebounded.
Negative factors: Intensifying competition between bulls and bears in the market, negative spot CVD, whales taking profits, and geopolitical uncertainty (Iran).
The core factors are the inflow of ETF funds and the competition between bulls and bears in the market; these two forces are at odds. Currently, technology and news are resonating, pointing to high-level consolidation.On-chain data:
Fear and Greed Index is 33 (fear), but the price is at a high level, which is a typical "fearful rise" often seen in the middle of a bull market. Bitcoin's dominance is 57.61%, still very high, and funds are still concentrated in Bitcoin. The total market capitalization has grown by 1.42%, indicating an inflow of funds. There is a certain divergence between on-chain data and price movement (fearful sentiment but stable prices), which requires us to be wary of retracement risks, but it may also suggest that the upward trend has not ended.
Step Five: The path of least resistance (trading strategy)
In summary, the large cycle is upward, but the medium and small cycles are in a consolidation adjustment. The current safest strategy is to wait for the adjustment to end and look for low long opportunities.
Key entry area: Pay attention to the support near the valid low point of 75691.03 in the 4-hour cycle, as well as the upward trend line (around 75500). If it stabilizes here, it would be a good long entry position.
Stop-loss basis: If the price falls below 75500 and confirms, it may disrupt the short-term upward structure, and the stop-loss can be set below 75300.
Target area: First look towards the upper edge of the consolidation range near 76558.62.
Step Six: How will it go today (market prediction)
Currently (within hours): It is likely to continue fluctuating between 75600-76200 to digest short-term bearish pressure.
Key points for today and the near future: The most important support levels today are 75691.03 and 75500 (trend line), while the most important resistance levels are 76296.96 (1-hour closing high) and 76558.62.
Trading thought: The most suitable idea right now is "wait for a retracement and then go long." Because the overall trend is upward, and the small cycle adjustment is approaching key support areas, the risk-reward ratio is better. Do not chase after peaks.
Summary: The core conflict in the current market is the long-term bullishness of ETF fund inflows versus the short-term pressure of profit-taking in the market.
Trading wisdom: As mentioned in the news, the market is seeking direction in the "battle of bulls and bears," and our trading should also maintain a balance between "fear" and "greed."
[Qinglan's Personal View]
Oh, looking at the data, Sister Qinglan feels that the current market is like wringing a towel, trying to wash out all the uncertain chips. The ETF money is genuine buying, but retail investor sentiment is very fearful of heights, and this combination often leads to further developments. What we need to do now is to be patient, hold the key positions, and not get thrown off the car by the up and down fluctuations. Remember, seek opportunities when others are fearful, but also set stop-losses to protect yourself.
This TPV system was honed through practical experience by Sister Qinglan, and I hope it can help clarify your thinking. If you want to capture more opportunities together, remember to visit the official website www.qinglan.org
免责声明:本文章仅代表作者个人观点,不代表本平台的立场和观点。本文章仅供信息分享,不构成对任何人的任何投资建议。用户与作者之间的任何争议,与本平台无关。如网页中刊载的文章或图片涉及侵权,请提供相关的权利证明和身份证明发送邮件到support@aicoin.com,本平台相关工作人员将会进行核查。