
Author: XinGPT
Just before the Spring Festival, a wave of crashes hit one after another, first gold and silver plummeting from high positions, then cryptocurrencies began to drop without any support like a flood, breaking all key support levels, and finally, US stocks and Hong Kong stocks fell consecutively, losing money during the day and losing more at night, left side lost all and right side lost too, asset allocation in different markets all flipped.
Fortunately, I had basically cleared my cryptocurrency assets earlier, but could not avoid the stock market's sharp declines; certain stocks like Figma and Xpeng Motors dropped over 70% in value (not 70% of all assets, forgive me for using a headline exaggeration this time).
There are several interpretations in the market:
It is said that Anthropic’s legal AI is so powerful that we won't need professional software in the future, just using big models is sufficient, causing software stocks to crash.
It is said that although Google's earnings report was good, its capital expenditure guidance is too high, exceeding market expectations by 50%
It is said that the incoming Federal Reserve Chairman Warsh is hawkish, wants to maintain a strong dollar, is reluctant to cut interest rates, and may even reduce the balance sheet.
I believe all of the above is Bullshit.
Analysts often provide seemingly reasonable justifications for declines in the market after they occur; however, these reasons are often noise that obscures the true core narrative and operational logic of the market.
No matter how powerful Anthropic's legal AI is, how much revenue has it generated? Will its revenue exceed that of SAP? Are software companies just sitting idle waiting to be disrupted?
When Google's capital expenditure is high, you worry about cash flow; when it is low, you will surely worry about insufficient spending, fearing the AI upstream and downstream industries lack funds, making Google AI fall behind;
This Warsh argument is even crazier; he hasn't even taken office yet, and we're already dreaming about how he will act afterward. You are fantasizing more than retail investors. Even if Warsh takes office, it would be very difficult to completely overturn the Federal Reserve's prior policy direction; after all, the poor employment data is right there, and it is also very hard to be hawkish.
I believe this wave of decline is caused by tight liquidity + high valuations leading to significant market volatility: just like Alex climbing Taipei 101, the higher he goes, the stronger the wind becomes; feeling a gentle breeze on flat ground, but facing strong winds at high altitude makes my heart sway intensely.
What is the current level of US stock valuations?
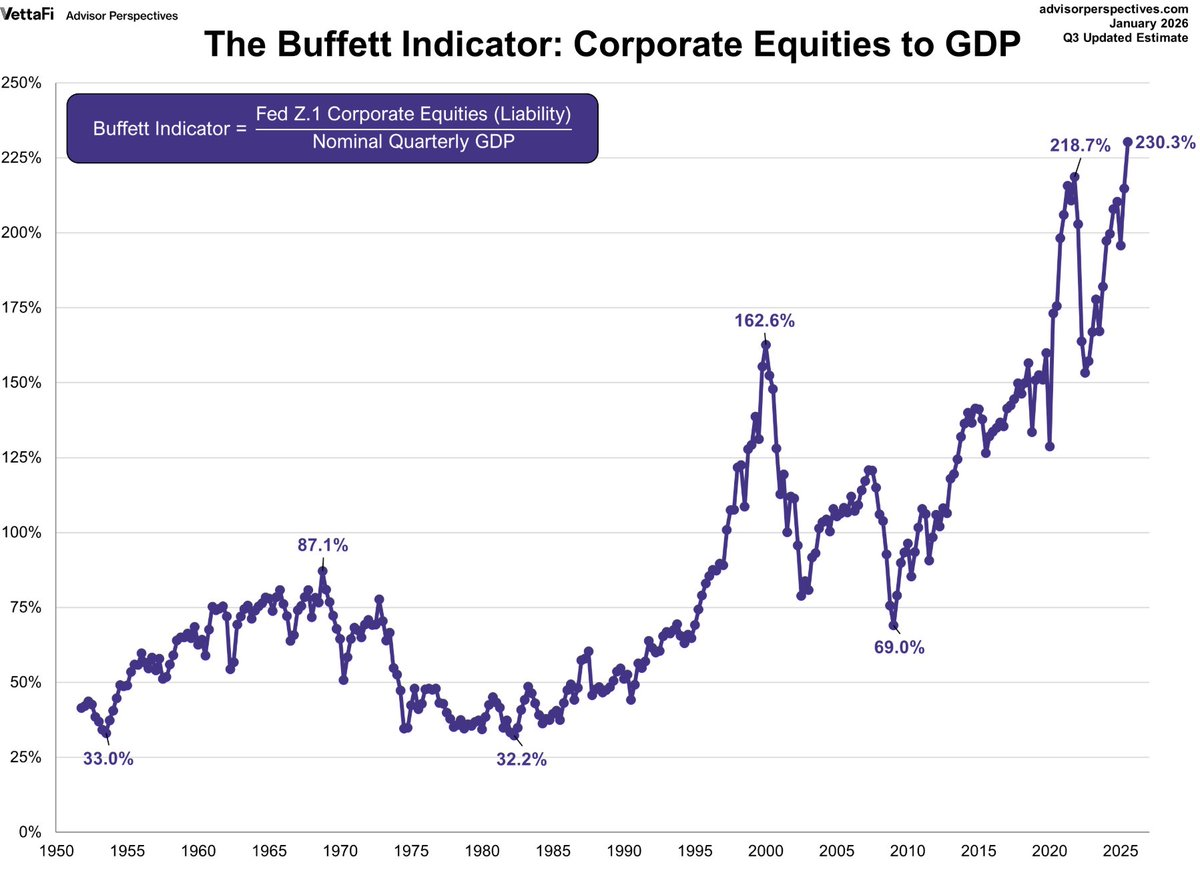
There is a Buffett indicator that represents the ratio of total market capitalization to Gross Domestic Product (GDP); Buffett believes a ratio of 75%-90% is reasonable, and if it exceeds 120% or higher, it is considered severely overvalued, akin to "playing with fire."
It should be noted that currently, this indicator is at 230%.
Of course, we all know that high valuation does not necessarily mean a crash will occur. The Buffett indicator is affected by lagging GDP data, so the actual situation may not be as exaggerated.
However, stocks are definitely not in the undervalued range, which will definitely amplify market volatility because institutions with substantial profits may choose to take profits at any time.
Meanwhile, the S&P 500 Forward P/E ratio is at 22.0x, compared to a 30-year average of 17.1x; 22.0x is approximately (22.0-17.1)/(20.4-17.1) ≈ +1.5 standard deviations away. This means valuations are in the "significantly overvalued" range and have already surpassed the "+1σ line" (20.4x). It's getting close to the 25.2x P/E ratio during the 2000 internet bubble phase.
At the same time, the tightness of funding is like the wind at high altitudes, roaring towards the market:
1. First, the initial tightening of liquidity comes from Japanese government bonds.
Every time Japanese government bond yields jump, it drains liquidity from the global market.
Since Japan is the world's largest creditor, its long-maintained zero interest rate policy has given rise to a massive "Yen Carry Trade." Global investors borrow low-cost yen to invest in high-yield overseas assets (such as US stocks).
Once Japanese government bond yields rise quickly, and the interest rate difference narrows, the attractiveness of the carry trade decreases or even leads to losses, triggering a large-scale liquidation: investors need to sell overseas assets to convert back to yen to repay loans. This process will initiate global "de-leveraging" and asset liquidation.
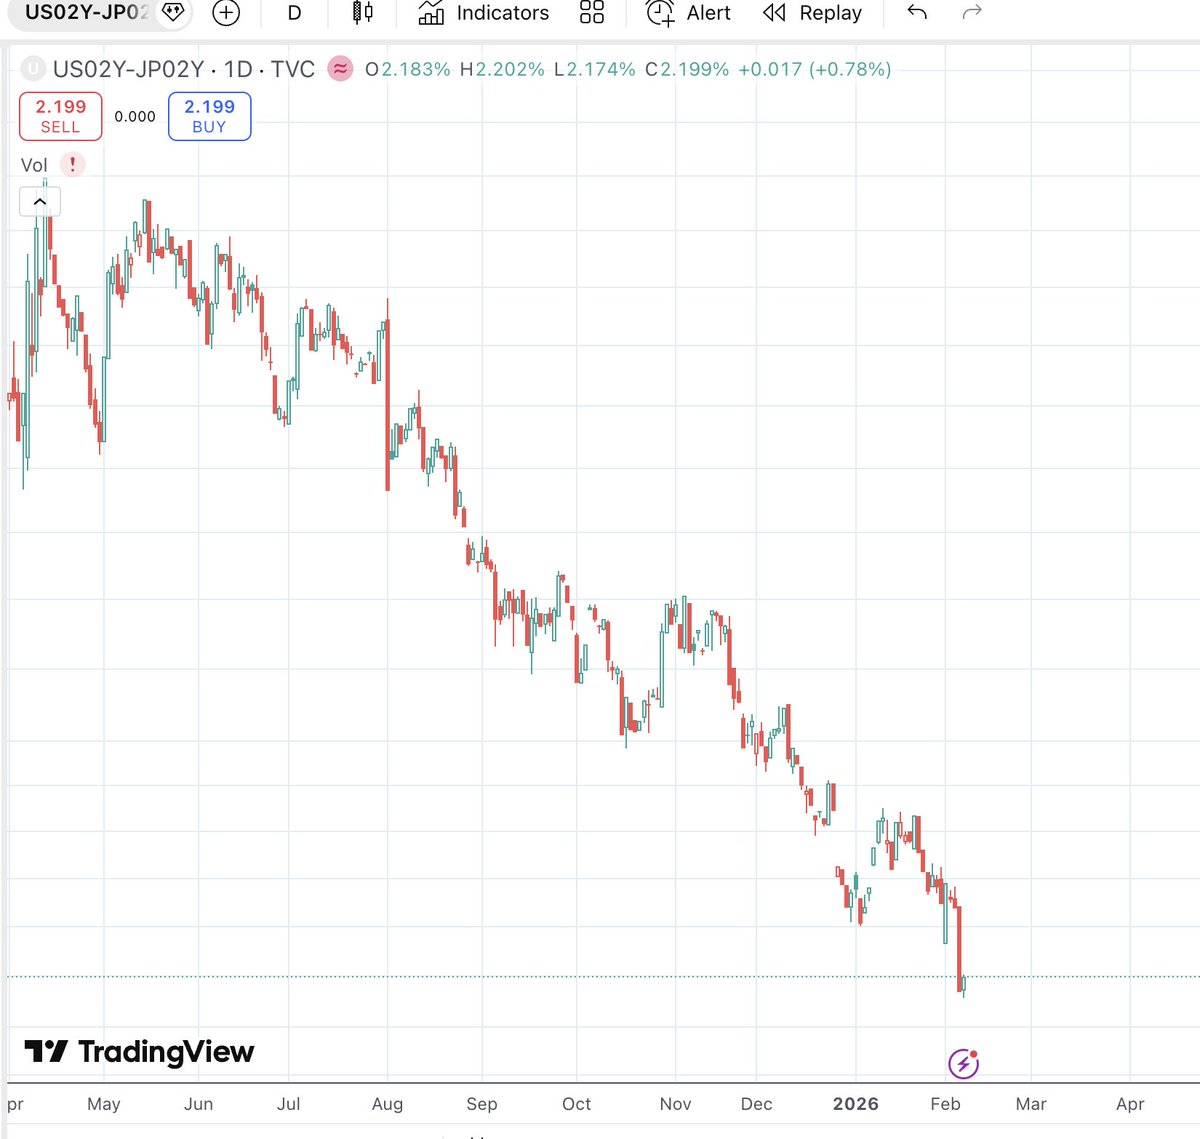
From early February, we can see the significant drop in the short-term interest rate differential; that is, the US 2-year rate minus the Japanese yen 2-year rate, indicating to a large extent that the carry trade needs to continue reducing leverage and consolidating funds.
2. TGA accounts and treasury issuance: pulling the rug.
The Treasury General Account (TGA) of the US Treasury is a key variable affecting market liquidity. When the Treasury increases TGA balances through debt issuance or tax collection, it is equivalent to withdrawing funds from the financial system, resulting in a decrease in bank reserves and thus tightening liquidity. Conversely, when the Treasury spends (reducing TGA balances), it injects liquidity into the market.
At the beginning of February 2026, the market was facing dual pressures of TGA rebuilding and large-scale treasury issuance:
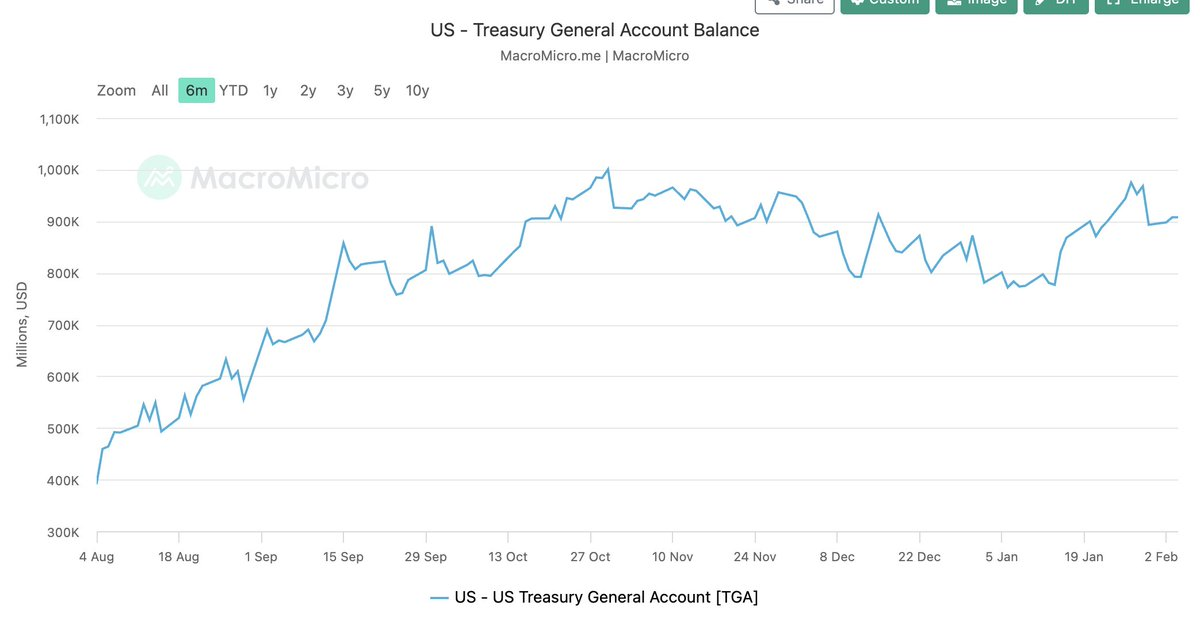
• High TGA balance: As of early February, the TGA balance remained at a high level of approximately $893.2 billion. The US Treasury plans to maintain this balance at $850 billion by the end of March, peaking at about $1.025 trillion during tax season at the end of April. This means the Treasury will continue to siphon funds from the market.
• Large-scale treasury issuance: To replenish TGA and finance the fiscal deficit, the Treasury announced a large-scale quarterly refinancing plan at the beginning of February, further exacerbating the tight liquidity conditions in the market.
This type of "pulling the rug" operation directly caused a decrease in bank reserves, forcing financial institutions to tighten credit and liquidate assets to obtain liquidity, thereby triggering a chain reaction in the market.
3. CME raising margins: historic "de-leveraging."
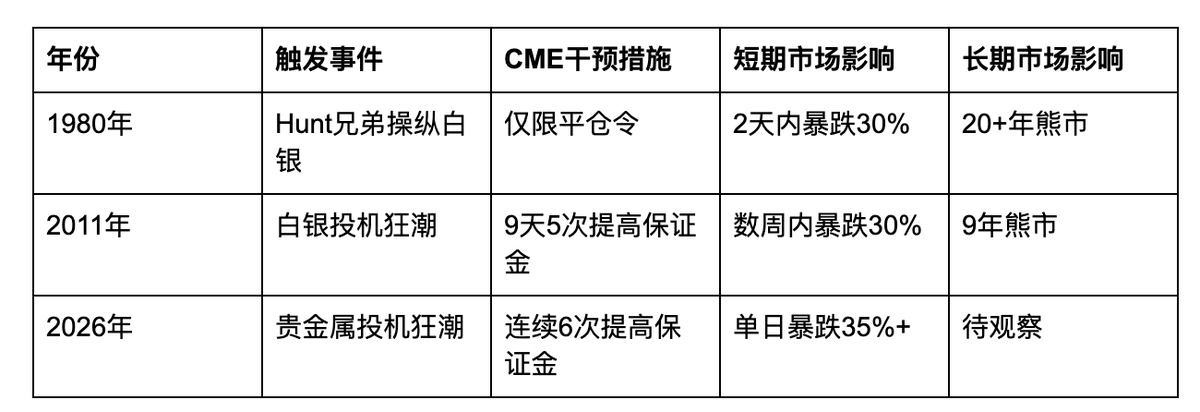
In times of extreme volatility in the precious metals market, the Chicago Mercantile Exchange (CME) raises margin requirements for futures contracts to force the market to de-leverage, a move that has historically acted as the end of many bull markets.
The precious metals crash in early February 2026 was highly correlated with the CME's continuous interventions. After silver prices reached an all-time high, the CME raised the margins for gold and silver futures six times consecutively, with silver's initial margin increasing from 11% all the way to 18%. For long positions that had already been severely impacted, this was akin to "salting the wound," triggering a forced liquidation.
Below are some historically notable margin increases and their subsequent effects:
The issue of liquidity needs to be addressed by focusing on liquidity.
In addition to studying the fundamentals of US stock companies and macro statements from the Federal Reserve meetings, the following liquidity indicators are ones that I believe must be closely watched:
1)Settlement-level funds (water level)
Net liquidity = Total Federal Reserve Assets - TGA - ON RRP (Overnight Reverse Repo)
It is a directional indicator of "available cash in the market." A decline in net liquidity generally signifies that the funding environment is tightening.
2)Short-term funding prices (Is money expensive?)
SOFR (Secured Overnight Financing Rate)
An unusual rise in SOFR indicates that short-term funding is becoming expensive, making it easier for the market to experience volatility.
3)Interest rate volatility (Can the market makers and leverage hold up?)
MOVE (US Treasury Volatility Index)
A rise in MOVE means increased interest rate volatility, leading intermediaries to reduce their balance sheets and leverage, causing risk assets to more easily decline passively.
4)Global de-leveraging chain (one of the most common reasons for "sudden tightening")
USDJPY (Is there rapid appreciation of the yen?)
US2Y - JP2Y spread (Is the carry basis narrowing?)
The appreciation of the yen coupled with a narrowing spread looks more like a trigger for de-leveraging.
5)Credit confirmation (Has the tension transmitted to the financing side?)
HY OAS (High Yield Credit Spread)
A widening HY OAS indicates a deteriorating financing environment, making it easier for the decline in risk assets to spread.
Later, I will analyze how to use AI vibe coding to implement macro liquidity monitoring and alerts.
Related Reading: A job with an annual salary of 1.5 million, accomplished with $500 of AI: Personal Business Agent Upgrade Guide
免责声明:本文章仅代表作者个人观点,不代表本平台的立场和观点。本文章仅供信息分享,不构成对任何人的任何投资建议。用户与作者之间的任何争议,与本平台无关。如网页中刊载的文章或图片涉及侵权,请提供相关的权利证明和身份证明发送邮件到support@aicoin.com,本平台相关工作人员将会进行核查。


