Bottom-fishing is sexy but brutal. But if that's your game, this battle-tested on-chain indicator may be your North Star for spotting the bitcoin bear market bottom.
This metric, called BTC supply in profit versus loss, gauges how bitcoin wallets sitting on paper profits stack up against those underwater. When the two balance out, bear markets tend to bottom, past data show. This makes it a reliable signal for capitulation and long-term opportunity.
To the relief of bulls, that scenario could arrive soon, as the number of those sitting on profits and losses seems to be converging.
Glassnode data shows that currently 11.1 million bitcoin is in profit, meaning these coins have been acquired at prices lower than the going market rate. Meanwhile, 8.9 million BTC is in loss.
A potential convergence could mark a bottom just as it did in 2022 and 2018-19, as seen in the chart below.
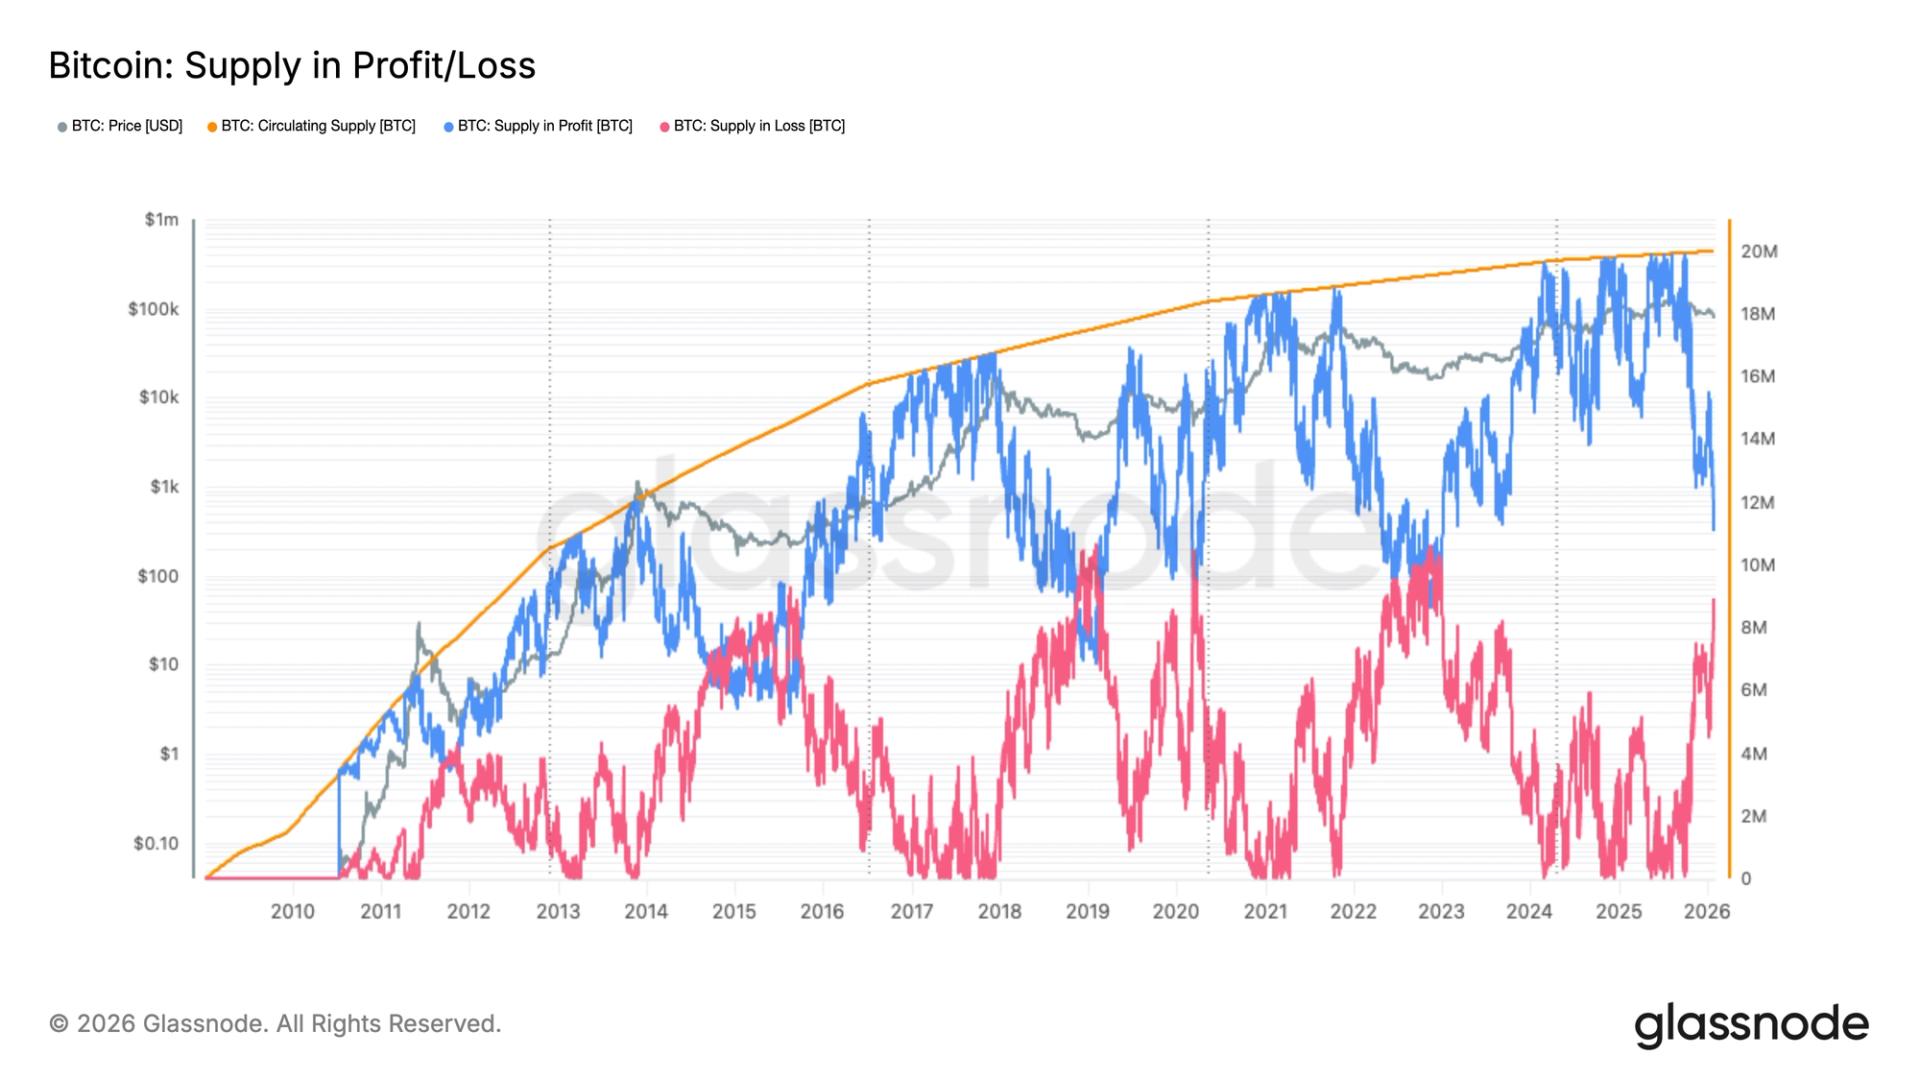
The Glassnode chart illustrates the volume of BTC supply held in profit, shown in blue, and in loss, shown in red, relative to the circulating supply.
As spot prices move above or below aggregate cost bases, coins migrate between these two supply cohorts, providing insight into market wide positioning and investor stress.
Historically, convergence points between the two have marked definitive cycle bottoms. This occurred in November 2022 around $15,000 following the FTX collapse, in March 2020 when bitcoin briefly fell below $3,000 during the covid-19 market shock, in January 2019 near $3,300, and again in 2015 just above $200.
Let's see if history repeats itself.
免责声明:本文章仅代表作者个人观点,不代表本平台的立场和观点。本文章仅供信息分享,不构成对任何人的任何投资建议。用户与作者之间的任何争议,与本平台无关。如网页中刊载的文章或图片涉及侵权,请提供相关的权利证明和身份证明发送邮件到support@aicoin.com,本平台相关工作人员将会进行核查。


