Author: CICC Insight
Introduction: Is $5,500 the ceiling for gold, or the starting point of a revolutionary change?
In just one month since the beginning of the year, gold has set multiple records: 1) The rate of increase has almost exceeded everyone's expectations. Although bullish sentiment on gold is mainstream in the market, a rise of 25% in just one month is unprecedented since the 1980s, and even for most gold bulls, it was likely unexpected; 2) After briefly exceeding $5,500/ounce, it experienced a "full reduction," with a drop of over 10% in a single day, also unprecedented since 1984.
In the face of this dramatic surge and plunge, any point estimation seems pale and powerless because: 1) Gold prices have clearly surpassed simple fundamental dominance, so traditional gold pricing models like real interest rates have long become ineffective; 2) The grand narrative of geopolitical and monetary system reconstruction, which has a greater impact, is difficult to provide a specific timeline for realization, instead giving people a space for arbitrary speculation in the short term; 3) The recent surge in gold is largely driven by emotions and capital, making it difficult to grasp the rhythm.
Chart 1: Decoupling of gold and real interest rates after 2022
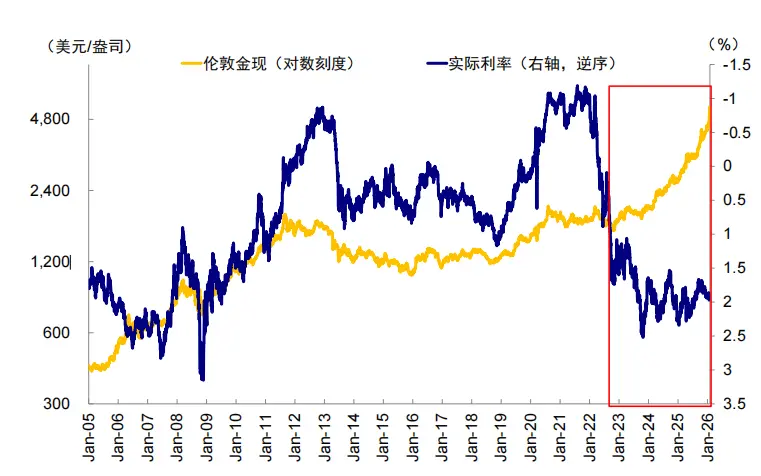
Source: Wind, CICC Research Department
Chart 2: Our constructed four-factor model of the dollar, real interest rates, uncertainty, and momentum has recently decreased in its explanatory power for gold prices
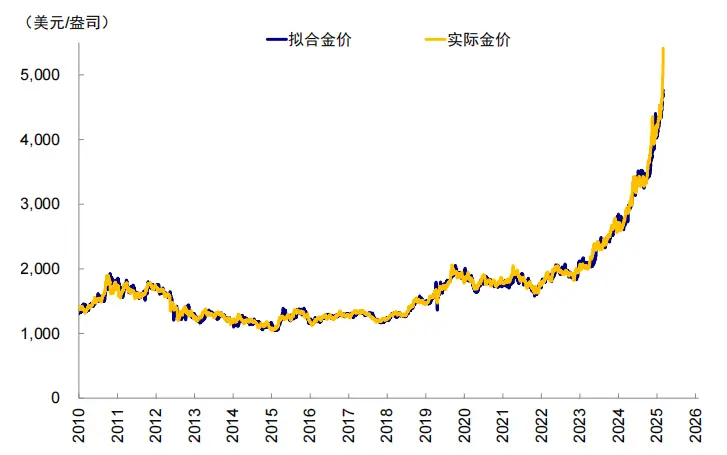
Source: Bloomberg, Wind, CICC Research Department
These three points determine that estimating gold prices is difficult to balance direction and timing, let alone the rhythm of fluctuations during the process, highlighting the value of "regular investment." For example, in our annual outlook published last November, "Following the Direction of Credit Expansion," we inferred the "threshold" of $5,500/ounce based on the scale of existing gold being equal to the scale of U.S. debt, but we did not anticipate it would be reached in just three months. Some may say that as long as the direction is correct, timing is not that important; however, this is not the case. Imagine if this point were to be realized three years later instead of three months, who would be willing to heavily invest in the short term for a three-year vision? Not to mention whether one can hold on through the severe turbulence in the process.
In fact, alongside the rapid rise in gold, the sharply increased volatility and massive ETF inflows have already marked a "price tag" for the rise. The largest gold ETF globally, the SPDR Gold ETF, has seen its holdings rebound to levels near those during the 2022 Russia-Ukraine conflict, and the correlation coefficient between ETFs and gold prices has risen to 0.98 over the past two years, a historical high, indicating that sentiment has reached a certain level of exuberance. As for the nomination of Walsh, it merely played the role of a catalyst needed for a storm; otherwise, why would U.S. stocks, bonds, and the dollar not experience such significant turbulence?
Chart 3: The 14-day RSI of gold reached 90, remaining in the overbought range
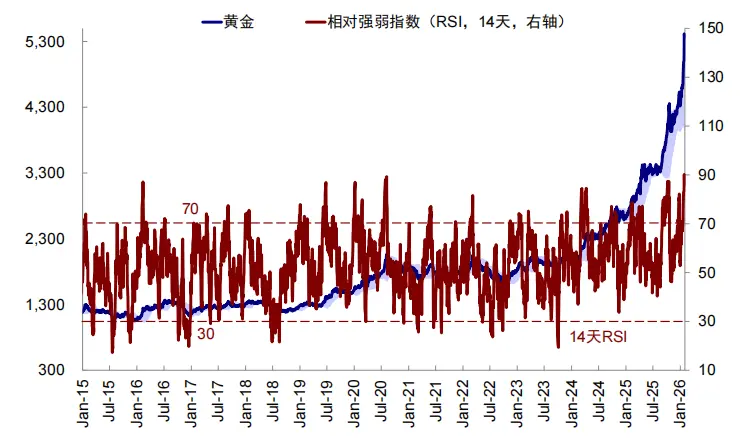
Source: Bloomberg, CICC Research Department
Chart 4: The volatility of gold has significantly increased, surpassing other assets
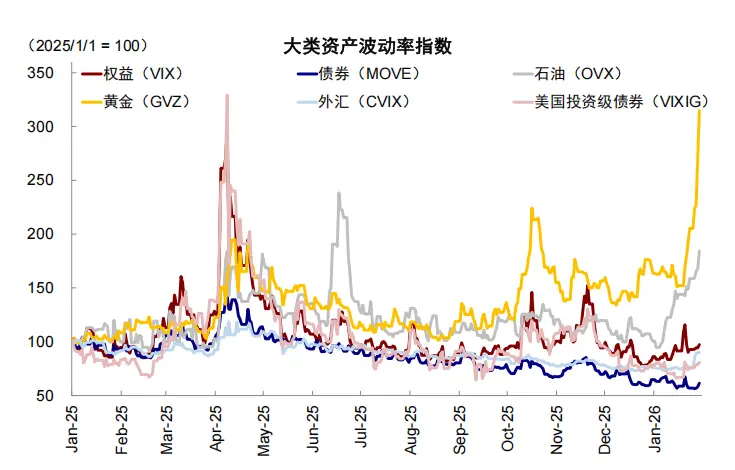
Source: Bloomberg, CICC Research Department
Chart 5: The correlation between gold prices and ETFs has reached the highest value since data collection began
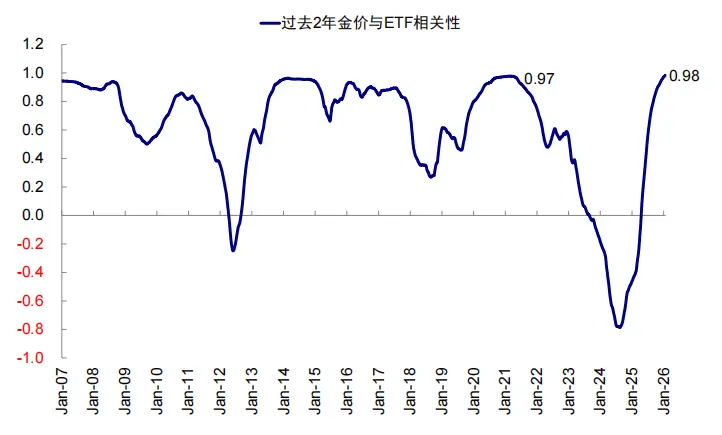
Source: Wind, CICC Research Department
However, aside from the short-term rapid rise and fall, the fact that gold has exceeded $5,500/ounce is indeed an important watershed. It marks that the total value of existing gold ($38.2 trillion) is now comparable to the total outstanding U.S. debt ($38.5 trillion) [1], a first since the 1980s, indicating that the global structure established after the collapse of the Bretton Woods system, which anchors the dollar and bases it on U.S. debt, has shown some signs of loosening.
Chart 6: Our estimation shows that when gold prices rise to $5,500/ounce, the scale of existing gold is comparable to the scale of existing U.S. debt…
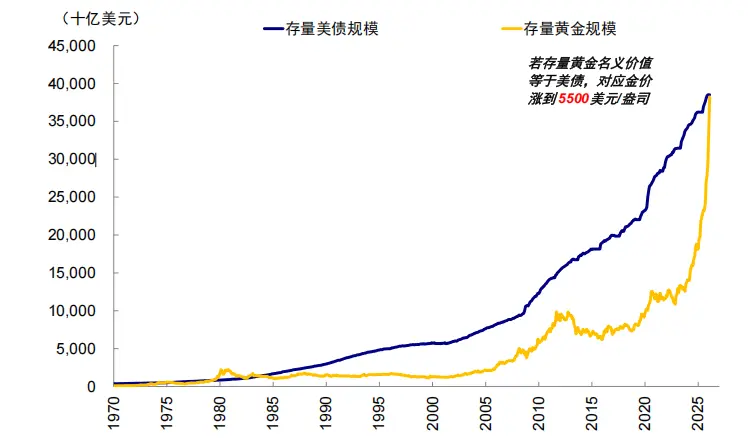
Source: Wind, IMF, WGC, UCGS, CICC Research Department
Chart 7: …for the first time since the 1980s
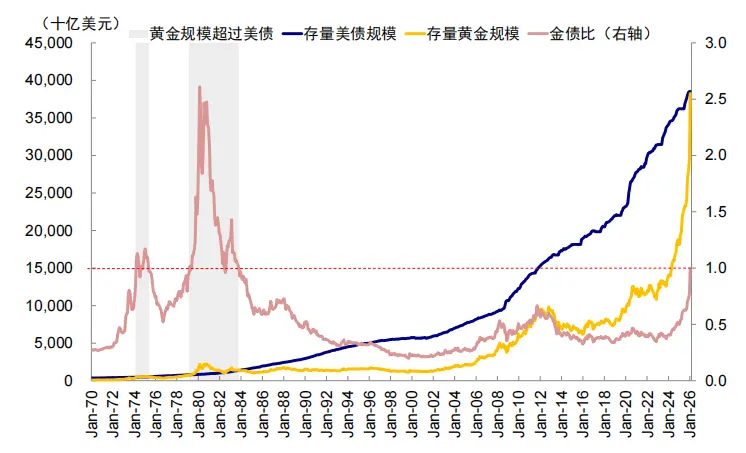
Source: Wind, IMF, WGC, UCGS, CICC Research Department
Gold, which has long been absent from the center of the international monetary system's daily operations, has surprisingly risen to a scale comparable to U.S. debt, which serves as the soil for the dollar and has strong settlement and trading convenience. Is this the ceiling that gold can reach, or the starting point of a revolutionary change? A coincidental observation is that as soon as the gold price touched this level, it immediately faced a sharp correction, seemingly indicating the sensitivity of this position. The answer to this question depends on whether the U.S. can rebuild trust in U.S. debt, which also determines whether gold will face a "Volcker moment," a key issue we will discuss in this article.
I. What Drives the Rise of Gold? A Local Replacement of Dollar Credit Triggered by Distrust in the U.S.
What factors are driving this round of gold's bull market? Finding the reasons will help better judge the future. To answer this question, we first analyze several key factors that influence gold prices:
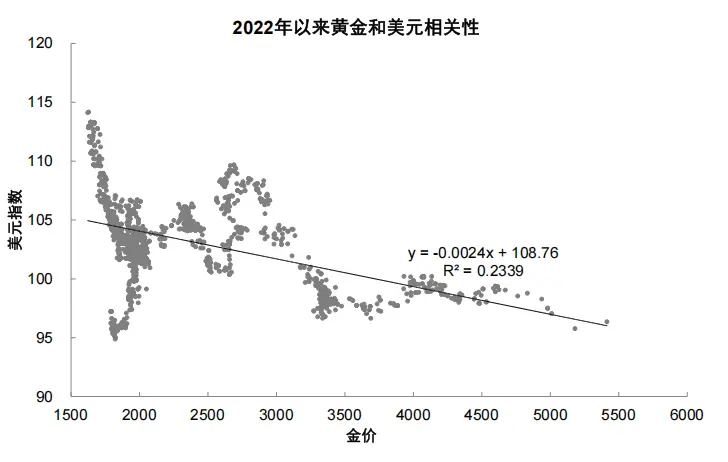
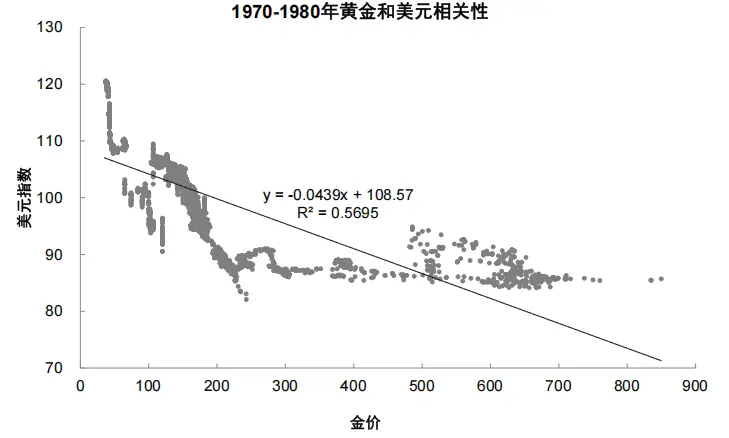
► Is it due to a weakening dollar? Yes, it is a major contributor, but its effect is not as significant as in the 1970s. The dollar dominates commodity pricing, and its weakening enhances gold's reserve value. Since 2022, gold has entered a new bull market, rising 239% from $1,622/ounce in September 2022, corresponding to a 16% drop in the dollar index from its high of 114 in September 2022 to the current 96. Recently, the surprising policy "chaos" from Trump at the beginning of the year has heightened market concerns about escalating geopolitical risks, while also warming expectations for "de-dollarization," leading the dollar to drop to its lowest level in nearly four years (see "What Does Trump Want?"). However, the negative correlation between gold prices and the dollar in this bull market (R² of 0.23 since 2022) is lower than that in the 1970s (R² of 0.57).
Chart 8: The current gold bull market since September 2022 corresponds to the weakening of the dollar
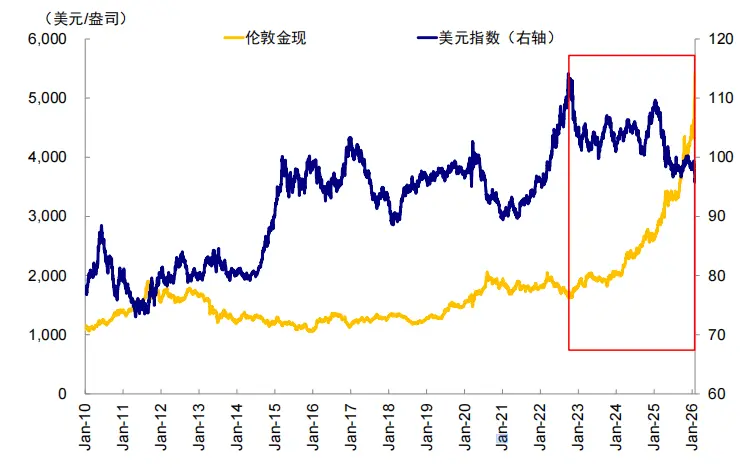
Source: Wind, CICC Research Department
Chart 9: The R² between gold prices and the dollar since 2022 is 0.23
Source: Wind, CICC Research Department
Chart 10: The R² between gold prices and the dollar in the 1970s is 0.57
Source: Wind, CICC Research Department
► Is it due to lower real interest rates? No. Real interest rates are a key component of the traditional gold pricing framework, representing the opportunity cost of holding gold and reflecting gold's anti-inflation properties. However, real interest rates rose from 1% in September 2022 to a peak of 2.5% in October 2023, while gold prices rose against the trend. Not to mention, since November 2025, the slope of gold prices has steepened again, but in the context of fluctuating expectations for U.S. interest rate cuts, real interest rates overall rose from 1.7% to 1.97%, which cannot explain this wave of gold price increases.
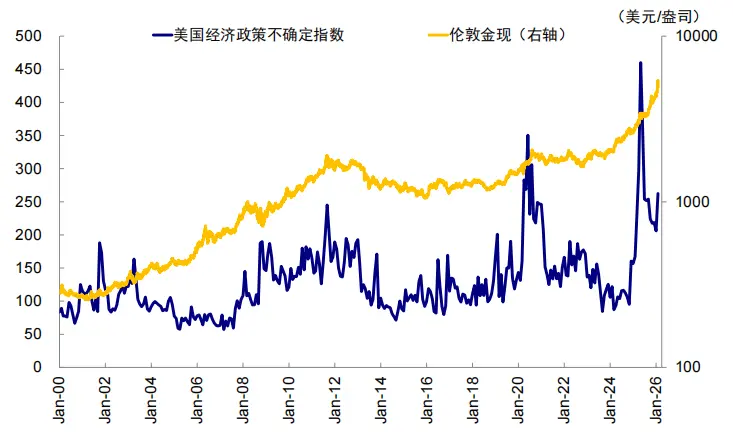
► Is it due to safe-haven demand driven by geopolitical risks? Yes, it is an important factor. Since 2022, geopolitical risks have been frequent, and after Trump was re-elected in 2025 and initiated "reciprocal tariffs," the uncertainty index of U.S. economic policy has rapidly climbed, corresponding to a steepening slope in gold prices.
Chart 11: Since 2025, the U.S. economic policy uncertainty index has significantly increased, accompanied by a steepening slope in gold prices
Source: Wind, CICC Research Department
► Is it due to capital pushing the rise? Yes, capital inflows have accelerated the increase. 1) Central bank reserves: Since the Russia-Ukraine conflict in 2022, central banks in emerging Asian countries, represented by China, have increased their gold reserves. The year-on-year change in gold reserves of central banks in emerging countries rose from a low of -244 tons in August 2024 to a high of 578 tons in January 2024, which can explain the rise in gold prices from 2022 to 2024 (Chart 13). After 2024, central banks continue to increase their gold reserves, although the pace has slowed. 2) Private sector: Correspondingly, the holdings of the SPDR Gold ETF (the largest gold ETF globally, accounting for 27%) have risen from a low of 821 tons in March 2024 to the current 1,087 tons, and the correlation coefficient between ETFs and gold prices has also risen to a historical high over the past two years, proving that the recent rise in gold prices is largely related to speculative capital flows from the private sector.
Chart 12: Since August 2022, emerging countries have increased their gold reserves, driving up gold prices
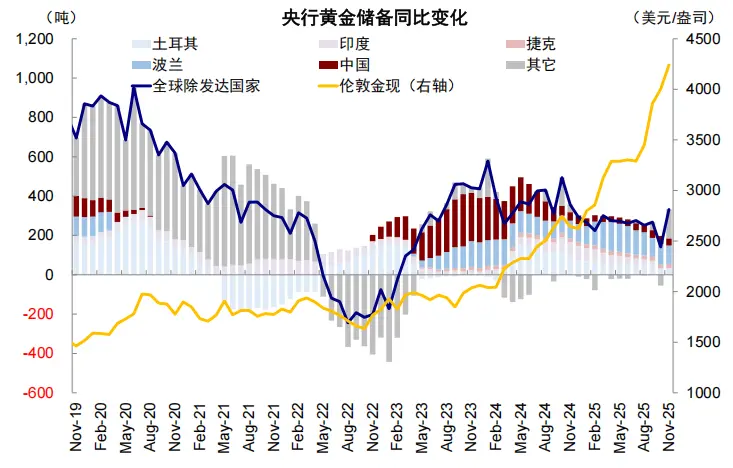
Source: Wind, IMF, CICC Research Department
Chart 13: The holdings of the SPDR Gold ETF have rapidly rebounded, approaching levels seen during the 2022 Russia-Ukraine conflict
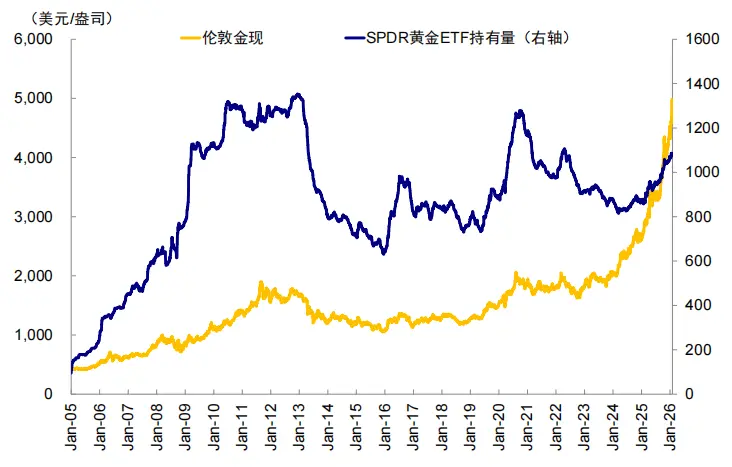
Source: Wind, CICC Research Department
A simple analysis shows that traditional inflation and safe-haven demand can explain part of the rise in gold, but they cannot fully account for such a significant increase. This has led to a deviation of gold prices from traditional pricing models. The underlying key driver is the distrust in the United States (specifically during the Trump era), which has triggered a partial replacement of confidence in the dollar, known as "de-dollarization." This is the "ultimate value" of gold. It is evident that many geopolitical and policy risks in the past couple of years have originated from the U.S. itself, rendering the dollar, which could originally serve as a safe haven, ineffective. A simple comparison shows that during the latter half of the Biden administration from 2022 to 2024, despite facing a series of issues similar to the current ones—such as the Russia-Ukraine geopolitical situation, a weakening dollar, high U.S. debt levels, and rising inflation—the increase in gold prices was less than during Trump's second term. From the starting point of this gold bull market in September 2022 to the elections in November 2024, gold prices rose only 50%, while during Trump's first year in office, gold prices increased by over 100%.
II. Issues with U.S. Debt? Rigid Debt Repayment Constraints, Endogenous Holding Structure, and Shrinking Relative Value
In addition to Trump's various policies damaging global trust, the question of whether U.S. debt is still "safe" is a real reason prompting global monetary authorities and investment institutions to consider diversification. In other words, if a new president takes office in the future, can this trend be reversed? "No longer safe" does not mean default is imminent, but rather that returns are decreasing and credit quality is marginally declining, specifically reflected in:
► Rigid Debt Repayment Constraints: Although U.S. debt cannot default, its superlative status naturally demands greater safety. The interest coverage ratio of U.S. debt (interest expenses/fiscal revenue) has continuously risen since 2021, reaching a historical high of 18.5%, exceeding the 15% "warning line" set by agencies like S&P [2] and Moody's [3] when rating sovereign credit. The increased pressure to pay interest also means that to maintain debt sustainability, the fiscal discretion and flexibility of the U.S. are narrowing, crowding out other fiscal spending. In other words, the "quality of what U.S. debt can repay" is declining.
► Endogenous Holding Structure: Changes in the proportion of U.S. debt held by foreign investors reflect the global demand for U.S. debt as a safe asset. This indicator has fallen from a high of 34% in 2014 to 23% in 2022, before slightly rising to the current 25%. This shift from global reserve assets to ordinary sovereign debt models indicates a weakening of the "extra credit demand" previously enjoyed by U.S. debt.
► Shrinking Relative Value: The nominal value of gold relative to U.S. debt has risen from 0.35 in 2022 to the current 0.99. This continuous increase reflects a marginal decline in investors' preference for U.S. sovereign credit assets, turning instead to physical gold for ultimate value protection.
Chart 14: The U.S. interest coverage ratio has risen to a historical high of 18.5%, while the proportion held by foreign investors is trending downward
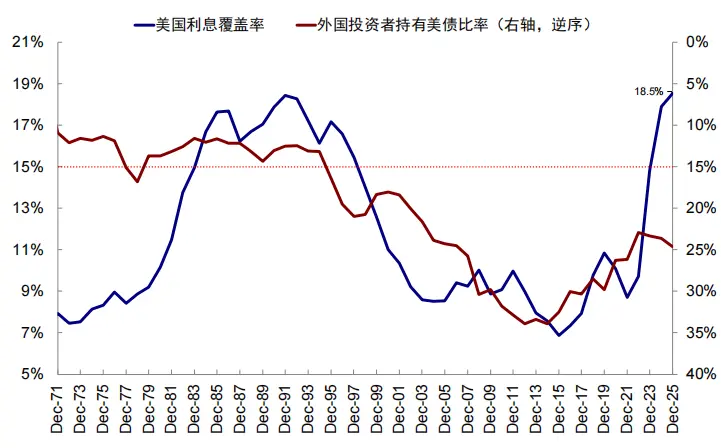
Source: Haver, CICC Research Department
Chart 15: The value of gold relative to U.S. debt has risen from 0.35 in 2022 to the current 0.99
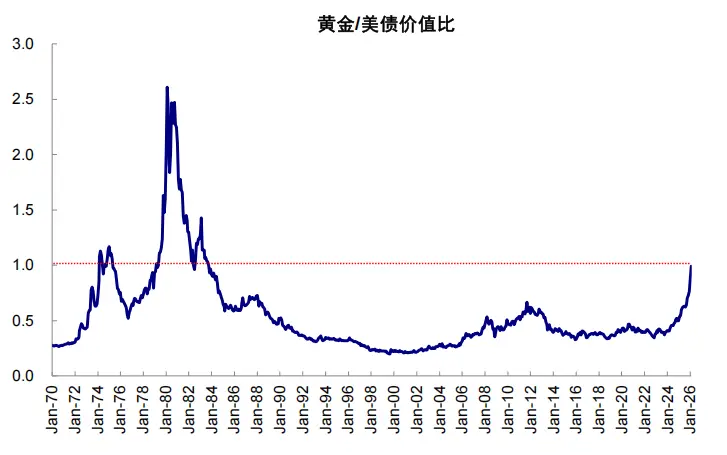
Source: Haver, CICC Research Department
In simple terms, from a fundamental perspective, high interest rates, high payments, and high leverage also raise concerns and criticisms about U.S. debt.
III. "De-dollarization" by Replacing U.S. Debt with Gold? Distinct "Two Camps," Some Increasing Gold Holdings, Others Still Accumulating U.S. Debt
Distrust in the U.S. and issues with U.S. debt have jointly prompted a partial replacement of dollar credit, which is "de-dollarization" and the core driver of gold's rise. However, so far, "de-dollarization" has temporarily manifested as a distinct "bifurcation."
The reason for this is that we have noticed that some monetary authorities are selling U.S. debt to buy gold (mainly in Asia and emerging countries, such as the central banks of mainland China, Turkey, and India, which have increased their gold reserves by 357 tons, 253 tons, and 133 tons respectively since 2022), while other monetary authorities continue to buy U.S. debt, reaching new highs (for example, since 2025, the UK, Japan, and Belgium have increased their U.S. debt holdings by $165.7 billion, $141.1 billion, and $106.4 billion respectively), forming two distinct camps.
Chart 16: Since 2022, countries like China, Turkey, and India have increased their gold reserves the most
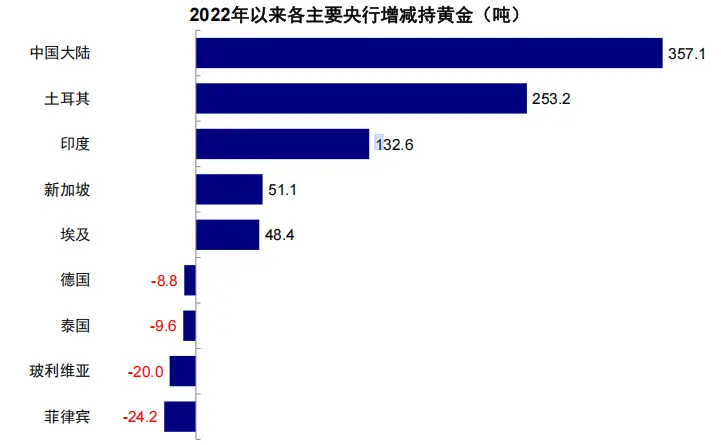
Source: Wind, CICC Research Department
Chart 17: Since 2024, countries like Japan, the UK, and Belgium have increased their U.S. debt holdings
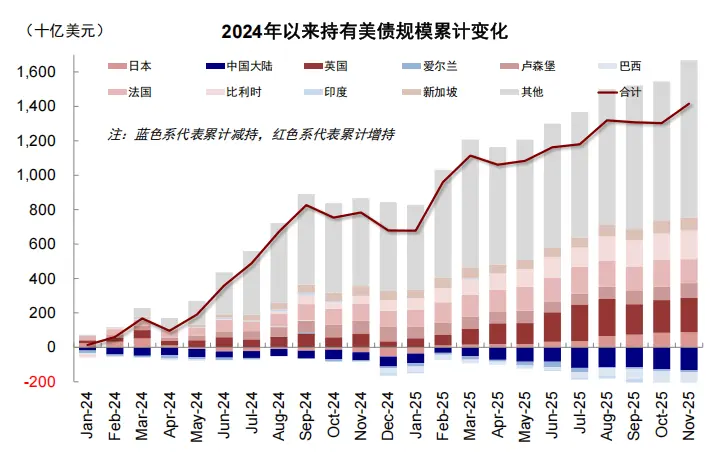
Source: Wind, CICC Research Department
The regional breakdown of gold price increases and ETF fund flows also shows "divergence": 1) Analyzing the gold price increase since 2025 by time periods, as of January 29, the increase during the Asian session reached 33.5%, far exceeding the 9.7% increase during the European session and the 11.2% increase during the American session. In the strong rise of gold prices since 2026, the momentum has mainly come from the Asian market, with increases of 11.4%, 0.3%, and 2.0% in the Asian, European, and American sessions respectively. 2) From the perspective of gold ETF flows by region, recent net inflows into gold ETFs have mainly come from Asia and North America, with net inflows of $4.95 billion and $4.89 billion since 2026, while Europe has seen only $3.36 billion in inflows since 2026.
Chart 18: Since 2025, gold has cumulatively increased by 33.5%, 9.7%, and 11.2% in the Asian, European, and American sessions respectively
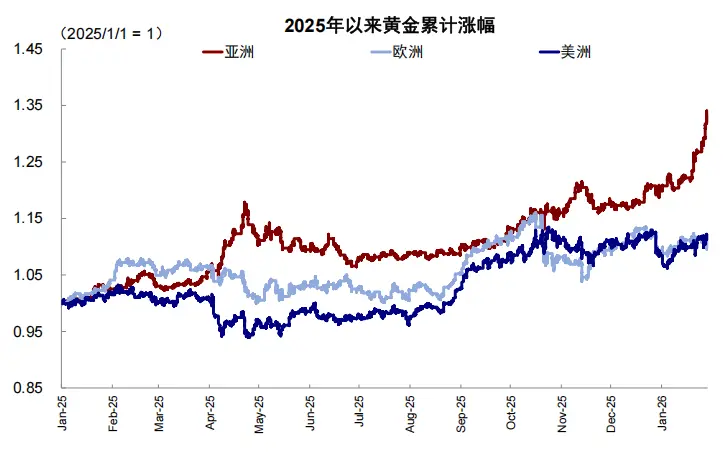
Source: Wind, CICC Research Department; Data as of January 29
Chart 19: Recent inflows into gold ETFs are primarily from Asia and North America
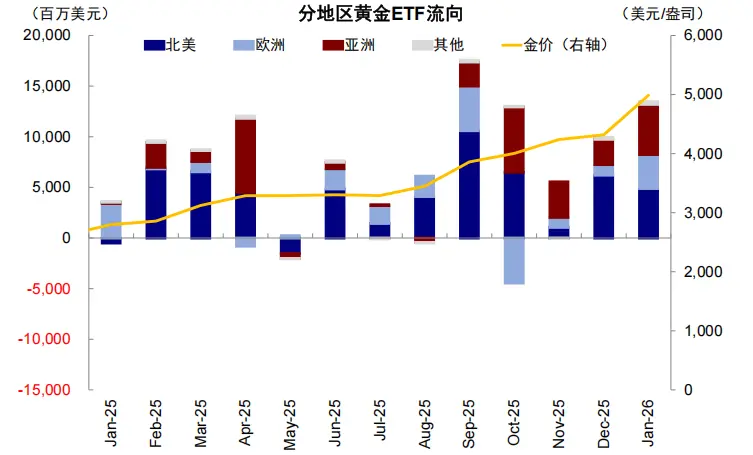
Source: WGC, CICC Research Department; Data as of January 23
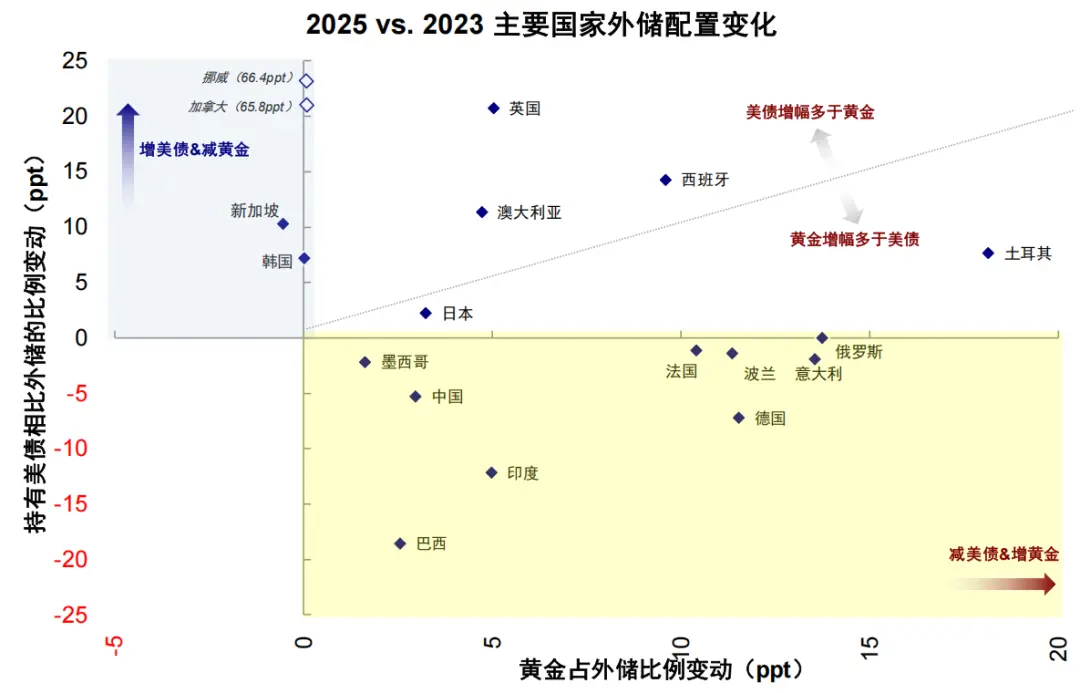
A closer look at the motivations of major countries regarding their holdings of gold and U.S. debt reveals significant differences. We construct quadrants based on the proportion of gold in official foreign reserves exceeding 15% (global median) and the proportion of U.S. debt in foreign reserves (since TIC data includes total holdings by foreign officials and the private sector, some countries may have U.S. debt proportions exceeding 100%): 1) High U.S. debt + Low Gold: This includes Canada, Norway, the UK, Australia, Japan, and Singapore, which remain within the dollar system and pursue liquidity as outward-oriented economies. Holding a high proportion of U.S. debt can meet the frequent needs for cross-border trade settlements while also providing ammunition during exchange rate fluctuations. Notably, Canada and Norway hold no gold in their official foreign exchange reserves, but their U.S. debt holdings are equivalent to 372% and 242% of their foreign reserves, respectively. 2) Low U.S. debt + High Gold: This includes Germany and Italy, which have a deep historical reserve of gold, as well as Turkey, which has significantly increased its gold holdings to combat high inflation and domestic credit crises, and Russia and Poland, which are actively "de-dollarizing" for security reasons. 3) Low U.S. debt + Low Gold: Represented by China, India, South Korea, Brazil, and Mexico, these countries adopt a diversified allocation approach, neither blindly relying on the dollar nor excessively hoarding gold. 4) High U.S. debt + High Gold: The Netherlands and France exhibit a "double insurance" mechanism, holding a high proportion of U.S. debt while still maintaining significant gold reserves. Compared to the end of 2023, before the surge in gold prices, Norway, Canada, Singapore, and South Korea significantly increased their allocations to U.S. debt, while Turkey, Russia, Italy, Poland, Germany, and China notably raised their proportions of gold.
Chart 20: The four quadrants of gold and U.S. debt as a proportion of foreign reserves
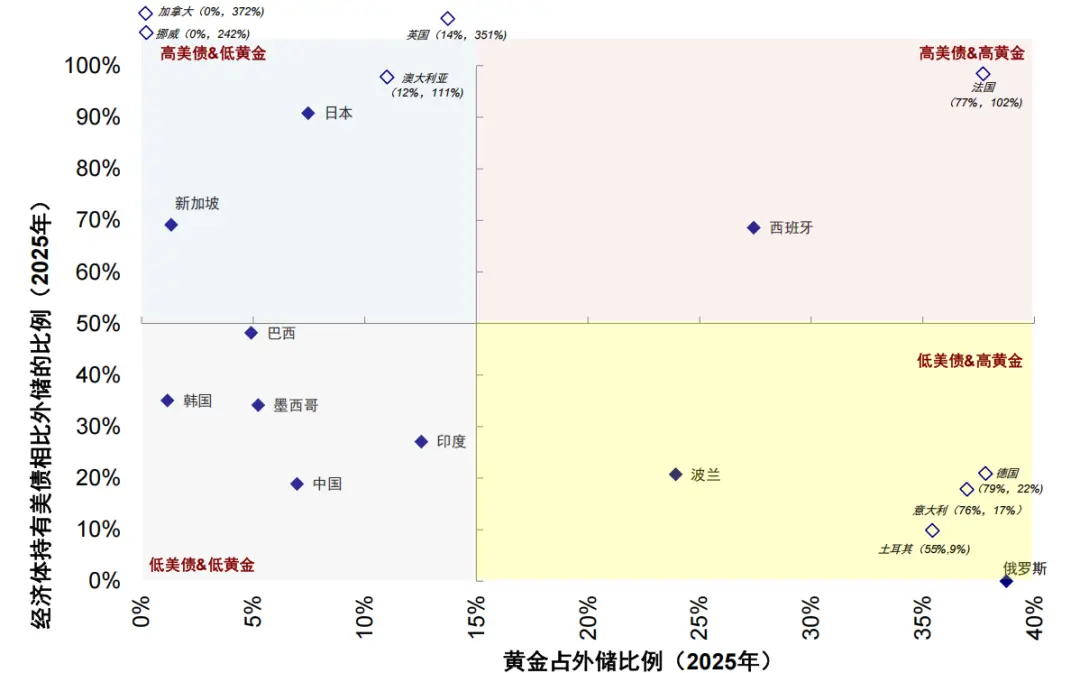
Source: Haver, CICC Research Department; Data is the average for 2025
Chart 21: Compared to the end of 2023 before the surge in gold prices, Norway, Canada, Singapore, and South Korea significantly increased their allocations to U.S. debt, while Turkey, Russia, Italy, and others notably raised their proportions of gold
Source: Haver, CICC Research Department
This indicates that "de-dollarization" has not yet risen to a globally accepted consensus; rather, it is more about "two distinct groups doing different things." After all, for most countries and economies still within the dollar system, there is no need to de-dollarize, and there are no better alternatives if they do. However, for the other group, facing risks such as sanctions and the weaponization of dollar reserve assets, de-dollarization is a reluctant but necessary choice, making the increase in gold reserves almost an inevitable option. These demands have become the main driving force behind the rise in recent years.
But the current question is, since Trump's second term began in 2025, with tariffs targeting the world, especially "allies," and various actions challenging the existing international order, combined with the emergence of gold surpassing U.S. debt as a key watershed, will this originally "distinct" boundary between camps become increasingly blurred? Will more markets belonging to the U.S. debt camp begin to turn towards gold?
IV. What Does It Mean for Gold to Surpass U.S. Debt? Not an Immediate Numerical Node, but a Significant Psychological Watershed
What changes will occur when gold continues to rise and surpasses the key watershed of U.S. debt levels? Will it lead more central banks in the middle ground to consider moderately diversifying their anchors and increasing their allocations to gold? Will Trump's continuous challenges to the existing international order and the use of tariffs as a weapon prompt traditional allies to start reassessing their binding relationship with the dollar? Will the accumulating U.S. debt and interest expenses, coupled with bond yields and inflation that are difficult to effectively reduce, cause ordinary investors holding U.S. debt to worry about short-term returns and the sustainability of U.S. fiscal policy?
In this sense, gold surpassing U.S. debt is not an immediate mathematical milestone, but it represents an important psychological watershed. For countries that are already in the process of "de-dollarization," it goes without saying that they need to increase their gold reserves. However, for those still within the dollar system, especially the wavering "centrists," once they perceive that U.S. debt is being downgraded from "the only global risk-free asset" to "a common high-risk sovereign asset," no longer special, unique, or absolutely safe, it could potentially create a self-fulfilling cycle of expectations. "De-dollarization" cannot be achieved quickly, nor does it need to be immediately realized, but confidence is gradually eroded; sometimes, just having this doubt is enough to prompt some investors to start considering diversification needs, even though the process is slow.
Of course, we also need to view this process rationally. In the foreseeable future, it is difficult for the dollar and U.S. debt to be completely replaced. Undeniably, the dollar's status as a reserve currency remains solid, and it is more likely that the dollar system will experience partial loosening, moving from singularity to plurality.
1) Reserve Share: As of the third quarter of 2025, the dollar still accounts for 57% of reserve currencies, far exceeding other currencies. However, when calculated as a proportion of global reserve assets, foreign official holdings of U.S. debt (21.3%) have already fallen below gold (28.6%, based on the latest gold prices).
Chart 22: As of the third quarter of 2025, the dollar still accounts for 57% of global reserve currencies, far exceeding other currencies
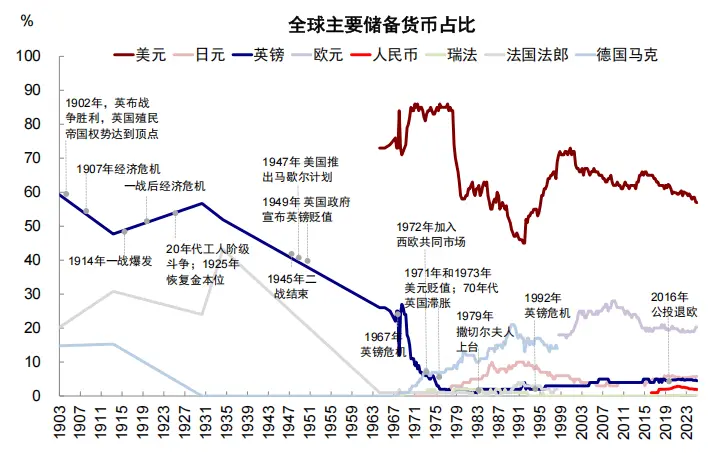
Source: IMF, CICC Research Department
Chart 23: Based on the latest gold prices, the proportion of gold in global reserve assets has exceeded the proportion of U.S. debt held by foreign officials in global reserve assets
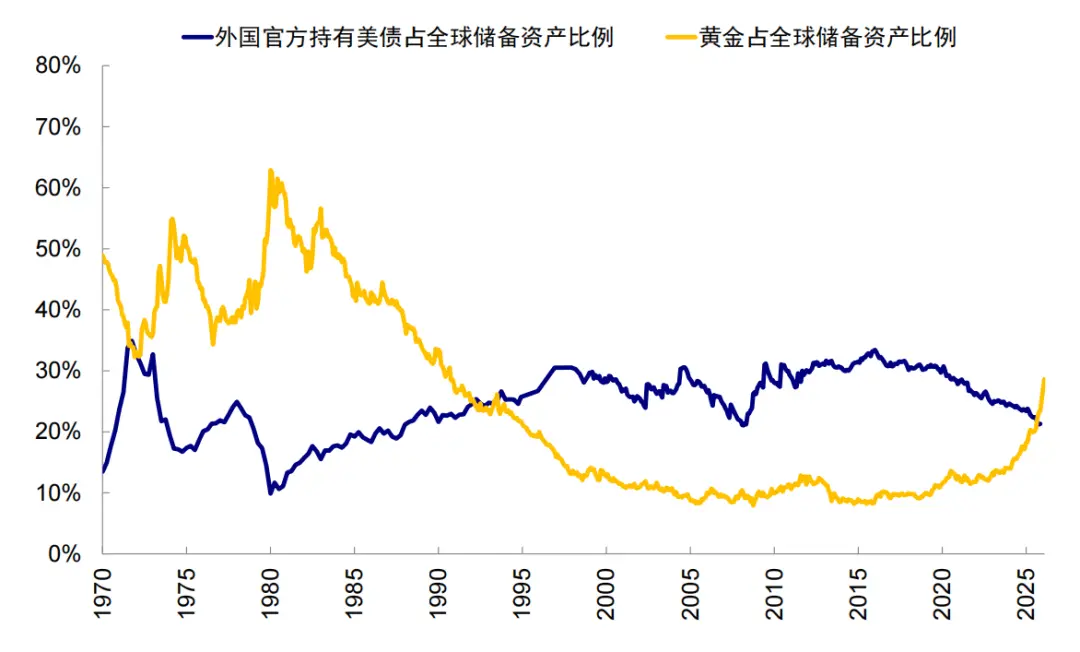
Source: IMF, U.S. Treasury, CICC Research Department; Gold proportion calculated based on the latest gold prices as of January 30
2) International Payment Share: As of December 2025, the dollar accounts for 50.5% of global payments, far exceeding the second-place euro (21.9%). The global banking system (SWIFT) and derivative trading are mostly anchored to U.S. debt, creating a certain network effect, making the cost of switching systems extremely high.
Chart 24: As of December 2025, the dollar accounts for 50.5% of global payments in SWIFT, far exceeding other currencies
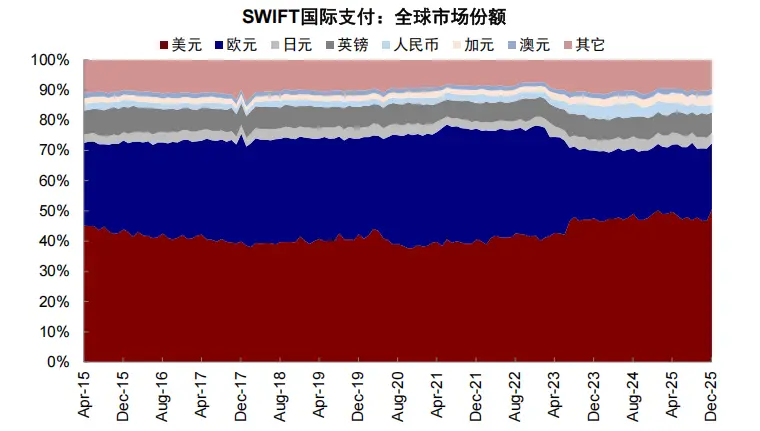
Source: SWIFT, CICC Research Department
3) Trade Financing Share: As of December 2025, the dollar's share in the global trade financing market is 79.5%, far exceeding the second-place renminbi (8.3%).
Chart 25: As of December 2025, the dollar's share in the global trade financing market is 79.5%
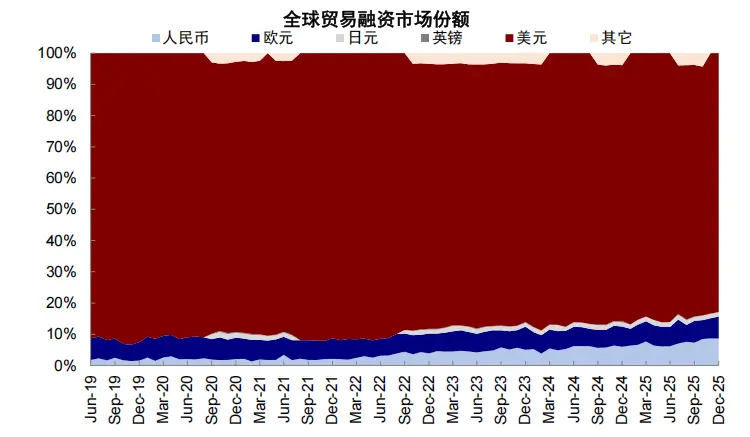
Source: SWIFT, CICC Research Department
4) There is no alternative to the dollar (There is no alternative, TINA). While gold is valuable, it does not yield interest. In the context of damaged dollar credit, it can serve as a safe-haven and store of value asset, but it cannot replace the functions of credit currency in interest rate liquidity supply and asset pricing. Moreover, due to physical quantity limitations, it cannot support the vast global trade settlements. The euro market lacks sufficient depth, and the renminbi has not fully opened its capital account, making it inadequate to fully accommodate a $38 trillion asset pool. More importantly, the so-called "dollar hegemony" is not only based on the credit of the U.S. government and its economic strength but also on the military and technological power of the U.S. As long as these remain, the dollar credit system will have the foundation to continue.
Furthermore, the process of "de-dollarization" could very well reverse or even experience setbacks, and the "old order" is unlikely to willingly be replaced. For instance, possible variables could arise from a new U.S. president changing course, re-embracing globalization, or at least actively cooperating with allies to regain trust; the U.S. economy finding a new pivot to achieve strong growth; the U.S. emphasizing fiscal discipline while the Federal Reserve strongly curtails financial expansion, thereby restoring trust in U.S. debt as a safe asset through this short-term pain; or even implementing controls on gold, selling gold, and imposing taxes as administrative measures, etc. In the 1980s, there was a situation where gold surpassed U.S. debt, but it ultimately ended with the significant cost of Volcker's aggressive interest rate hikes, which restored trust in U.S. debt and secured the dollar's global hegemony for the following forty years.
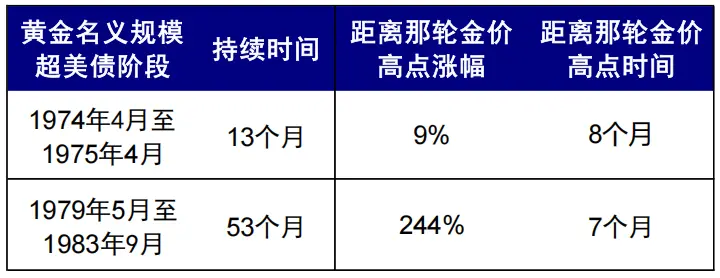
V. Are There Historical Experiences to Learn From? Two Instances in the 70s-80s, Beginning with Uncontrolled Inflation and Ending with Aggressive Rate Hikes
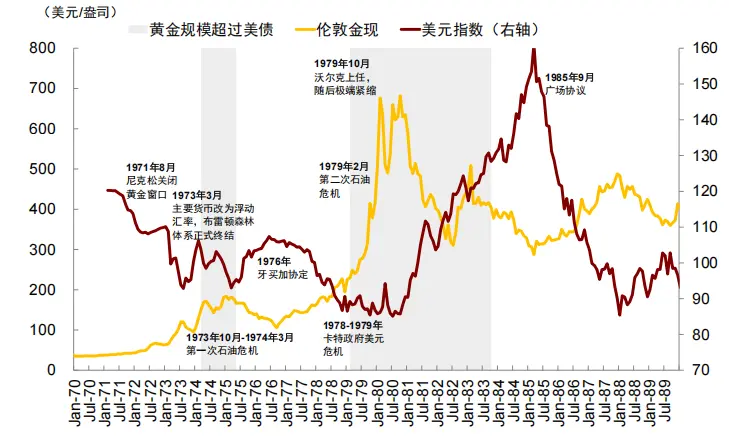
After the collapse of the Bretton Woods system in the 1970s, there were two periods when the scale of gold exceeded U.S. debt: 1) April 1974 - April 1975 (lasting a total of 13 months, with gold peaking eight months after surpassing U.S. debt, increasing by 9%): This began with the devaluation of the dollar following the collapse of the Bretton Woods system and the high inflation brought about by the first oil crisis, ultimately ending with the easing of inflationary pressures and the U.S. government selling gold to intervene in gold prices. 2) May 1979 - September 1983 (lasting a total of 53 months, with gold peaking seven months after surpassing U.S. debt, increasing by 244%): This began with the second oil crisis leading to geopolitical conflicts and stagflation, ultimately ending with Volcker's aggressive interest rate hikes in 1979.
Chart 26: Two longer periods in the 70s-80s when the scale of gold exceeded U.S. debt
Source: Wind, CICC Research Department
Chart 27: However, it ultimately ended with Volcker's significant interest rate hikes, leading to a strong dollar
Source: Wind, CICC Research Department
1) The first instance of gold exceeding U.S. debt: In April 1974, gold peaked eight months later, increasing by 9%
Following the collapse of the Bretton Woods system, the devaluation of the dollar, combined with the high inflation and recession brought about by the first oil crisis, jointly propelled gold to exceed U.S. debt for the first time in 1974. In March 1973, major currencies switched to floating exchange rates, effectively ending the Bretton Woods system and accelerating the devaluation of the dollar. In October 1973, OPEC announced an oil embargo, causing Brent crude prices to surge from $2.7 per barrel to $13 per barrel, leading to rising inflationary pressures in the U.S., negative real interest rates, and a recession that exacerbated the dollar's devaluation and gold's appreciation.
After gold surpassed U.S. debt, the Federal Reserve's attitude towards interest rate hikes was not resolute. Rising oil prices pushed the CPI to continue rising year-on-year in 1974, peaking at 12.3% in December, while real interest rates fell to -4.9%. However, under stagflation pressures, the Federal Reserve early on shifted to a loose monetary policy, with the federal funds rate starting to decline in July 1974, indicating that monetary policy failed to make the "necessary contributions" to curbing inflation and gold prices. The gold price rose from $168 per ounce when it surpassed U.S. debt in April 1974 to a peak of $184 per ounce in February 1975.
How to reverse this? 1) Easing supply-side inflationary pressures: Starting in January 1975, oil prices turned negative year-on-year, leading the U.S. CPI to enter a two-year downward period. 2) Direct government intervention in the gold market: In December 1974, the U.S. government announced the lifting of the ban on residents holding gold, which the Federal Reserve interpreted as a signal that "the government decided to end the monetary function of gold." Subsequently, starting January 6, 1975, the U.S. government began publicly auctioning its gold reserves, increasing market supply and curbing the upward trend in gold prices.
However, the Federal Reserve did not completely resolve the inflation issue. According to research from the Philadelphia Fed, the Fed's hesitant attitude during this period reinforced inflation expectations, which ultimately reflected in higher inflation data; although the CPI year-on-year declined in 1975-1976, it remained above 5.0%. This also set the stage for the more stubborn inflation and greater gold price increases in 1979-1980.
2) The second instance of gold exceeding U.S. debt: In May 1979, gold peaked seven months later, increasing by 244%
The escalation of geopolitical conflicts and stagflation during the second oil crisis led to gold once again surpassing U.S. debt in 1979. Starting in the second half of 1978, the situation in Iran gradually spiraled out of control, culminating in the Iranian Islamic Revolution in early 1979 and the outbreak of the second oil crisis. 1) Geopolitical conflicts: Unlike the first oil crisis, where OPEC actively imposed embargoes and raised prices, the uncertainty of domestic political order in oil-producing countries reached a peak, providing more momentum for gold's rise. 2) Stagflation: Brent oil prices soared from $12 per barrel to $42 per barrel, with supply-side pressures once again pushing inflation up and real interest rates turning negative. The increase in gold prices was even more pronounced, soaring from $247 per ounce in May 1979 to a peak of $850 per ounce in January 1980.
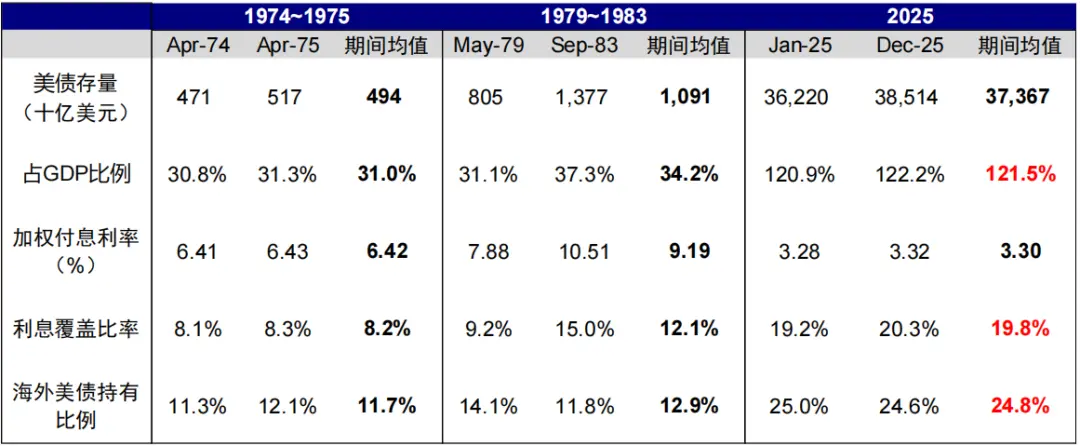
Shortly thereafter, Volcker took strong measures to combat inflation. In August 1979, Volcker became the chairman of the Federal Reserve. Fortunately, although the U.S. was suffering from high inflation at the time, fiscal pressures were not significant, and high inflation even diluted some of the pressure. The ratio of U.S. debt to GDP gradually declined from 1978 to 1979, standing at only 30-31% when Volcker took office (compared to an average of 121.5% in 2025); although the government's interest coverage ratio rose to 9.2% in 1979, the increase was manageable compared to 7.5% in 1970 and was significantly lower than the nearly 20% average in 2025. This provided considerable space for tightening monetary policy. In October 1979, Volcker announced that the policy target would be directly shifted to "money supply," meaning that the rise in the federal funds rate would be unconstrained.
How to reverse this? Volcker's aggressive interest rate hikes, combined with the "Reagan economic cycle," helped the U.S. emerge from stagflation and led to a strong dollar. On one hand, under Volcker's "extreme" monetary tightening, the effective federal funds rate soared from 11.4% before October 1979 to 19.1% in January 1981, and the CPI year-on-year began to cool after peaking in April 1980, driving real interest rates from a low of -4.6% in June 1980 to positive territory by November of that year. On the other hand, after President Reagan took office in 1981, a series of tax cuts and deregulation policies led to renewed economic prosperity in the U.S., with the dollar recovering from a low of 85 in 1980 to a high of 180 before the Plaza Accord in 1985. Gold prices gradually fell from July to September 1980, but due to the previous significant increase in gold prices, it was not until 1983 that U.S. debt surpassed the scale of gold. Volcker's tough monetary policy successfully broke the self-fulfilling mechanism of inflation, and since then, there has been no long-term situation where "the nominal scale of gold exceeds U.S. debt."
VI. The Current "Dilemma" for the U.S.: Low Inflation, Low Interest Rates, and the "Three Choices of Dollar Hegemony"; Difficult to Reshape Trust in U.S. Debt Without "Cost"
It is evident that after the scale of gold surpassed U.S. debt in the 1980s, it was at the enormous cost of Volcker's aggressive interest rate hikes—"killing a thousand enemies while injuring eight hundred of its own"—that anchored inflation and restored trust in U.S. debt, securing the dollar's global hegemony for the subsequent forty years.
For the U.S. government and the Federal Reserve, a current reality "dilemma" is the desire for low inflation, low interest rates to reduce debt costs, and the maintenance of the dollar's hegemonic status without being replaced. Among these three factors, Volcker sacrificed the second one through aggressive interest rate hikes, but unlike back then, although inflation levels are much lower now, the debt levels and interest payment pressures are significantly larger than they were at that time. Achieving inflation anchoring and restoring trust in U.S. debt through substantial interest rate hikes is not an easy task: 1) The current U.S. debt stands at $38.5 trillion, accounting for 122% of U.S. GDP, far exceeding the $8 trillion debt in 1979, which was 31% of GDP. 2) The current interest coverage ratio (the ratio of interest expenses to fiscal revenue) in the U.S. is 19.8%, much higher than the 9.2% when gold surpassed U.S. debt in 1979.
Chart 28: Current U.S. debt pressure is much greater than in the 1970s
Source: Haver, CICC Research Department
An "ideal" scenario for the U.S. and the Federal Reserve would be: 1) A new variable suddenly appears to solve inflation, such as AI significantly improving production efficiency, leading to substantial wage and goods deflation; 2) At this point, the Federal Reserve could lower short-term interest rates while implementing financial repression through balance sheet reduction, moderately increasing long-term rates to enhance the attractiveness and trust in U.S. debt. This aligns with the core proposition of the newly nominated Fed Chair Kevin Warsh, which is why the significant drop in precious metals after his nomination can be seen as a "Volcker moment" rehearsal.
Chart 29: Newly nominated Fed Chair Warsh advocates for interest rate cuts and balance sheet reduction
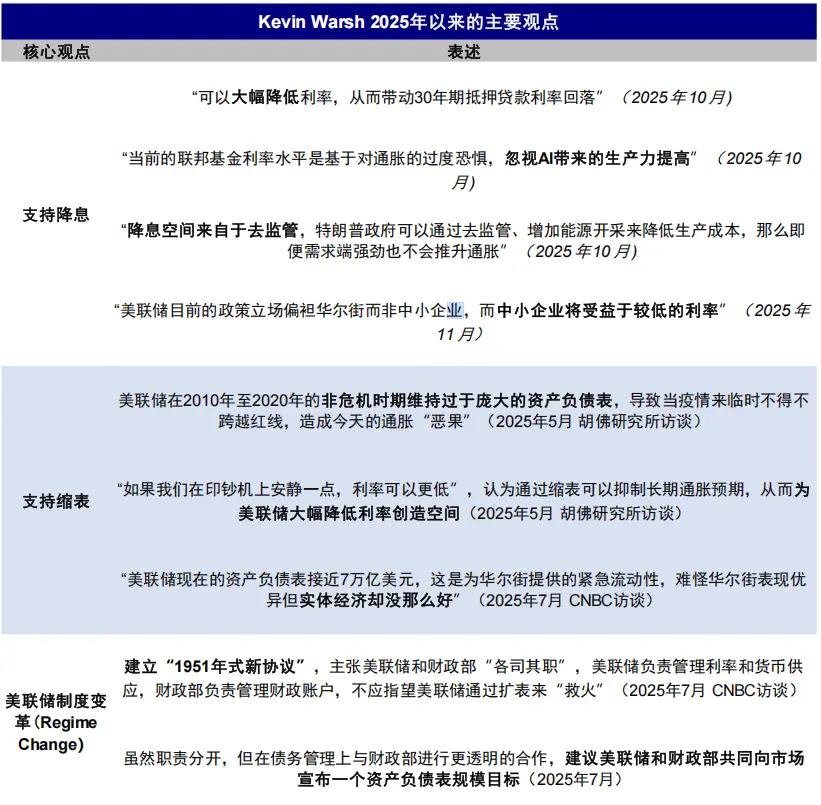
Source: CNBC, Hoover Institution, Reuters, CICC Research Department
However, the actual process may face numerous challenges and is not as straightforward as imagined, such as: 1) How much can AI's efficiency improvement contribute? Can it effectively drive inflation down? 2) Would the Fed's balance sheet reduction not affect financial liquidity and trigger market turmoil, especially considering the upcoming midterm elections, making them cautious? 3) Would balance sheet reduction not increase the financing costs of U.S. debt? The weighted maturity of existing U.S. debt is 5.8 years, shorter than the Fed's 8.8 years, which indeed allows for "selling long to buy short," but the process may not be so "smooth." Would the Fed need to initiate Yield Curve Control (YCC) to stabilize long-term rates? But if so, selling more short-term debt would contradict the interest rate cuts. 4) If interest rates are cut too much, would that reignite inflation expectations? Would that be beneficial for gold? 5) If ultimately faced with a choice between preserving debt or preserving the currency, the exchange rate would undoubtedly be the option with the least cost. While a proactive and significant devaluation like the "Plaza Accord" of the 1980s may be unrealistic, moderately increasing inflation tolerance and slightly depreciating the dollar could effectively alleviate the pressure of existing debt (using cheaper future money to pay off current more expensive debt), but at the cost of undermining long-term trust in U.S. debt, ultimately benefiting gold.
Chart 30: Existing U.S. debt is primarily composed of medium- to long-term bonds, with short-term debt accounting for only 21.6%
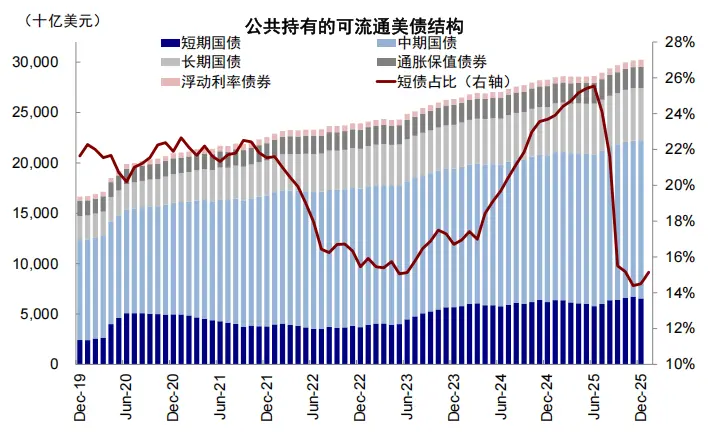
Source: Haver, CICC Research Department
Chart 31: The Fed's holdings of U.S. debt are primarily medium- to long-term bonds
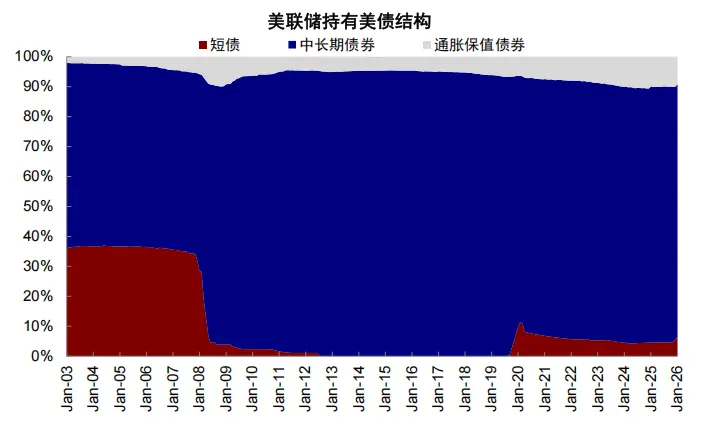
Source: Haver, CICC Research Department
VII. Can We Now Determine the End of the Gold Trend? Not Yet; The U.S. Needs to Pay a High Price to Solve the Trust Issues with U.S. Debt
Returning to the initial question of this article, is $5,500 per ounce the ceiling that gold can reach, or is it the starting point of a new era? We believe that to completely end this gold trend, we need to see the U.S. start to pay a high price to address the "three choices of two" dilemma of low inflation, low interest rates, and dollar hegemony, thereby restoring confidence in U.S. debt and even in the U.S. itself.
But how much can the extent be? Frankly speaking, we cannot provide a definitive answer. In the past two instances, one saw a 9% increase, while the other doubled. However, one thing is certain: gold has entered an "uncharted territory" not seen for decades, and the "old order" cannot simply allow itself to be replaced (Will the newly nominated Fed Chair Warsh become the Volcker of the new era?). Therefore, this will be accompanied by intense competition and turmoil. For investors, while long-term trends are undoubtedly important, they are too grand; short-term fluctuations are crucial for positions and are more grounded, once again highlighting the value of "dollar-cost averaging."
Referring to the experiences of the 1970s, a significant correction in gold prices requires the following conditions, and the end of the trend must address issues of trust in U.S. debt, trust in the U.S., and asset returns:
► The U.S. emphasizes fiscal discipline, and the Federal Reserve strongly curtails financial expansion to resolve trust issues in U.S. debt. If the combination of Warsh's interest rate cuts and balance sheet reduction can be successfully implemented, it would be a new attempt worth close attention. The significant drop in gold on January 30 can be seen as a psychological rehearsal for a "Volcker moment," representing a potential shift in thinking. Looking solely at the impact of balance sheet reduction itself is not that significant (gold prices fell slightly by 0.4% and 1.9% one month after balance sheet reductions in 2017 and 2022, respectively). However, this path requires strong will and the right timing (AI), favorable conditions (financial markets), and political harmony. The U.S. and the Federal Reserve may still have the opportunity to restore the credibility of the dollar and U.S. debt, but if they miss this opportunity, they may head towards complete loss of control.
Chart 32: Referring to previous balance sheet reduction experiences, gold prices slightly fell in the early stages of balance sheet reduction
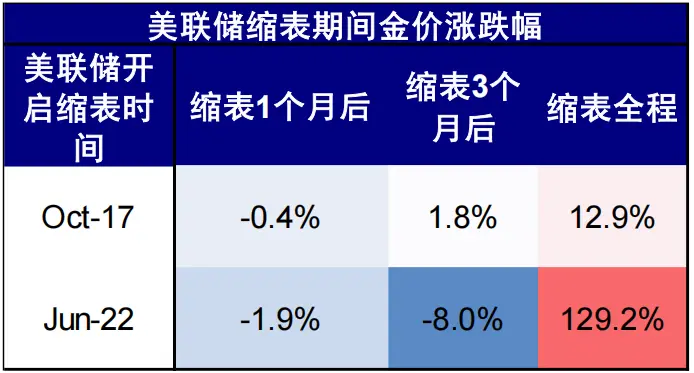
Source: Wind, CICC Research Department
Chart 33: However, from the overall performance of gold prices during the balance sheet reduction, it is clear that balance sheet reduction is not a decisive factor for gold prices
Source: Wind, CICC Research Department
► The U.S. changes course to re-embrace globalization or at least actively collaborates with "allies" to regain trust, addressing the issue of trust in the U.S. This requires Trump to stop causing geopolitical disturbances; market expectations during Trump's term are very low, and observations can be made after the midterm elections.
► The U.S. economy finds a new pivot to achieve strong growth, addressing the issue of asset returns. This requires a significant upward shift in the U.S. credit cycle, with AI being the most likely option to bear the burden. However, whether through interest rate cuts or fiscal expansion, the underlying issues of U.S. debt cannot be completely resolved.
► The government takes control measures. Implementing controls on gold, such as selling gold and punitive taxation, etc. For example, if the U.S. government publicly sells gold as it did in 1975, it would increase short-term volatility but not resolve the fundamental issues.
免责声明:本文章仅代表作者个人观点,不代表本平台的立场和观点。本文章仅供信息分享,不构成对任何人的任何投资建议。用户与作者之间的任何争议,与本平台无关。如网页中刊载的文章或图片涉及侵权,请提供相关的权利证明和身份证明发送邮件到support@aicoin.com,本平台相关工作人员将会进行核查。


