Author| BloFin Academy
Translation| Wu Says Blockchain
TL;DR: Whale 2026 Market Outlook — Liquidity and New Order
· Liquidity Tightening: The Federal Reserve's "defensive rate cuts" in 2025 did not lead to the expected liquidity surge in the market. Instead, large-scale margin credit and financing based on the repo market continued to drain cash/reserves from the banking system; at the same time, the U.S. Treasury's massive issuance of T-bills made liquidity increasingly reliant on short-duration, frequently rolling financing structures, resulting in a deterioration of the quality of dollar liquidity.
· Shift in Allocation Logic: The return of "strict diversification." Funds are no longer solely anchored to dollar assets but are flowing into gold, non-dollar currencies, and supply-constrained assets.
· Three Core Themes: In the context of regionalization, resources (supply side), AI infrastructure (computing power/energy), and national defense security have become the most certain asset classes.
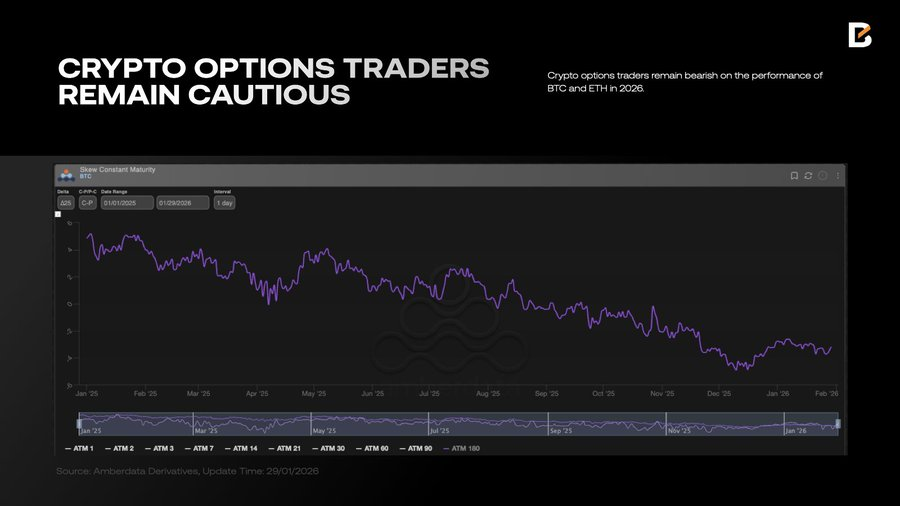
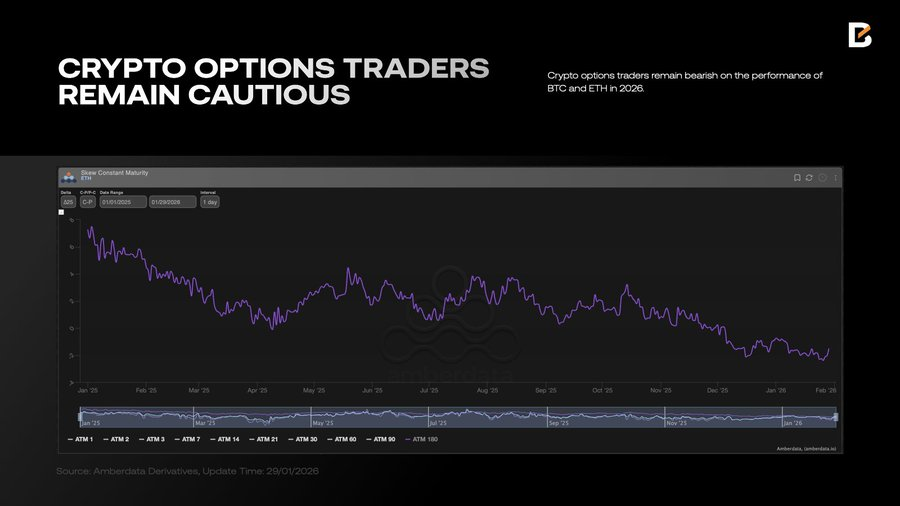
· Differentiation of Crypto Assets: 2026 is a watershed year. Bitcoin, as a "digital commodity," will serve a hedging function, while equity-like tokens will need to provide higher risk compensation under clear regulations and the suppression of high-risk-free rates.
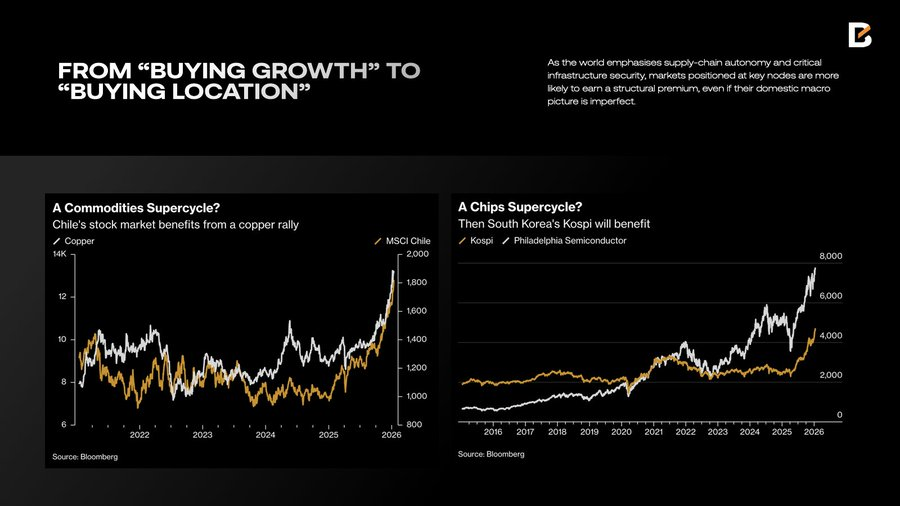
· Core Conclusion: The global market pricing logic is undergoing a paradigm shift — from the globalization era of "buy growth (efficiency)" to a complete switch to the regionalization era of "buy location (security)." In the current complex liquidity risk environment, embracing supply-constrained hard assets (resources/computing power/national defense) is the only solution to address the "new order."
Liquidity: Not Abundant, Quality is Deteriorating
At the beginning of 2025, the main "bullish" factor in investors' minds was Trump's official inauguration. The mainstream view was that he would trigger more rate cuts, inject liquidity, and boost asset prices.
In fact, from September to December 2025, due to concerns about the labor market, the Federal Reserve did implement three "defensive" rate cuts and announced the end of quantitative tightening (QT). However, this did not bring about the "liquidity flood" that investors were hoping for. Starting in October, the effective federal funds rate (EFFR) gradually moved towards the midpoint of the "rate corridor," and then even drifted past the midpoint to the upper limit of the corridor — this is by no means a sign of liquidity easing.
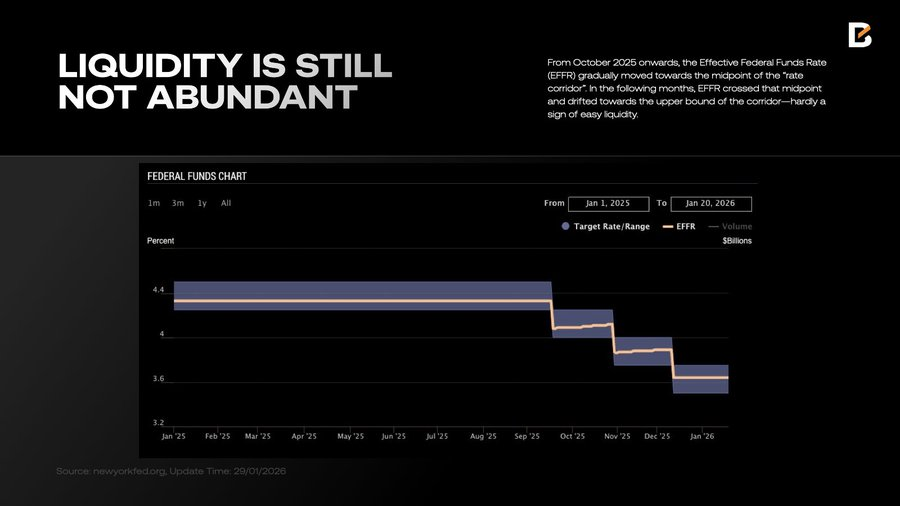
The EFFR is the core short-term market interest rate in the U.S., reflecting the financing liquidity conditions of the banking system. During periods of liquidity easing, the EFFR typically hovers near the lower limit of the corridor (as banks do not need to borrow frequently). However, in the last few months of 2025, banks were clearly facing liquidity tightness — a key driver pushing up the EFFR.
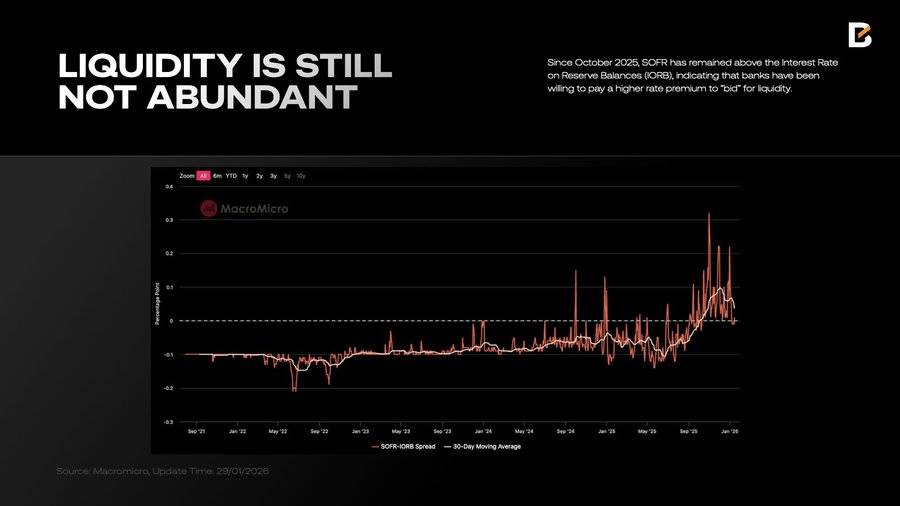
The SOFR-IORB spread further highlights this pressure. If the EFFR reflects the cash market, then the SOFR (secured overnight financing rate) captures a broader liquidity shortage. Since October 2025, the SOFR has consistently been above the interest on reserve balances (IORB), indicating that banks are willing to pay a premium to "bid" for liquidity even when they have collateral.
Even after the Federal Reserve stopped shrinking its balance sheet, the SOFR-IORB spread did not significantly retreat in January. A reasonable explanation is that the liquidity held by banks is largely used for financial investments rather than lending to the real economy.
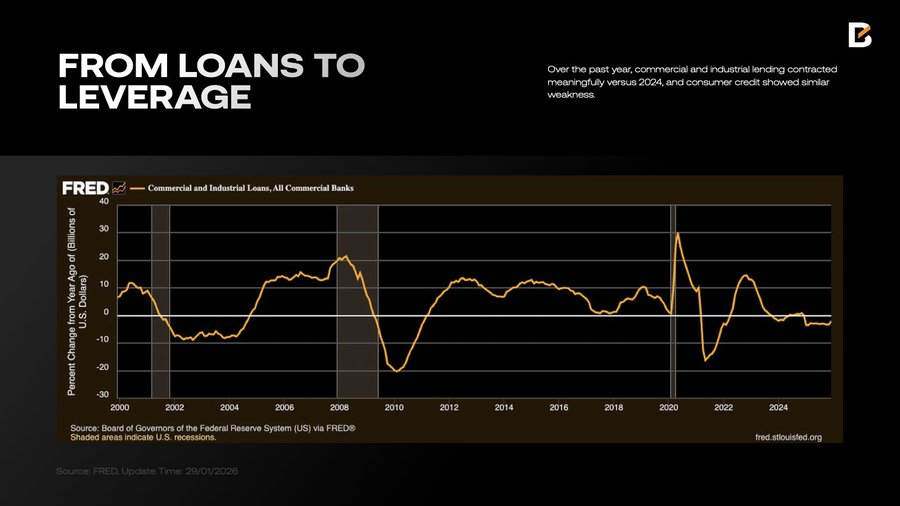
Credit Contraction: Over the past year, commercial and industrial loans have significantly shrunk compared to 2024, and consumer credit has also been weak.
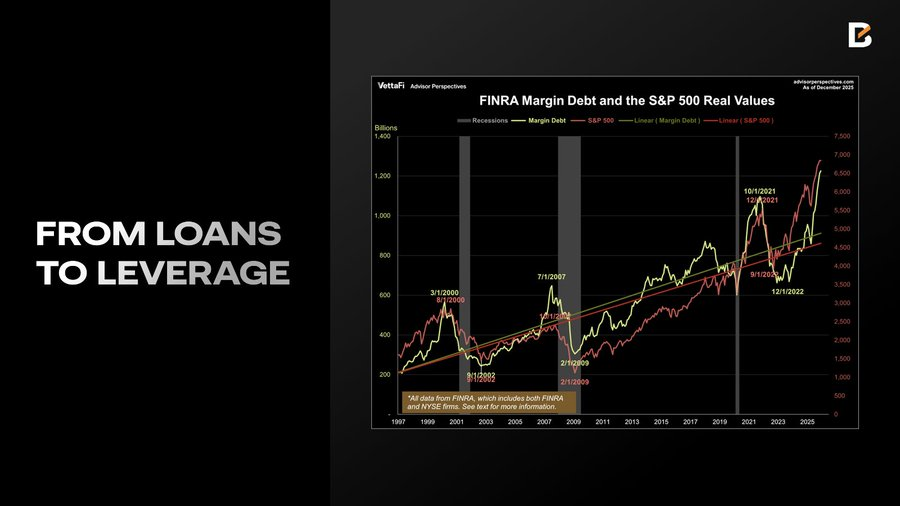
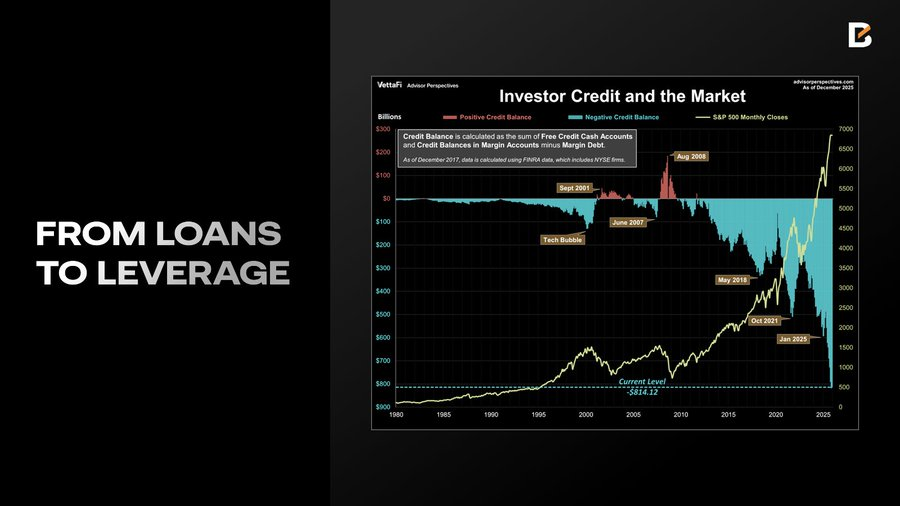
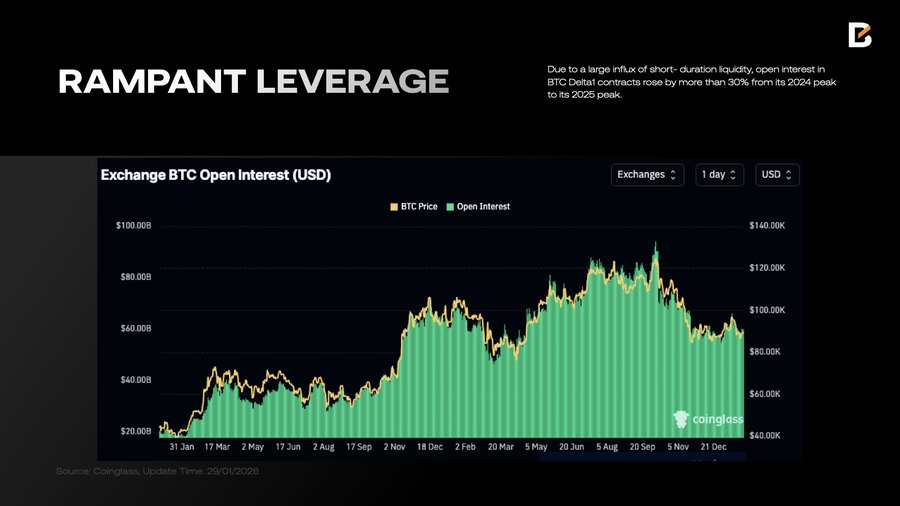
Leverage Surge: In contrast, margin debt has grown against the trend by 36.3%, reaching a historic high of $1.23 trillion in December; the net borrowing balance of investors has also expanded to -$814.1 billion, in line with the growth of margin debt.
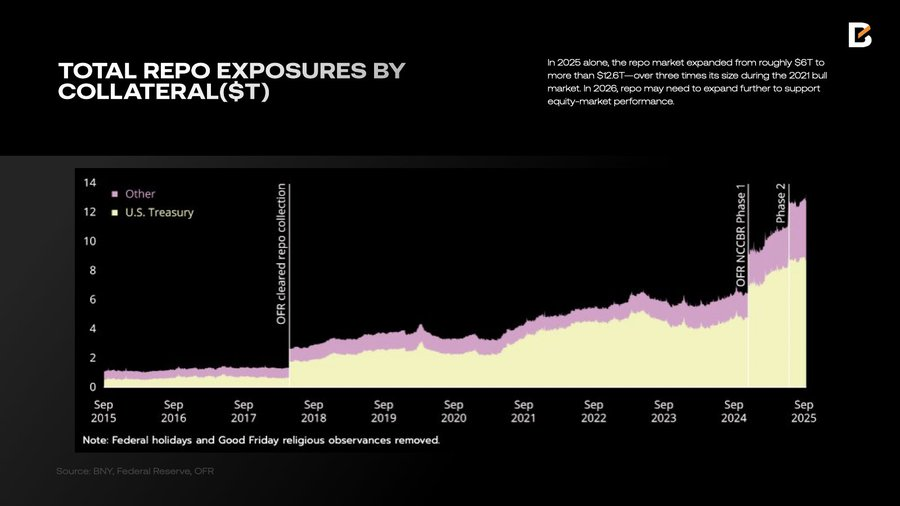
As the liquidity required to boost the market increases, the banking system is showing signs of stress. To maintain high valuations without triggering a stock market sell-off (a path the White House cannot accept), the market is heavily reliant on the repo market for liquidity. In 2025 alone, the size of the repo market surged from about $6 trillion to over $12.6 trillion — more than three times the size during the 2021 bull market. In 2026, the repo market may need to expand further to support the stock market.
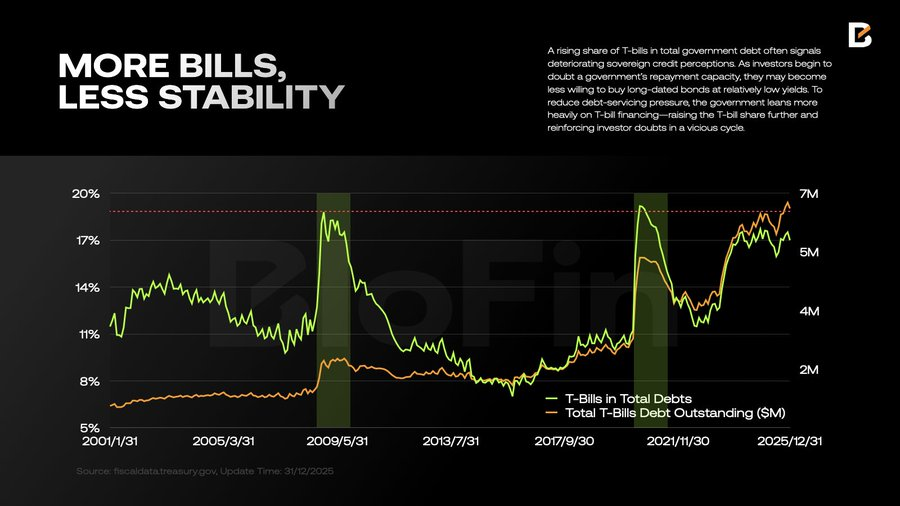
Repo transactions typically use U.S. Treasury securities (T-notes) as collateral. However, since mid-2023, the issuance and proportion of short-term Treasury bills (T-bills) have seen "exponential" growth. This is not a healthy signal: an increase in the proportion of T-bills usually indicates a deterioration in sovereign credit levels. When investors doubt the government's ability to repay, the government is forced to rely on short-term financing, leading to a further increase in the proportion of T-bills, creating a vicious cycle.
Another direct consequence of the rising proportion of T-bills is that changes in the scale of liquidity are no longer stable. Over-reliance on short-term T-bills means more frequent rollovers and shorter average liquidity "lifespans." With overall leverage having surpassed historical peaks, frequent and severe liquidity fluctuations weaken the market's resilience — setting the stage for potential chain liquidations.
In short: The quality of dollar liquidity has significantly deteriorated in 2025, with no signs of improvement.
Risk Premium and "Strict Diversification"
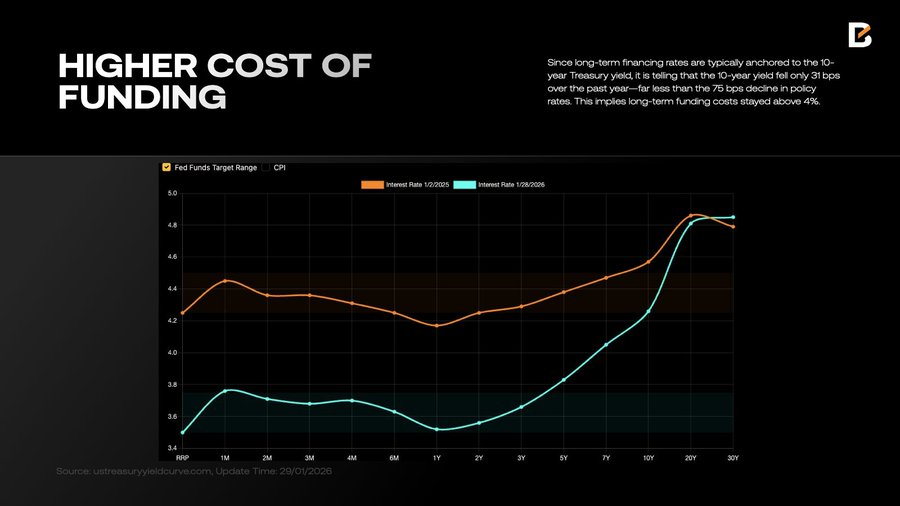
The direct cost of declining dollar liquidity quality is that long-term financing costs remain high. As the scale of U.S. debt surges (reaching $38.5 trillion by the end of 2025) and policy uncertainty rises, systemic risk premiums have also increased. Despite a 75 basis point reduction in policy rates, the yield on the 10-year U.S. Treasury, which serves as a long-term anchor, has only decreased by 31 basis points, indicating that long-term financing costs remain stubbornly above 4%.
High financing costs directly limit position allocation. When the implied forward return rate of a risk asset falls below the Treasury yield, holding that asset long-term loses its appeal. Cryptocurrencies are a textbook example: as implied returns decline, investors gradually reduce their exposure, leading the market inevitably into a bear phase.
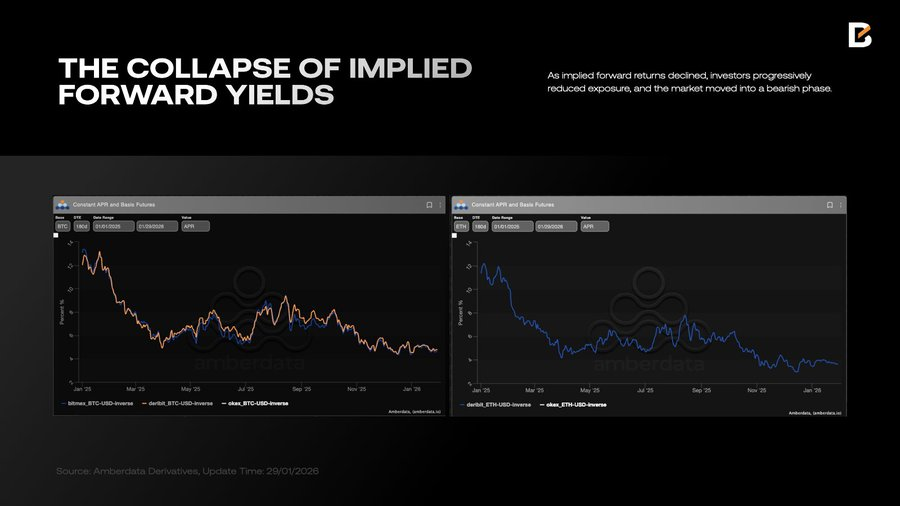
Compared to expensive long-term liquidity, short-term financing obtained through T-bills is much cheaper. But this creates a naturally favorable environment for speculation: investors tend to "borrow short, leverage high, and trade quickly." While the market may appear lively in the short term, this speculative bubble makes rebounds difficult to sustain — a point that is vividly illustrated in the liquidity-sensitive crypto market.
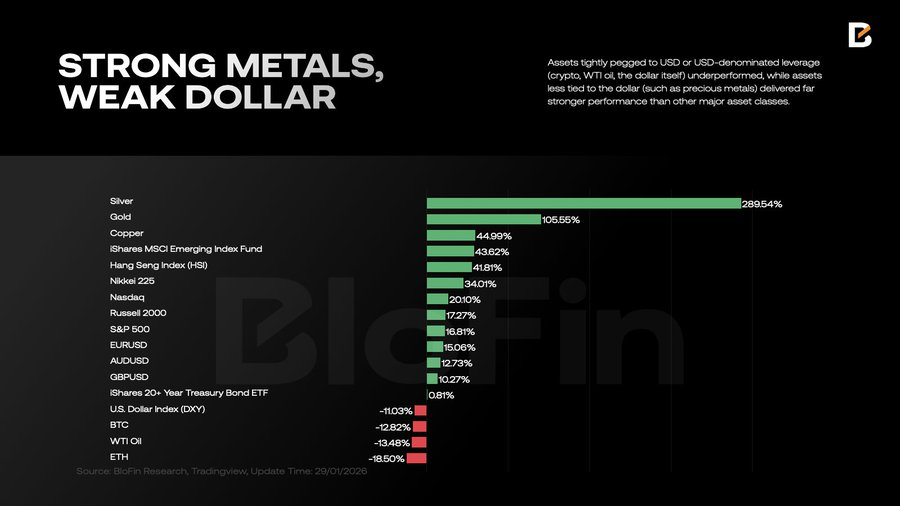
Meanwhile, 2025 witnessed the return of the "strict diversification" strategy. Unlike the traditional 60/40 strategy, liquidity is no longer confined to dollar assets but is diversified across a broader range of targets. In fact, investors steadily reduced their holdings of dollar and dollar-pegged assets throughout the year. The results are evident: assets closely tied to dollar leverage (such as cryptocurrencies, WTI crude oil, and the dollar itself) performed poorly, while assets with lower correlation to the dollar (such as precious metals) significantly outperformed other major asset classes.
Notably, merely holding euros or Swiss francs did not perform worse than holding the S&P 500 index. This indicates a profound shift in investor logic — a shift that transcends a single business cycle.
New Order
What needs to be reassessed in 2026 is not a linear question of "whether growth is strong," but rather that the market is adopting a completely new pricing syntax. The two major assumptions that have supported returns over the past two decades — "extreme efficiency in supply chains" and "central banks' infinite backstop" — are disintegrating. In their place is "regionalization," where the objective function of the global economy shifts from "efficiency at all costs" to "efficiency under security constraints."
Within this framework, the key to allocation is no longer betting in a single direction but recalibrating exposure to three "hard variables": supply constraints, capital expenditures (Capex), and policy-driven order flows.
Stock Strategy: From "Buy Growth" to "Buy Location"
If the past decade was about "buying growth," then 2026 is about "buying location" — that is, the position of assets on the resource, computing power, and security map.
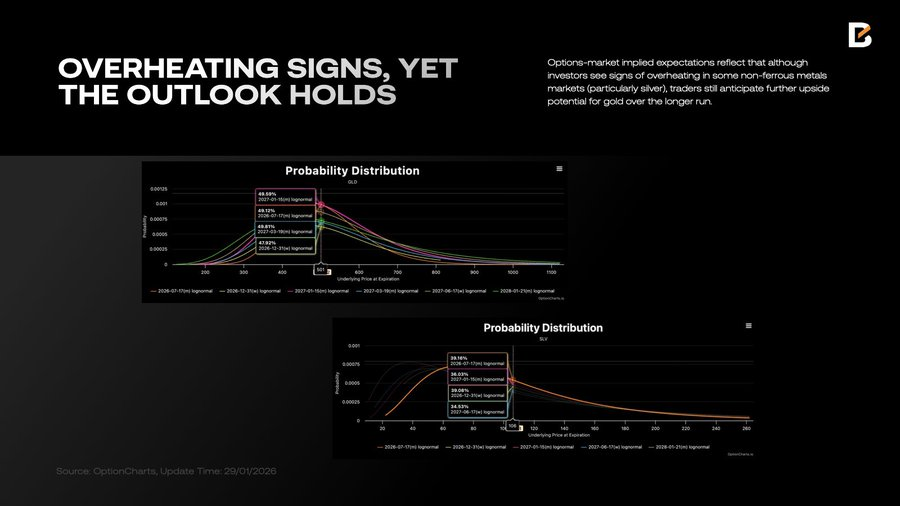
First is resources (supply-side assets). In an era prioritizing security, increasing inventories of commodities (gold, silver, copper) is rational even when not urgently needed. This means that commodities are no longer merely a reflection of the business cycle but possess the attributes of "supply-constrained assets." Options market data shows that, despite signs of overheating in some base metals, traders still expect gold to have further upside potential in the long term.
This logic also provides a basis for allocating to resource country stocks. Copper (like in Chile) reflects rigid demand for electrification and industrial infrastructure; precious metals (like in South Africa) embody both commodity upside and risk premium attributes. For the portfolio, they should be viewed as "supply constraint factors."
Next is AI infrastructure. The focus of allocation should return to the reality of balance sheets: computing power, energy, data centers, and cooling systems. Instead of chasing application layer software narratives, it is better to lock in a new round of physical infrastructure. Markets like South Korea, which are at the global interface of the computing power industry (semiconductors/electronics), have become direct beneficiaries of the AI Capex cycle due to their more visible capital expenditures and policy support.
In addition, defense and security have returned to investors' sights. Influenced by the normalization of geopolitical tensions, defense spending has become a rigid fiscal function constrained by national security. Although this sector often experiences volatility, it plays a key role as "tail insurance" in investment portfolios. At the same time, the allocation value of Hong Kong stocks and Chinese assets lies in their low valuations and low correlation with Western assets, providing scarce hedging value in the era of regionalization.
Interest Rates and Treasuries: Maintaining a Steepening Curve
The core contradiction in the interest rate market in 2026 can be summarized in one sentence: the front end of the curve is more determined by the path of monetary policy, while the long end resembles a "container" for term premiums. Rate cut expectations do help to lower front-end yields, but whether the long end declines in sync depends on whether inflation tail risks, fiscal supply pressures, and political uncertainties allow term premiums to continue to contract. In other words, the "stubbornness" of the long end does not necessarily mean the market has mispriced the number of rate cuts; it may also indicate that the market is repricing long-term risks.
Supply dynamics will amplify this structural difference. Changes in the U.S. Treasury financing structure will directly affect the supply and demand patterns across different maturities: when the money market has the capacity to absorb, front-end supply is more easily absorbed. In contrast, the long end is more prone to "impulse" fluctuations driven by risk budget constraints and changes in term premiums. The implication for portfolios is clear: duration exposure should be managed in layers to avoid betting on a single path — for example, "inflation completely disappearing, term premiums returning to ultra-low levels." Curve-structured trades (such as steepening strategies) can continue to exist not only because of superior trading skills but also because they align with the different pricing mechanisms of the front and long ends of the curve.
Cryptocurrency: Digital Commodity vs. Risk Asset
In 2026, the crypto market will see sharper internal differentiation. Bitcoin, as a non-sovereign, rules-based "digital commodity," is more likely to be accepted as a payment alternative and hedging tool under the narrative of regionalization. In contrast, equity-like tokens behave more like high-risk assets. In an environment with clear regulations and acceptable risk-free rates, they must provide extremely high risk compensation to prove their allocation value.
Therefore, crypto asset allocation should adopt "segregated management": placing Bitcoin within a commodity framework to gain convexity with a small weight; treating equity-like tokens as high-volatility risk assets with stricter return thresholds.
Centering on "Hard Constraints" and "Structural Differentiation"
In summary, the core of constructing a 2026 investment portfolio lies in managing a series of "hard constraints," rather than mere predictions. This means restoring the strategic position of commodities and resource stocks to address supply bottlenecks, locking in profit visibility through capital expenditures in AI infrastructure, and relying on policy order flows from the defense sector to enhance portfolio resilience; at the same time, it is necessary to adapt to the return distribution reshaping of the bond market due to the return of term premiums and utilize valuation differences in selected non-dollar assets to provide structural hedges.
This does not require investors to perfectly predict every macro event. On the contrary, in the era of regionalization, the most scarce ability is to reduce reliance on "perfect predictions": allowing hard assets to absorb structural demand, letting the interest rate curve absorb macro differentiation, and enabling hedging factors to absorb market noise. The trading philosophy in 2026 is no longer about trying to "guess the answer," but rather about "acknowledging constraints" — and based on this, completely resetting the priorities of asset allocation.
Welcome to join the official ChainCatcher community
Telegram Subscription: https://t.me/chaincatcher;
Official Twitter Account: https://x.com/ChainCatcher_
免责声明:本文章仅代表作者个人观点,不代表本平台的立场和观点。本文章仅供信息分享,不构成对任何人的任何投资建议。用户与作者之间的任何争议,与本平台无关。如网页中刊载的文章或图片涉及侵权,请提供相关的权利证明和身份证明发送邮件到support@aicoin.com,本平台相关工作人员将会进行核查。


