The end of the bear market may arrive sooner than the market expects.
Written by: Matt Crosby
Translated by: AididiaoJP, Foresight News
The end of the Bitcoin bear market may come sooner, as the gold ratio has fallen below the 350-day moving average and reached a key Fibonacci support level, with the current area being an accumulation zone.
Bitcoin has struggled to maintain a consistent correlation with gold, only moving in sync during market downturns recently. However, if we observe Bitcoin prices through the lens of gold rather than the US dollar, we can gain a more comprehensive understanding of the current market cycle. By measuring Bitcoin's real purchasing power relative to comparable assets like gold, we can identify potential support levels and assess when the bear market cycle might end.
Breaking Key Support: The Bitcoin Bear Market Officially Begins
When Bitcoin fell below the approximately $100,000 350-day moving average and the critical six-figure psychological level, it effectively entered the bear market zone, with prices immediately dropping by about 20%. From a technical analysis perspective, a price drop below the "gold ratio multiplier" moving average is typically seen as a signal of entering a bear market, but the situation becomes more interesting when priced in gold rather than the US dollar.
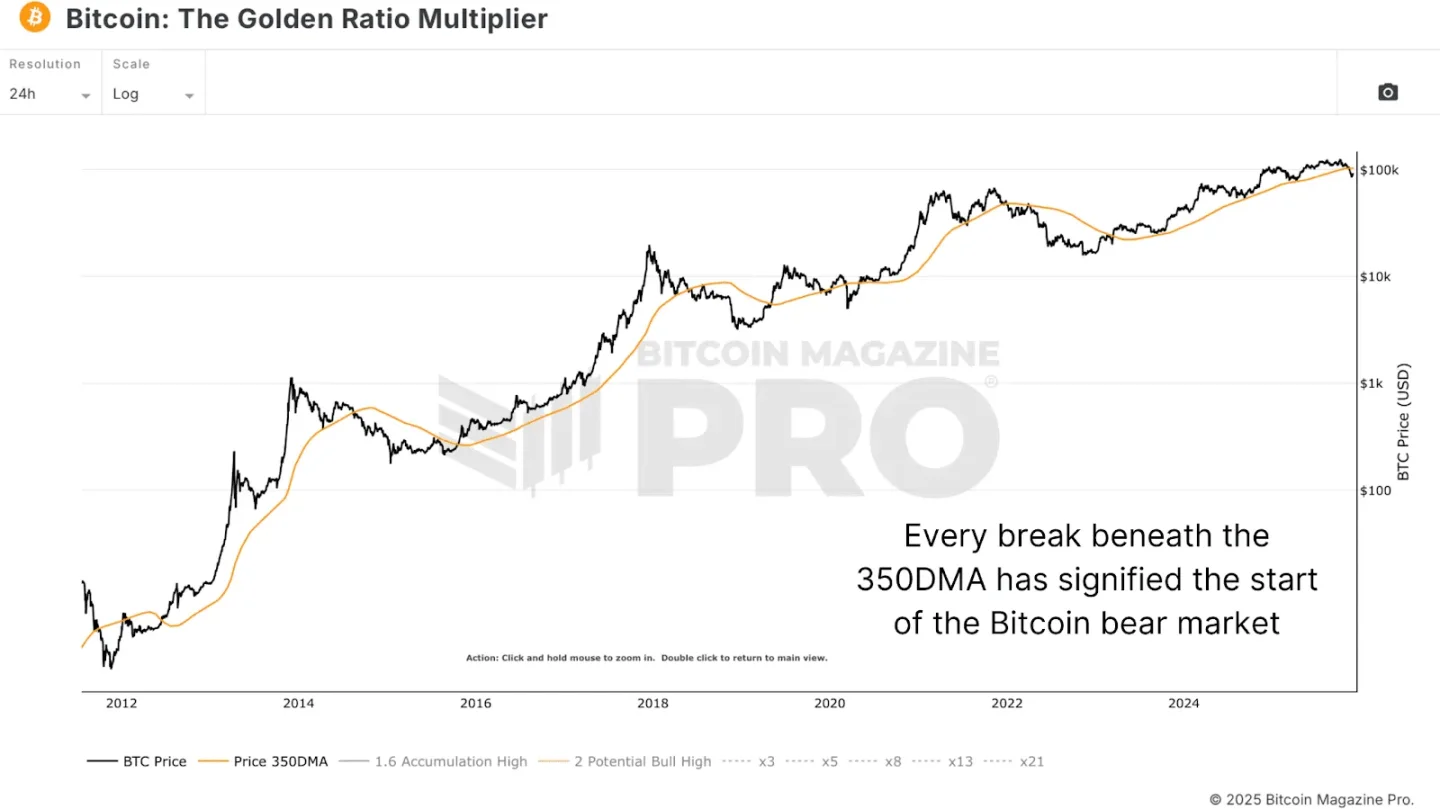
Figure 1: The historical correlation between Bitcoin breaking below the 350-day moving average and the start of bear markets.
The performance of Bitcoin against gold is markedly different from its performance against the US dollar. Bitcoin has dropped over 50% since peaking in December 2024, while the peak priced in US dollars occurred in October 2025, significantly lower than the previous year's high. This discrepancy suggests that Bitcoin may have already entered a bear market, lasting longer than most people believe. Reviewing the historical bear market cycles of Bitcoin priced in gold reveals that the current pullback may be nearing a key support area.
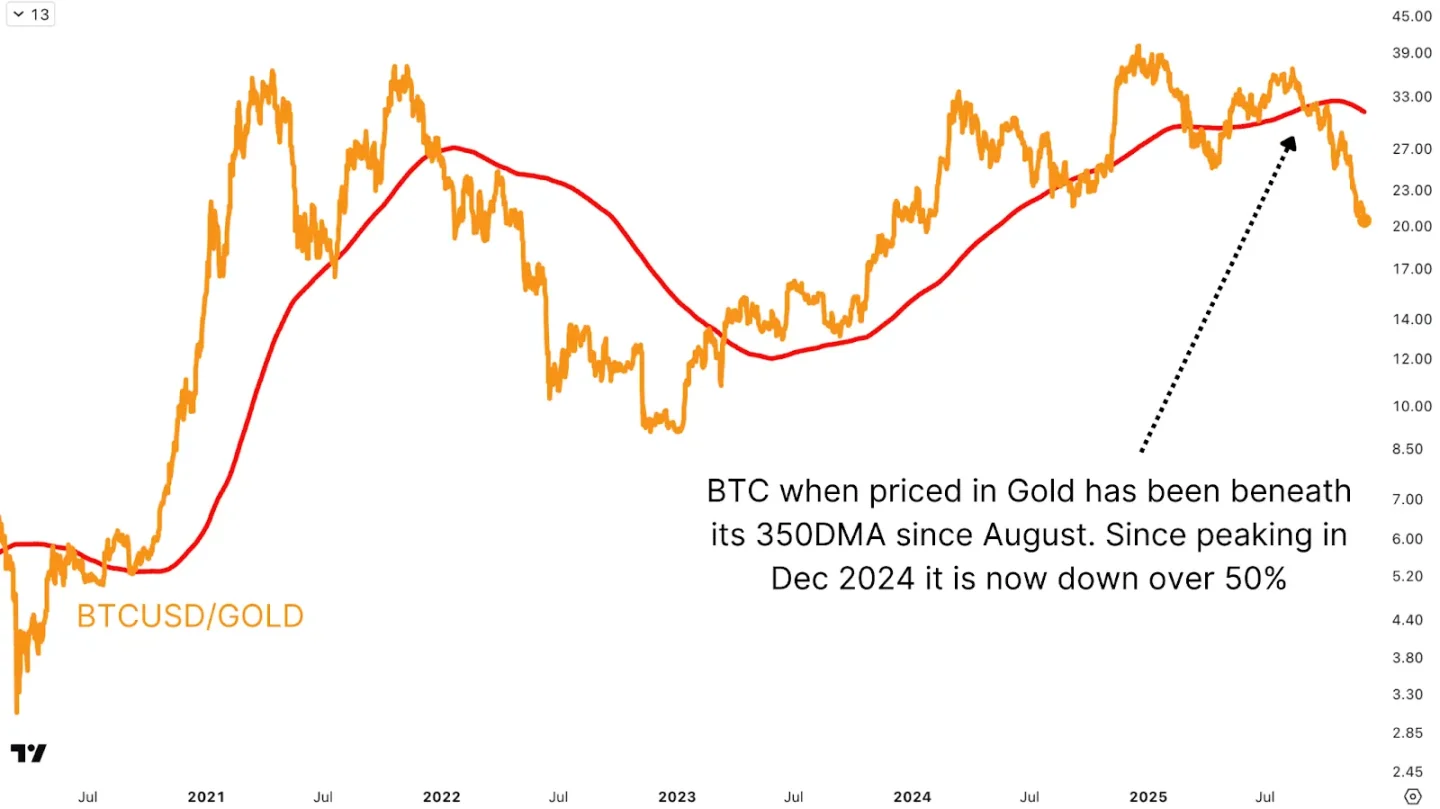
Figure 2: Bitcoin priced in gold broke below the 350-day moving average as early as August.
The bottom of the 2015 bear market cycle occurred after an 86% drop over 406 days; the 2017 cycle lasted 364 days with an 84% drop; the last bear market saw a 76% drop over 399 days. As of this analysis, Bitcoin priced in gold has dropped 51% within 350 days. Although the percentage drop has gradually decreased with the growth of Bitcoin's market capitalization and inflow of market funds, this primarily reflects increased institutional participation and reduced Bitcoin supply, rather than a fundamental change in cyclical patterns.
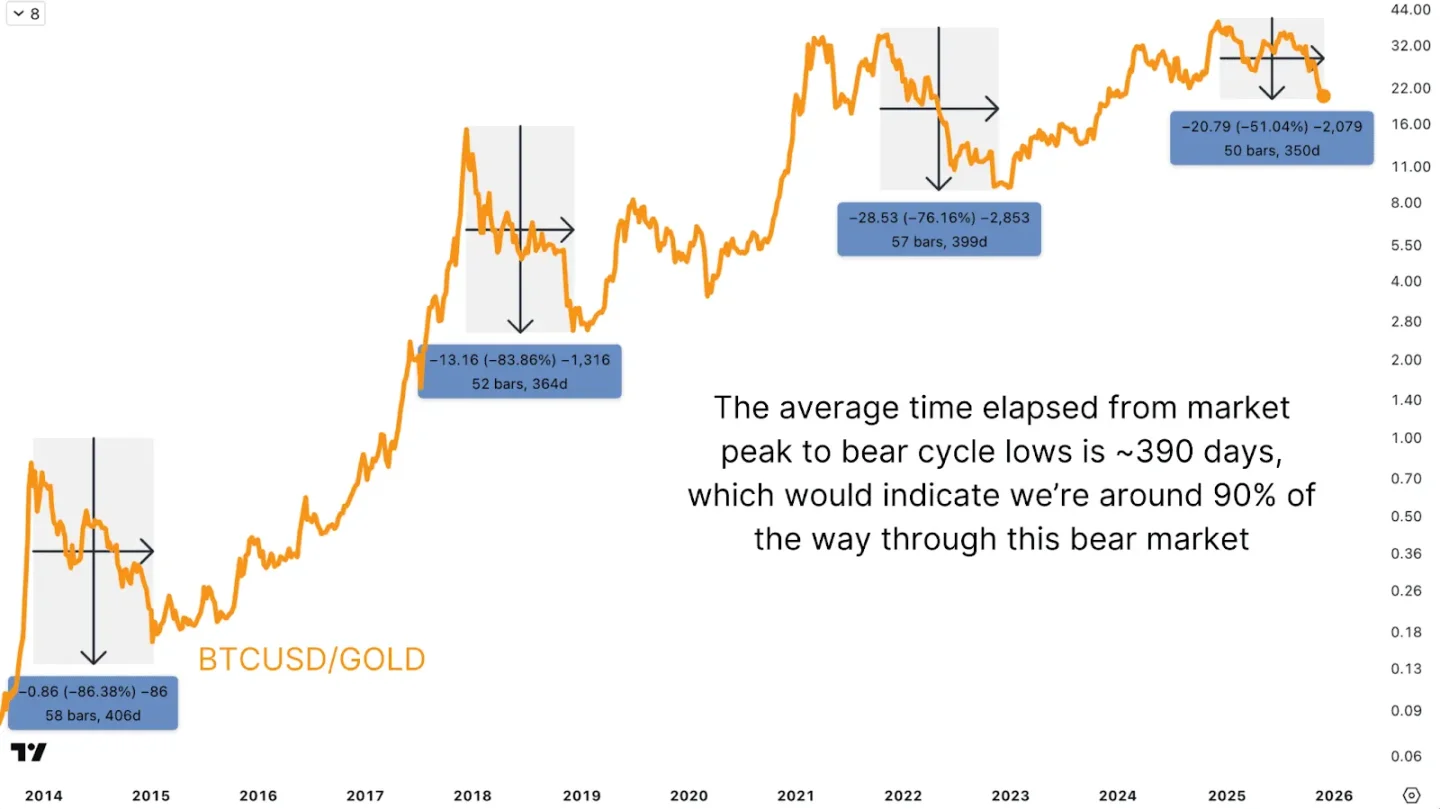
Figure 3: The performance of Bitcoin priced in gold indicates that this bear market may be 90% complete.
Multi-Cycle Indicators Show Bitcoin Bear Market Bottom Approaching
In addition to observing the drop and duration, Fibonacci retracement levels across multiple cycles can provide a more precise assessment. Analyzing from historical cycle bottoms to tops using Fibonacci tools reveals a clear alignment of levels.
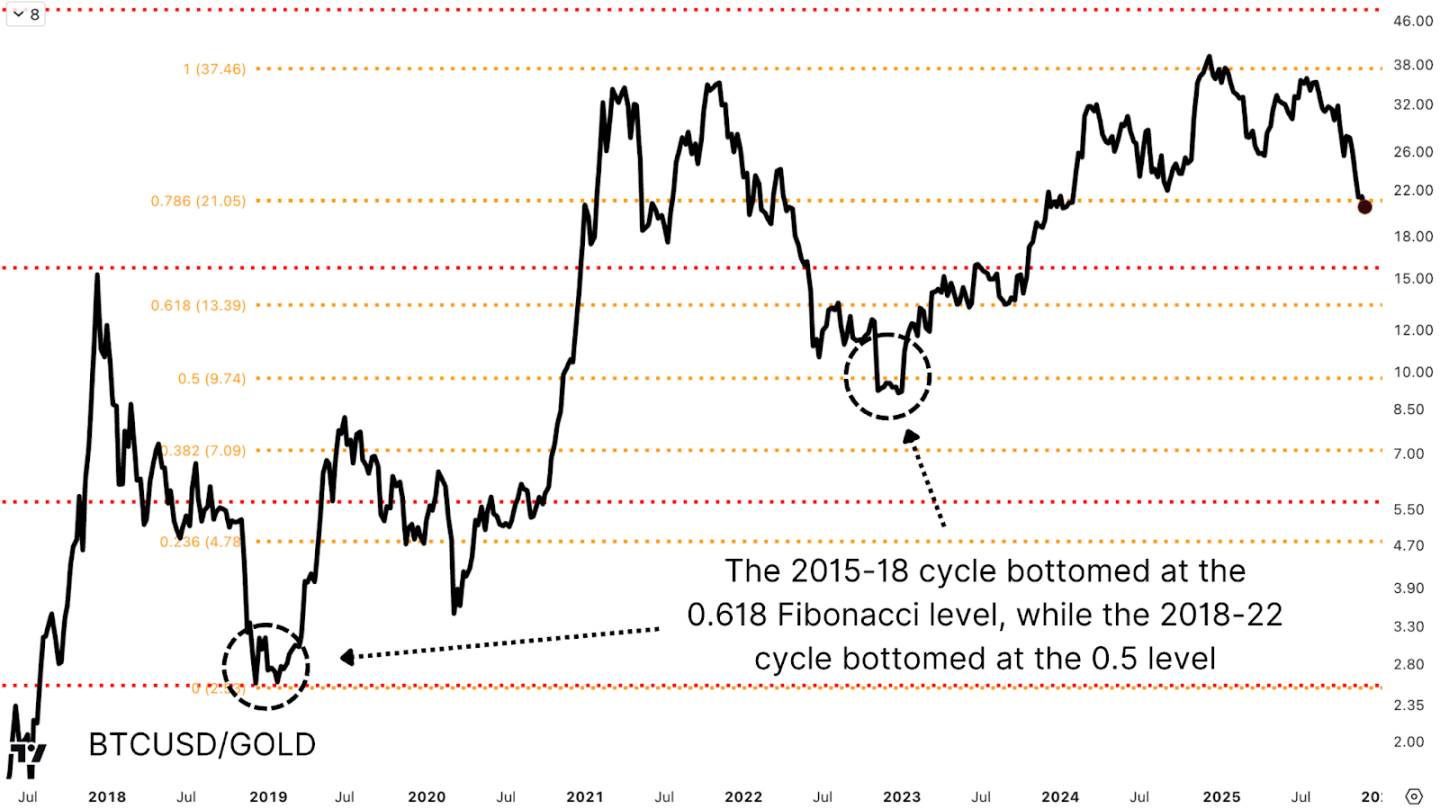
Figure 4: The bottoms of previous bear markets align with key Fibonacci retracement levels.
In the 2015-2018 cycle, the bear market bottom occurred at the 0.618 Fibonacci level, corresponding to approximately 2.56 ounces of gold per Bitcoin; the bottom of the 2018-2022 cycle precisely landed at the 0.5 level, corresponding to about 9.74 ounces of gold per Bitcoin. The latter became an important resistance-turned-support level in the subsequent bull market.
Converting Gold Ratios to Dollar Price Targets
From the low of the last bear market to the high of this bull market, the 0.618 Fibonacci level corresponds to approximately 22.81 ounces of gold per Bitcoin, while the 0.5 level corresponds to 19.07 ounces. The current price is situated between these two levels, potentially forming an ideal accumulation zone from a purchasing power perspective.
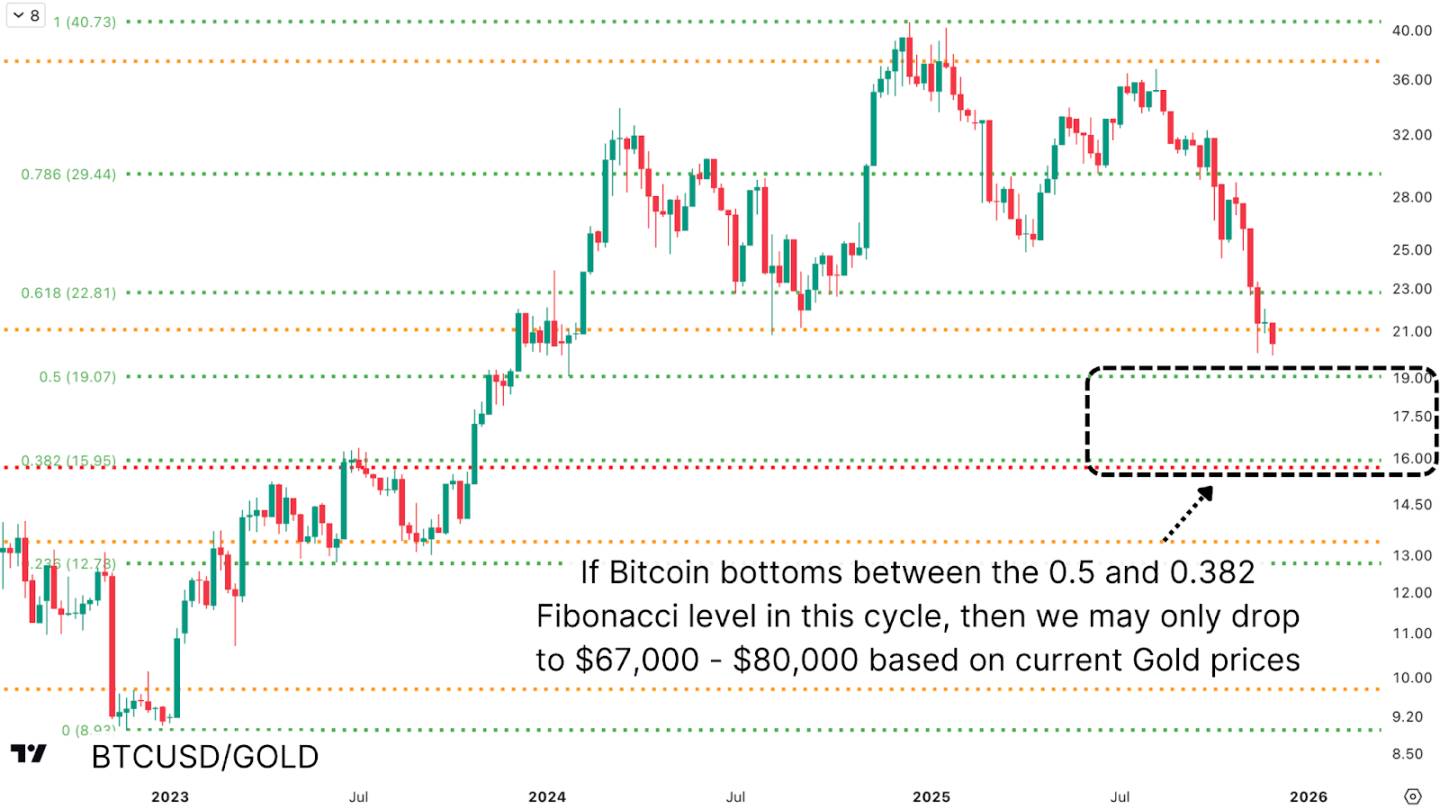
Figure 5: Predicting the Bitcoin low against gold through Fibonacci levels, then converting to dollar prices, suggests potential bottom areas for Bitcoin.
Fibonacci levels from different cycles create multiple overlaps: the current cycle's 0.786 level (approximately 21.05 ounces of gold) corresponds to about $89,160 for Bitcoin; the previous cycle's 0.618 level points again to around $80,000. If further declines occur, the next key technical target is approximately $67,000, corresponding to the 0.382 Fibonacci level (about 15.95 ounces of gold per Bitcoin).
Conclusion: The Bitcoin Bear Market May Be 90% Complete
Measured against assets like gold, Bitcoin's purchasing power has been continuously declining since December 2024, with the bear market duration far exceeding what simple dollar-based analysis suggests. When converted to dollars, the cross-cycle Fibonacci retracement levels indicate strong support in the $67,000-$80,000 range. Although the analysis is theoretical and actual movements may not align perfectly, the data overlaps across multiple time dimensions and valuation frameworks suggest that the end of the bear market may arrive sooner than the market expects.
免责声明:本文章仅代表作者个人观点,不代表本平台的立场和观点。本文章仅供信息分享,不构成对任何人的任何投资建议。用户与作者之间的任何争议,与本平台无关。如网页中刊载的文章或图片涉及侵权,请提供相关的权利证明和身份证明发送邮件到support@aicoin.com,本平台相关工作人员将会进行核查。


