作者:@0xBenniee, @gao2750
数据分析:@gao2750
导语
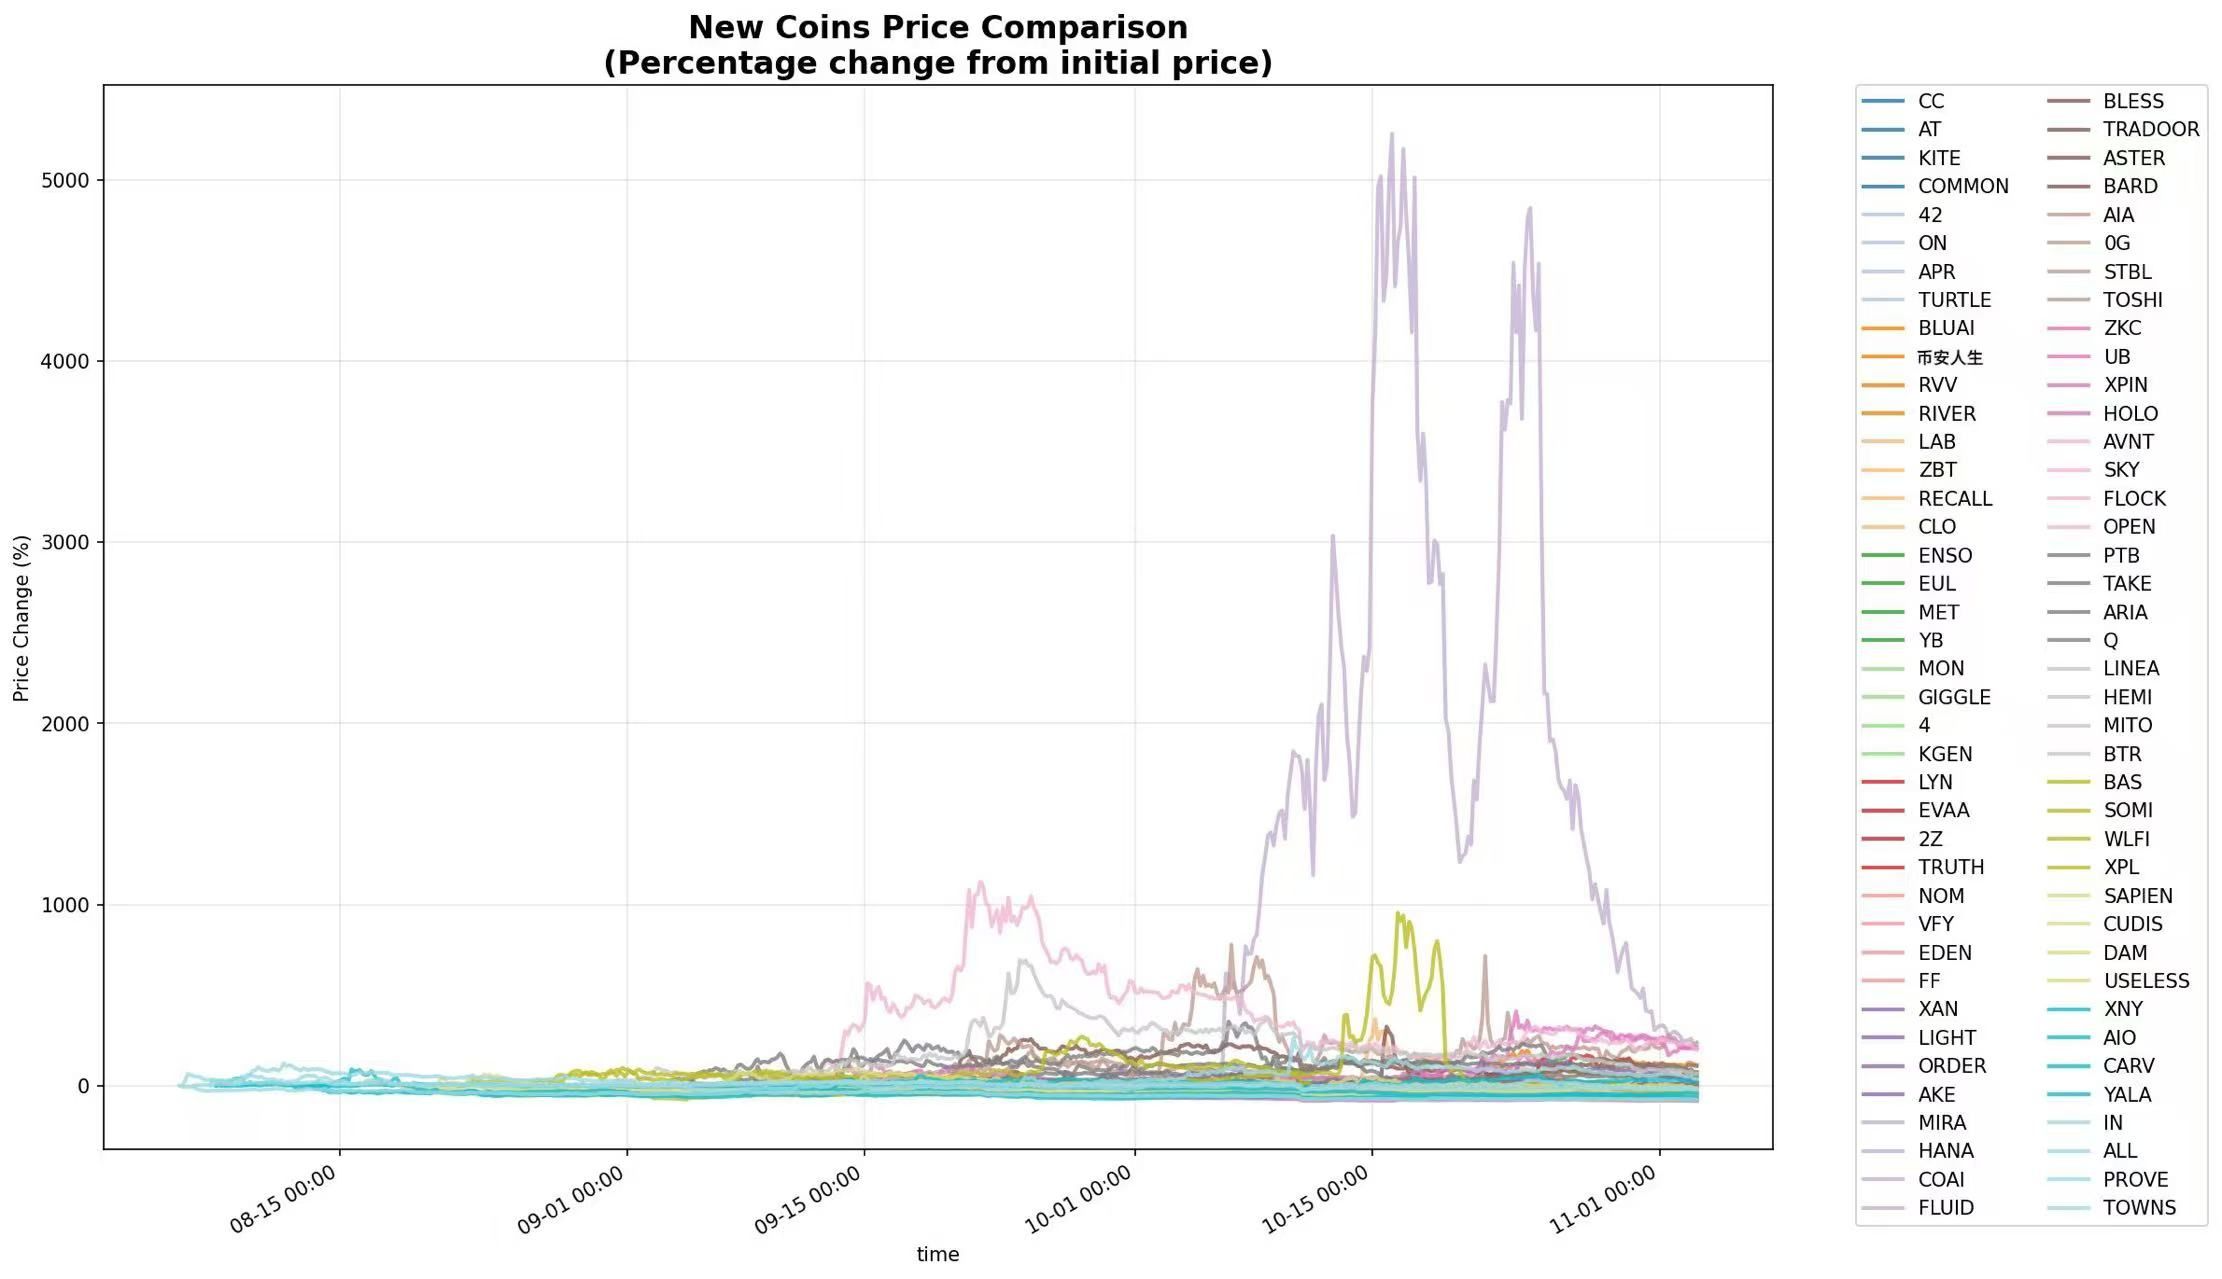
过去一个月,币安共上线 29 个 USDT 永续合约交易对,延续了三季度以来的高频上新节奏。相较于历史月均约 20 个左右的常态节奏,近三个月币安的合约新增数量有明显增长——8 月 19 个、9 月 32 个、10 月 29 个,整体维持在高位区间。其中不乏来自BSC上的热门meme、AI、公链生态 等热门赛道的标的。这一轮高频上新潮,不仅反映了交易所活跃推新的节奏,更显示出项目方希望在市场流动性仍充裕的窗口期集中上线,以配合TGE兑现退出或二级造势。
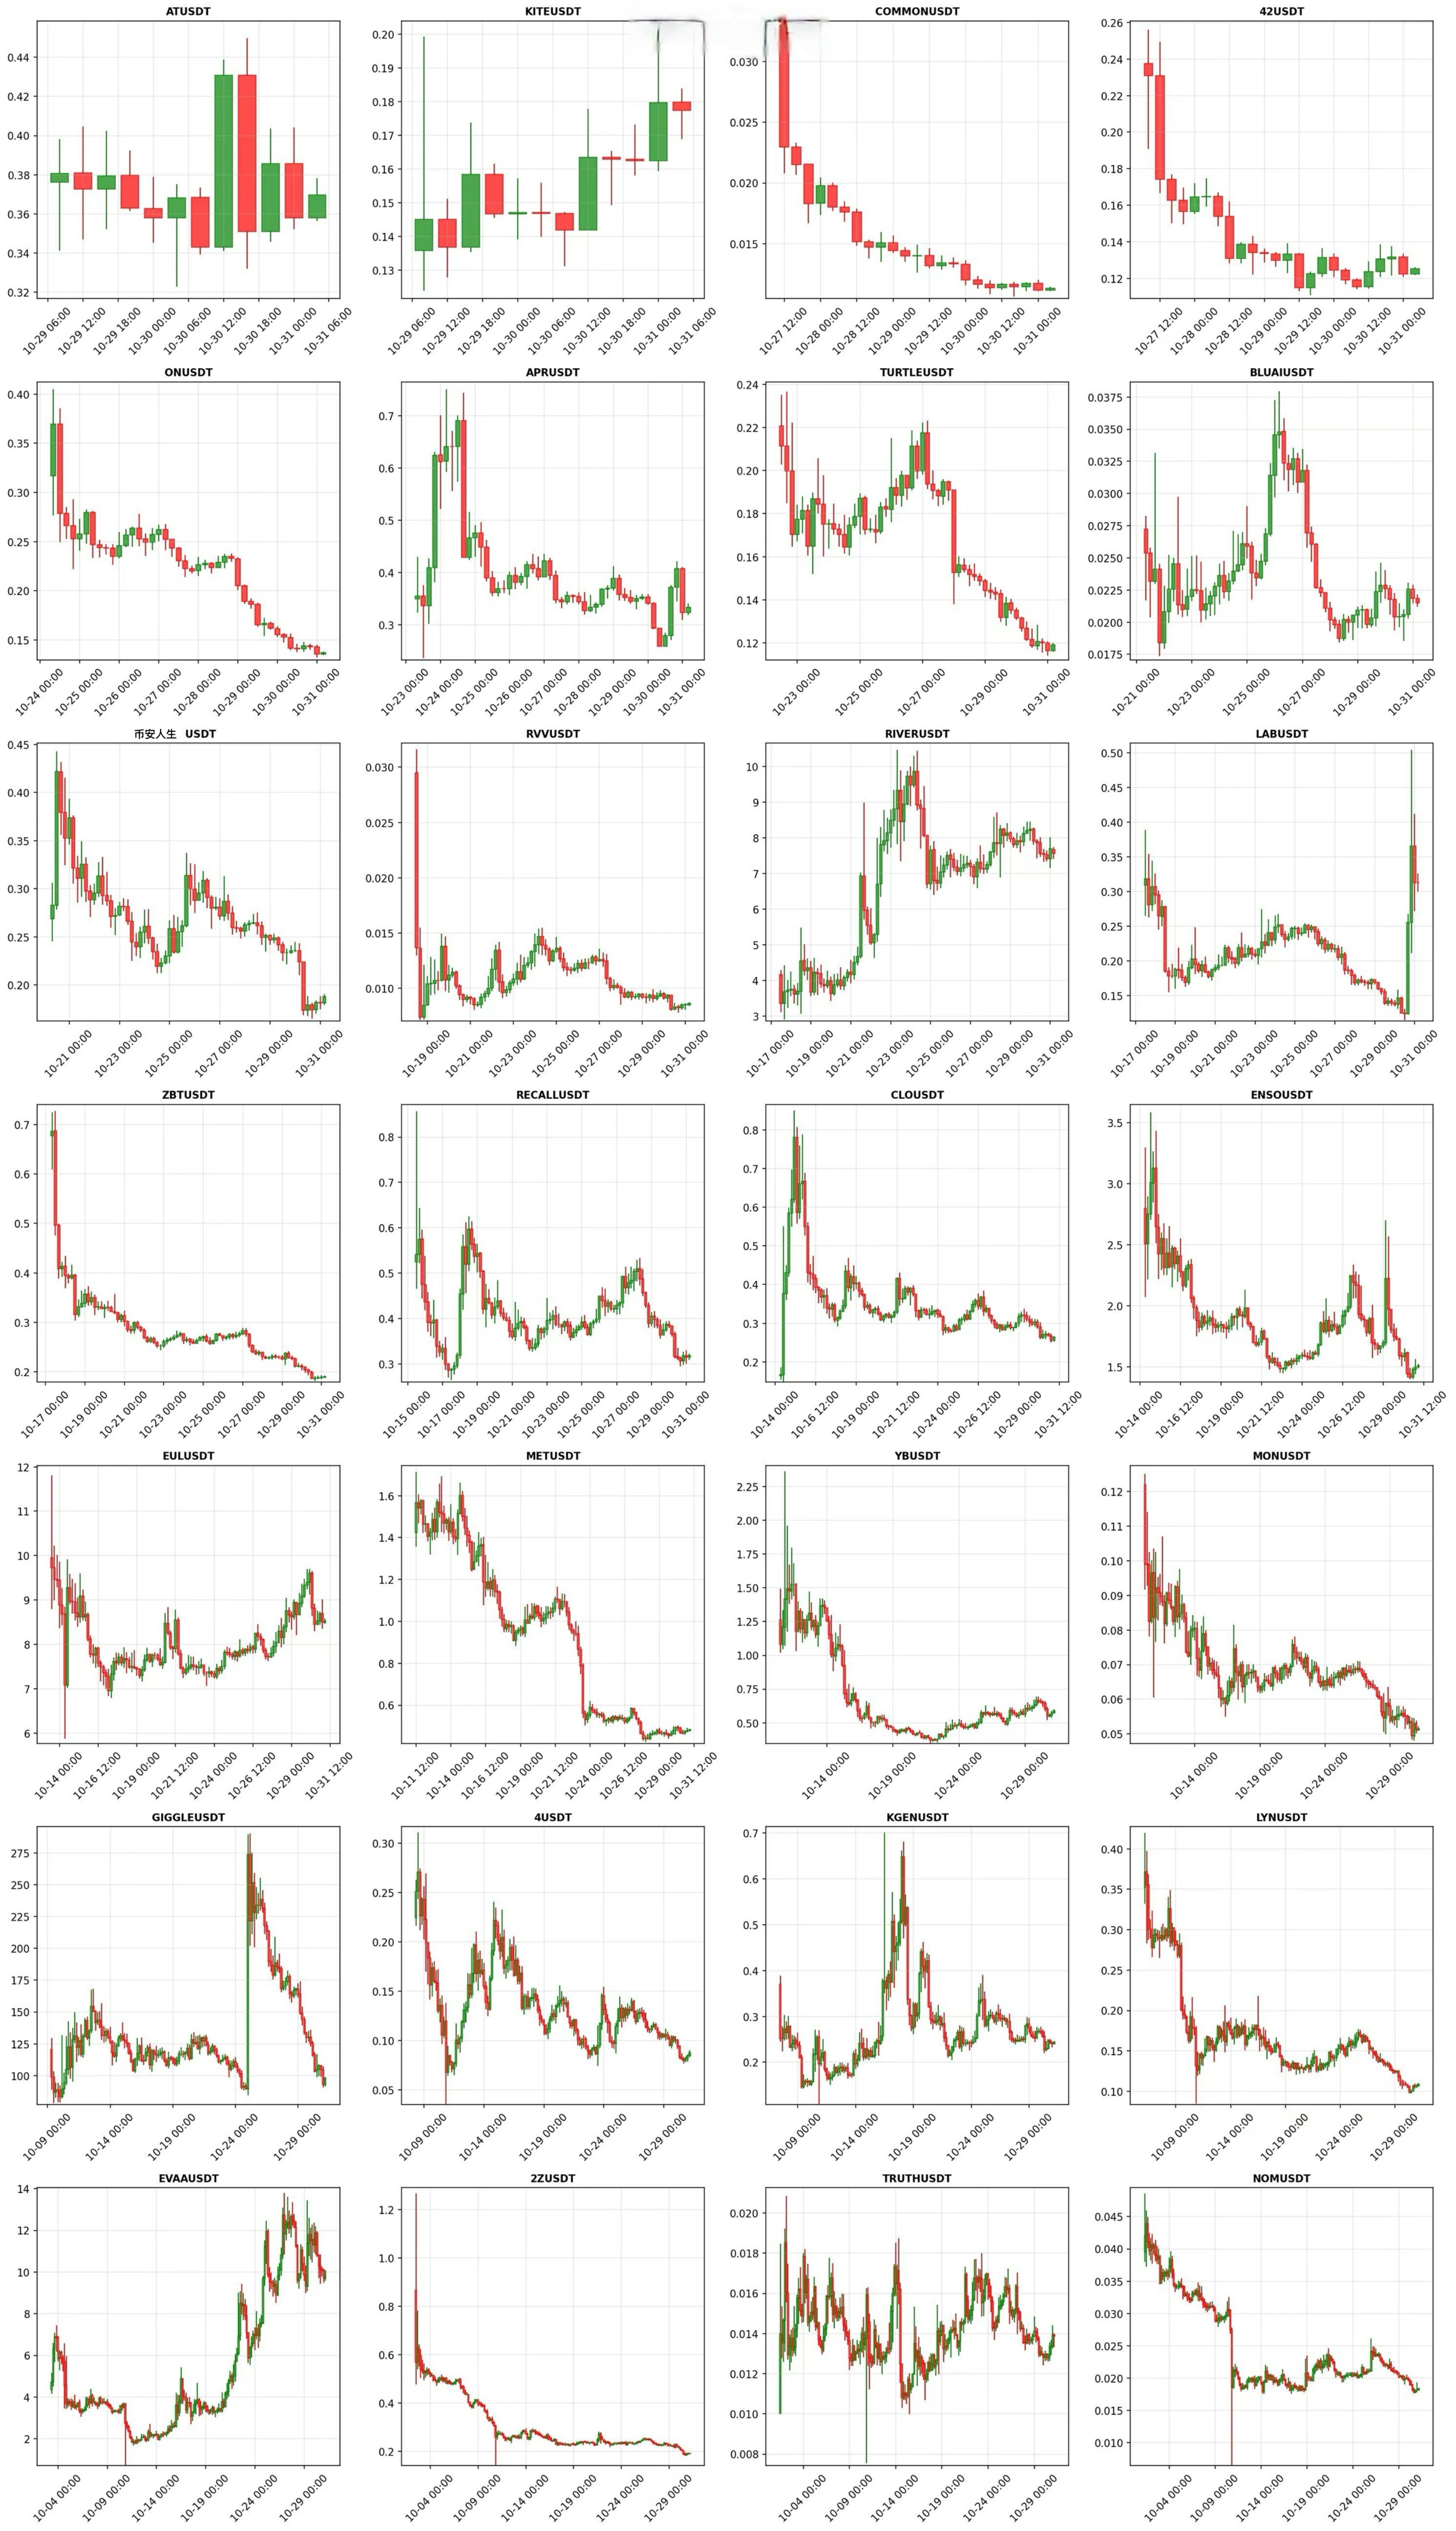
这种“集中上新”现象,本质上是一次对市场承接力与热点扩散效率的测试。对比前两个月的数据可以看出,10月市场进入了一个明显的“合约密集期”。然而,从价格表现来看,多数新合约在首周冲高后迅速回落,整体平均跌幅较大,仅有少数强势币逆势走高,体现出主力与交易员之间的共识分歧与博弈加剧。
在启动阶段,市场情绪曾短暂升温,部分新币在上线首周内交易量暴涨数倍,吸引短线资金集中入场。但随后量能退潮、板块内部走势相关性下降。 强势币延续资金流入,弱势币则快速冷却。资金行为从“情绪博弈”转向“结构筛选”,主导力量开始从散户情绪转向机构化资金的结构性布局。
本文将从合约上新节奏、资金结构变化与市场情绪演化 三个维度出发,探寻 10 月币安新币潮背后所反映的流动性收割路径与结构性机会。通过对交易量、持仓量、多空比等核心指标的分析,希望揭示这一轮“合约密集期”中,市场情绪如何由短线狂热逐步转向结构化博弈,以及主力资金在其中的布局逻辑。
宏观观察:合约密集期下的资金流向与市场结构
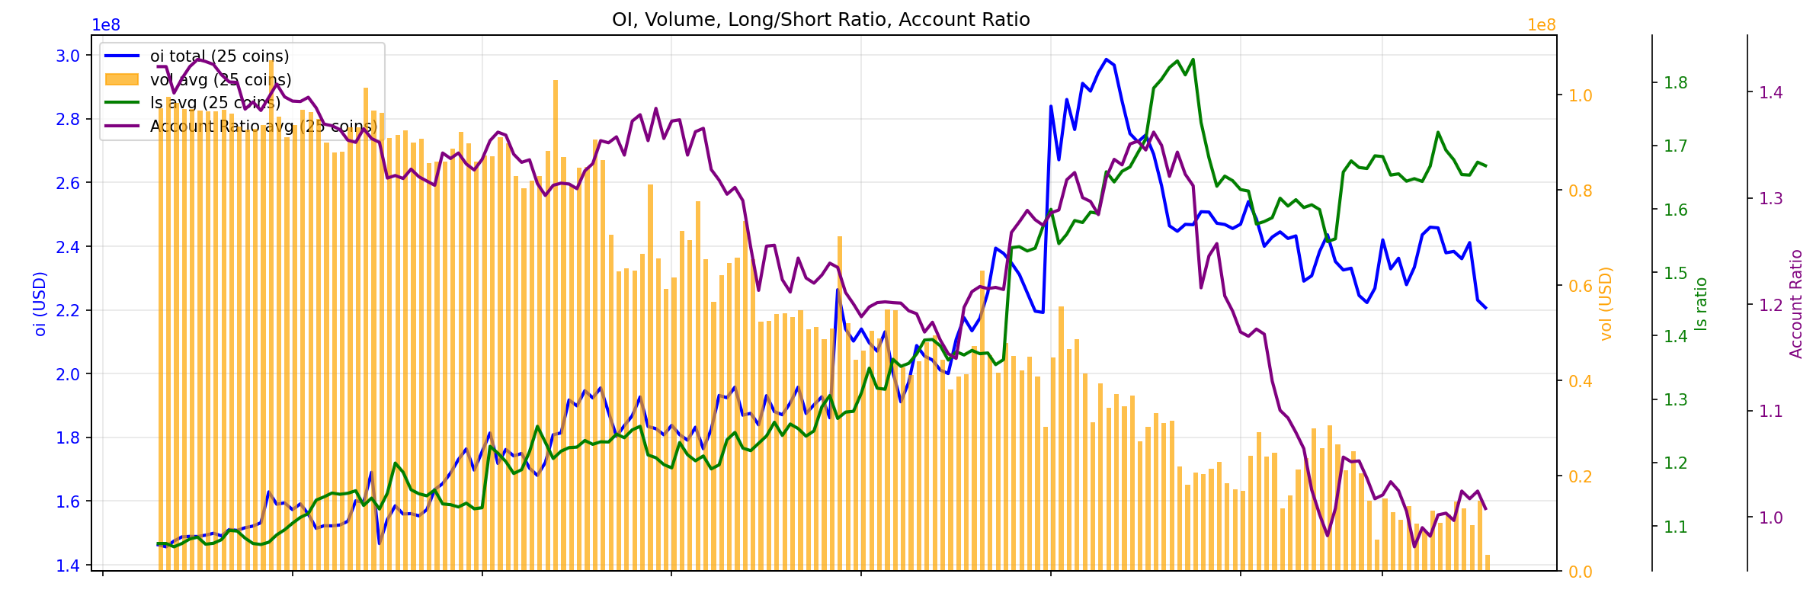
本图汇总了 10 月份币安新上永续合约板块的总交易量、持仓量(OI)与多空比 聚合数据,用以概括整个板块的资金流动与市场情绪变化轨迹。整体来看,10 月的市场结构经历了一个从“高量启动”到“持仓突破”的演化过程。
从数据上看,OI 总持仓在 2 亿至 2.5 亿美元区间横盘近半个月,期间成交量持续下滑,市场处于观望与结构调整阶段。直到10 月 21 日前后,持仓量强势上行,最高接近3.5 亿美元,形成一次明显的“资金增仓拐点”。值得注意的是,这一阶段的持仓增长伴随交易量的持续萎缩,意味着新增仓位更多来自中长期建仓资金,而非短线博弈。市场的主导力量开始从情绪驱动转向结构性布局。
阶段一:高量启动(10 月初)
交易量处于全月高位,OI 与价格仍在低位震荡。情绪活跃但资金不沉淀,资金以短线投机为主。
阶段二:低量蓄势(10 月 5–15 日)
成交量持续下降,OI 稳步上升,表明市场进入筹码沉淀期,主力资金开始试探性建仓。其中,10 月 11 日的“黑天鹅事件”曾短暂引发市场恐慌情绪,资金快速撤离高杠杆仓位,导致短线波动放大、持仓交易量有所降低。 但这场冲击在释放流动性风险的同时,也为结构性资金创造了更理想的建仓环境。庄家完成了前期的资金布局,为后续的持仓突破蓄力。
阶段三:持仓突破(10 月 20–25 日)
OI 曲线强势突破平台,价格与多空比同步上扬,资金集中度显著提升,形成板块共振行情。
阶段四:量缩价稳(10 月底)
成交量下降至月内低点,OI 依旧维持高位,市场进入高位震荡与结构博弈阶段。主力资金并未撤离,而是在等待新的流动性回暖转折点,以寻求下一轮情绪共振与波动机会。
总体来看,10 月份的新合约板块呈现出交易量持仓倒挂的结构特征。资金由短线博弈转向中期持仓,板块内部正在经历从情绪驱动到结构性资金沉淀的过渡期。
结构分化:从共振到筛选,强势币的崛起逻辑
伴随整体持仓的持续攀升与成交量的收敛,新币板块内部开始出现显著分化。强势币与弱势币之间的走势相关性逐步下降,市场从“板块共振”进入“结构筛选”阶段。数据显示,自 10 月中旬起,部分币种的价格与持仓量同步上升,形成典型的资金共振结构;而更多标的则在量能衰退中失去流动性支撑,价格进入无趋势震荡。
「以EVAA为例」
10 月 11 日后,该币出现了 OI 放量 的结构性信号,多空比仍持续维持在高位区间。这种“量价共振 + 持仓放大”的组合,或许意味着主力资金的集中介入与趋势预期待确认。在其他币种仍处于震荡或缩量状态时,EVAA 的走势率先脱离板块整体波动,表现出明显的独立行情特征。
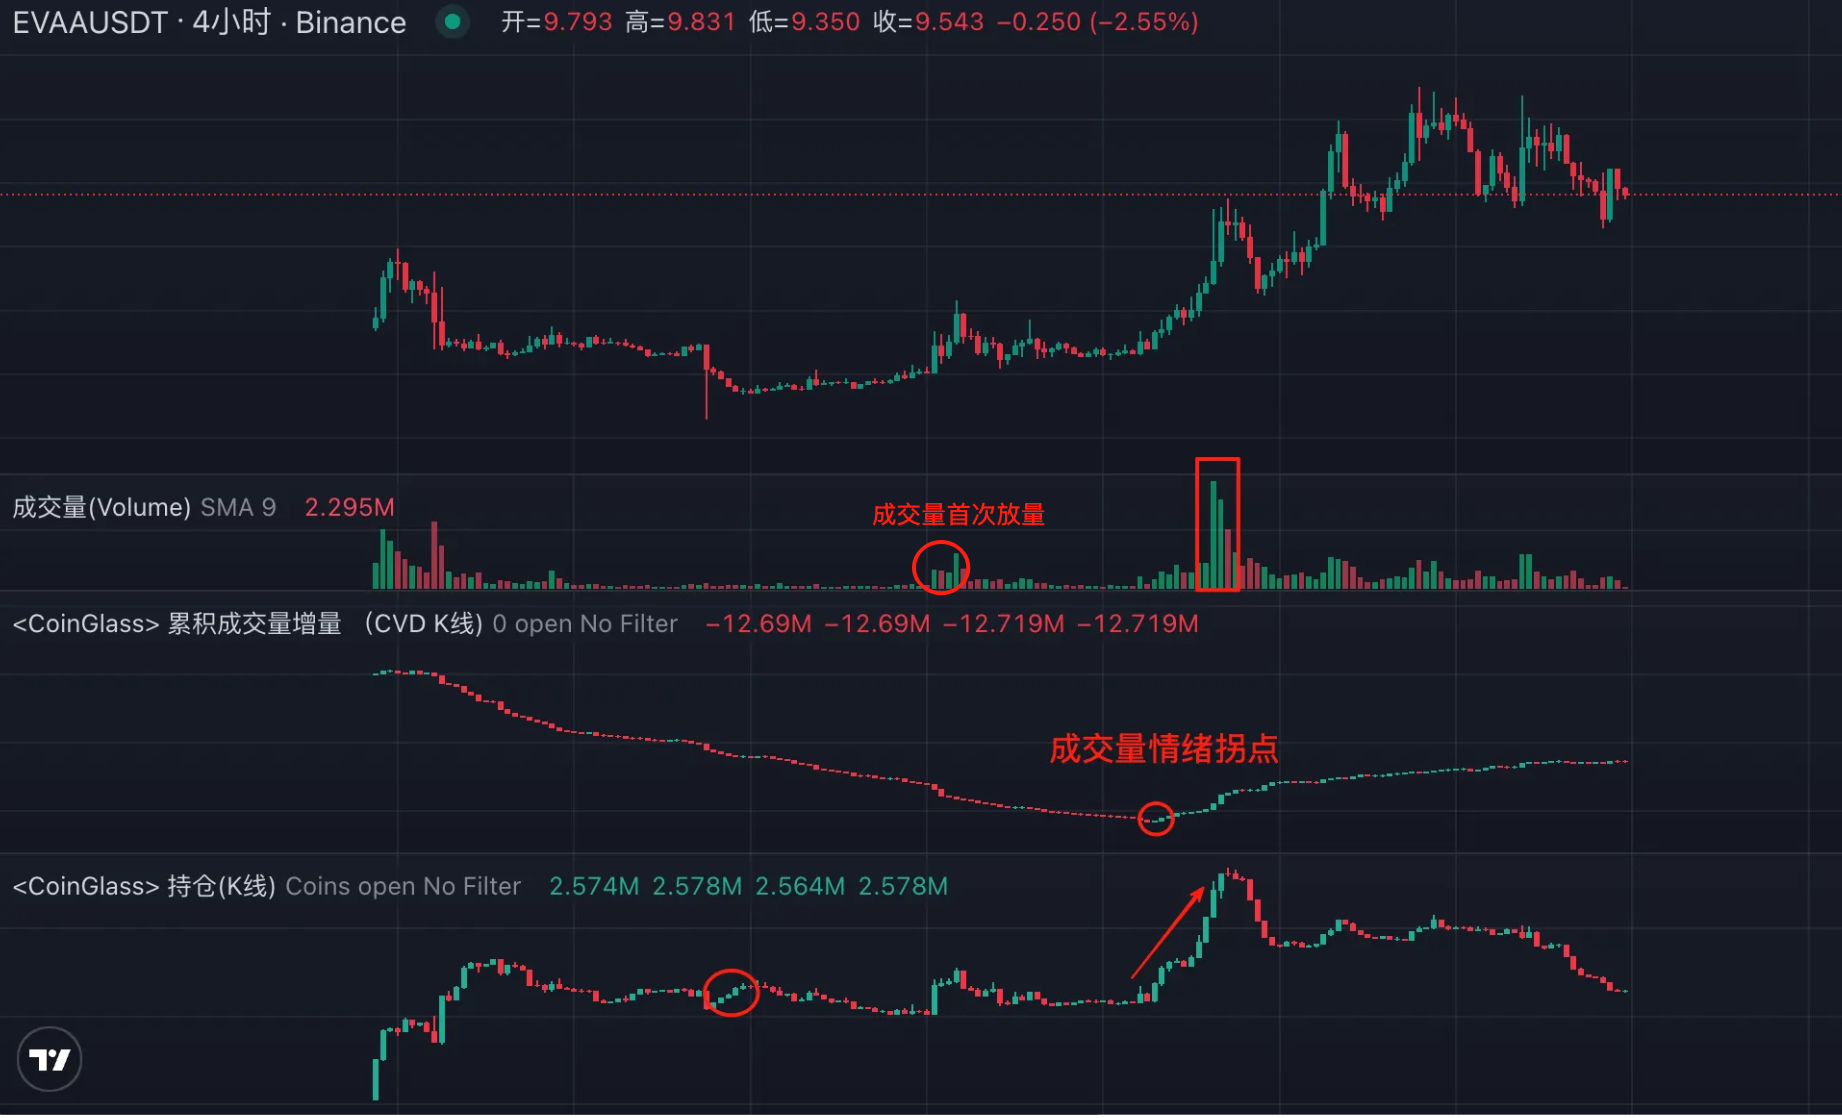 从上图中可以看出,10 月中旬成交量的首次集中放大,正对应了持仓曲线的上扬节点,说明市场流动性在短时间内被主力资金吸收,形成了结构性突破。此后价格进入稳步上行阶段,即使在注意力高度集中的新币合约板块整体成交量下降时,EVAA 的持仓仍维持高位未降,显示主力资金并未急于兑现,而是选择通过控盘节奏延长趋势周期。 与之对比,其他中小合约虽短暂获得跟随性买盘,但缺乏延续性,很快被动回落。
这种“强者恒强”的结构特征,意味着市场资金正主动向确定性更高的标的聚拢,板块整体的资金利用效率在下降,但核心资产的吸金能力反而在提升。
从资金行为的角度看,10 月下旬的行情分化是一种流动性再分配。短线资金已从高波动标的退出,而主力资金则集中在少数趋势币中形成锁仓,维持OI高位不降。这一阶段,交易量的缩减不再代表热度退潮,而是反映出市场进入控盘博弈与结构性轮动的中期状态。
资金结构分析:从流动性区间到收割效率
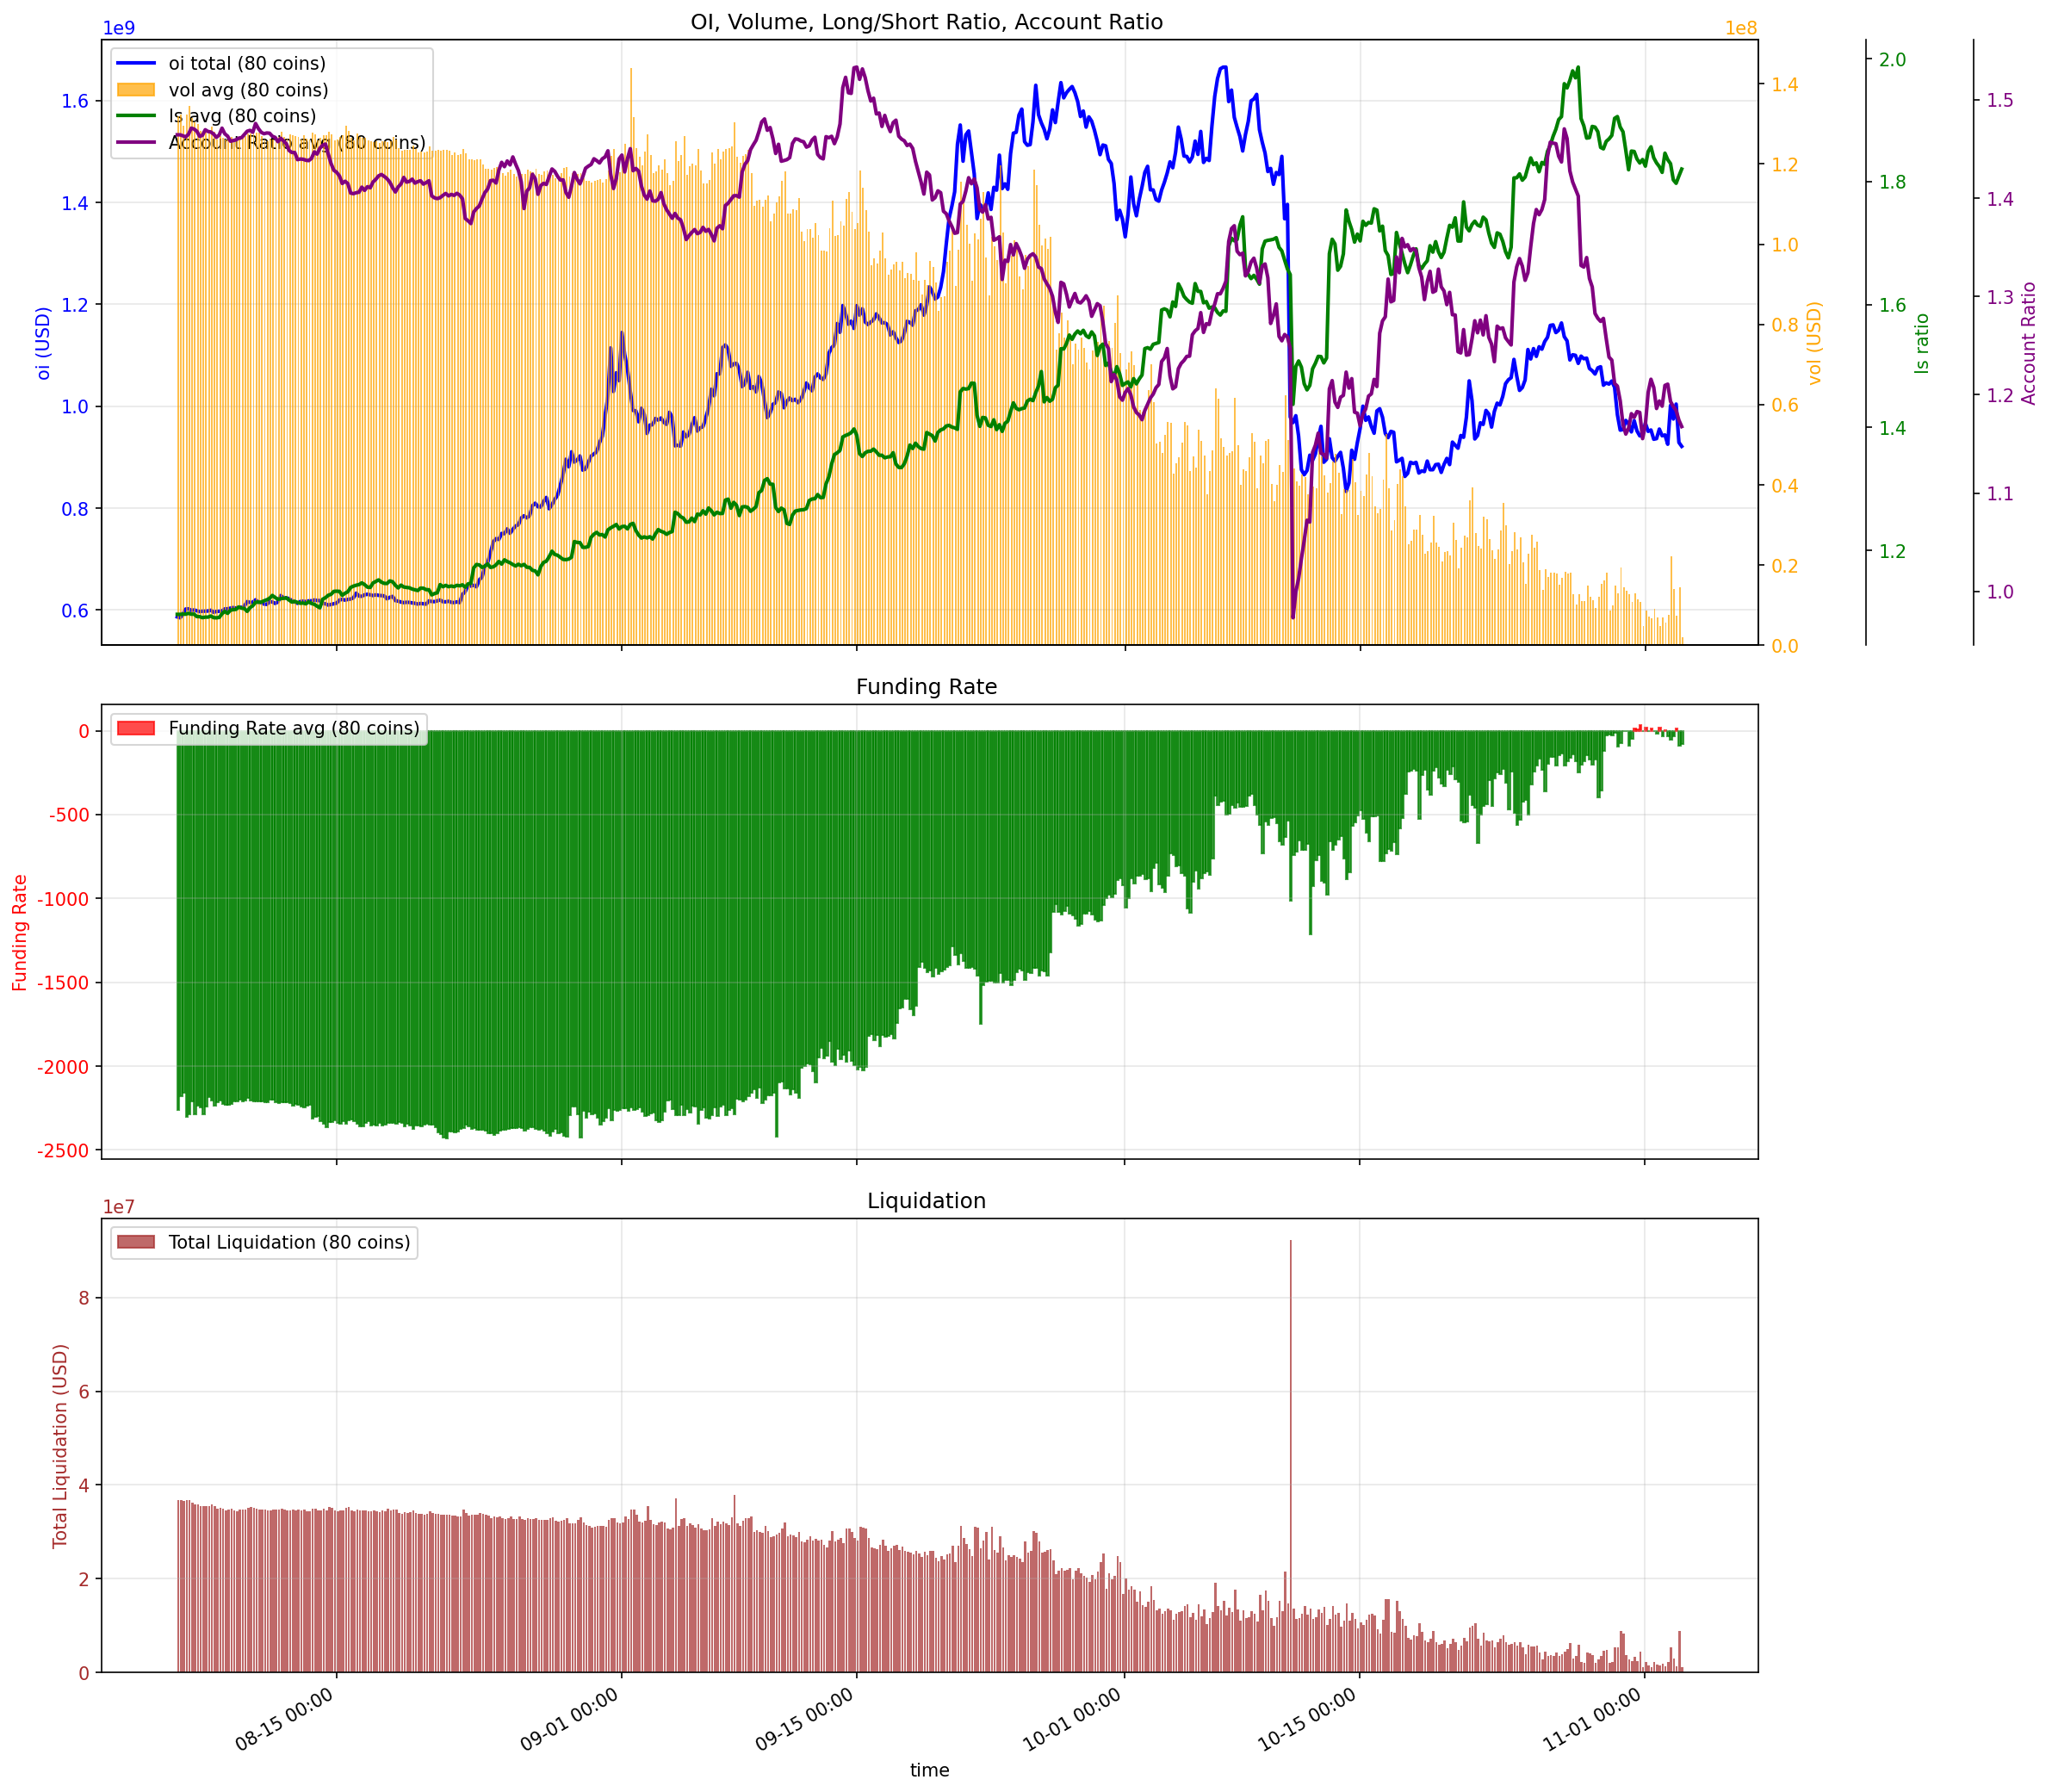
从上图8-10月三个月的整体数据来看,新币板块的资金结构在过去三个月中呈现出明显的“持仓扩张、成交收敛”的特征。
OI 总体从 6 亿美元上升至 16 亿美元,而成交量自高位回落,表明资金正在进入低频控盘状态。
与此同时,多空比稳步抬升、资金费率由负转正、爆仓规模下降,这些信号共同构成了一个典型的
去杠杆后的结构性吸筹阶段。
如果给流动性收割下定义
“流动性收割”并非单一的砸盘或出货行为,而是资金利用市场注意力完成一次流动性循环的过程
可以将其定义为:市场流动性从被吸引、被集中,到被触发、被清算的完整资金闭环。
这一循环通常包含四个阶段:
- 吸引流动性 —— 通过上新、叙事、空投预期等手段引导关注;
- 集中流动性 —— 主力用少量筹码放大波动,引导资金聚焦;
- 利用流动性 —— 在情绪峰值阶段成交放大、价格被推高;
- 清算流动性 —— 资金费率翻转、爆仓或震荡出货完成兑现。
这一过程是全市场性的行为,而非单一币种的走势。
尤其在新币永续合约市场中,资金费率、OI 与成交量三者的共振周期,往往正对应一次“流动性再分配”的过程。若将爆仓后的重新积累阶段(OI 与成交量修复期)也计算在内,平均约22–28 天可形成一个完整的资金循环周期。
从新币板块层面看,流动性极度集中在少数强势币之中——约 5% 的标的贡献了 70% 以上的成交与波动。
这说明主力并不追求覆盖广度,而是在局部高波动区内反复制造情绪峰值,以最小成本实现最大流动性利用率。
这种结构的核心逻辑是——做市资金效率最大化:
- 当新币总持仓接近 2–5 亿区间上沿时,市场流动性饱和,临近收割点;
- 当成交下降而持仓不降时,主力等待新的叙事触发;
- 当资金费率由负转正、波动率放大时,通常预示新一轮“流动性利用”阶段开始。
因此,新币市场的资金运作逻辑并非“持续投入”,
而是围绕“制造流动性 → 吸收流动性 → 收割流动性”的周期性循环展开。
通过拆解 OI、成交量与资金费率的相对节奏,我们可以反向推算主力资金的效率区间——当前约为 22–28 天。
在这一时间窗口内,主力往往完成一次从制造注意力到兑现流动性的完整闭环。
结语
回望这三个月的新币周期,从情绪共振到结构分化,从广撒网到精筛选,市场完成了一次典型的“流动性循环”:
资金被吸引、集中、释放,再次归于平静。在这个过程中,注意力取代市值,成为市场的真正定价权;而主力资金的目标,也早已从推动行情,转向管理流动性。
新币以最短的周期暴露出市场的真实机制,通过波动创造最大的财富效应。可以预见的是,当前的平静并非结束,而是新周期的起点。一旦新的叙事被点燃,这些沉淀的资金将成为下一轮波动的燃料。
真正值得关注的,不是哪一个币对会暴涨,而是资金如何流动、情绪如何被重构,去观察散户与主力在流动性博弈中的位置,才是理解市场的关键。
叙事与周期可以周而复始,但资金行为的规律始终有迹可循。
数据来源:币安(Binance)永续合约市场公开数据。
免责声明:本文章仅代表作者个人观点,不代表本平台的立场和观点。本文章仅供信息分享,不构成对任何人的任何投资建议。用户与作者之间的任何争议,与本平台无关。如网页中刊载的文章或图片涉及侵权,请提供相关的权利证明和身份证明发送邮件到support@aicoin.com,本平台相关工作人员将会进行核查。


