撰文:Chris Beamish、CryptoVizArt、Glassnode
编译:AididiaoJP,Foresight News
比特币价格在 11 万至 11.6 万美元之间震荡,获利了结和 ETF 资金流入减弱拖累了上涨势头。衍生品影响力过大,期货和期权起到了平衡市场的作用。收复 11.4 万美元是上涨的关键,而跌破 10.8 万美元则可能面临更深的压力。
摘要
比特币在从 8 月份的历史高点回落后,目前仍处于 11 万至 11.6 万美元的「缺口」区间。从 10.7 万美元的反弹得到了逢低买入者的支持,但短期持有者的抛售压力迄今限制了上涨势头。
3 至 6 个月持有者的获利了结以及近期高位买入者的亏损兑现造成了阻力。要维持反弹,价格需要稳定在 11.4 万美元以上,以重建信心并吸引资金流入。
链上流动性仍然具有建设性,但呈下降趋势。与此同时 ETF 资金流入已放缓至约每天±500 BTC,削弱了此前在 2024 年 3 月和 12 月推动上涨的传统金融需求。
随着现货需求疲软,衍生品已成为主要驱动力。期货基差和交易量保持平衡,期权未平仓合约量正在上升,表明市场结构更具风险特性。
市场正处于十字路口,收复 11.4 万美元可能引发新的上涨势头,而跌破 10.8 万美元则可能暴露下一个集群的下限约 9.3 万美元。
区间震荡
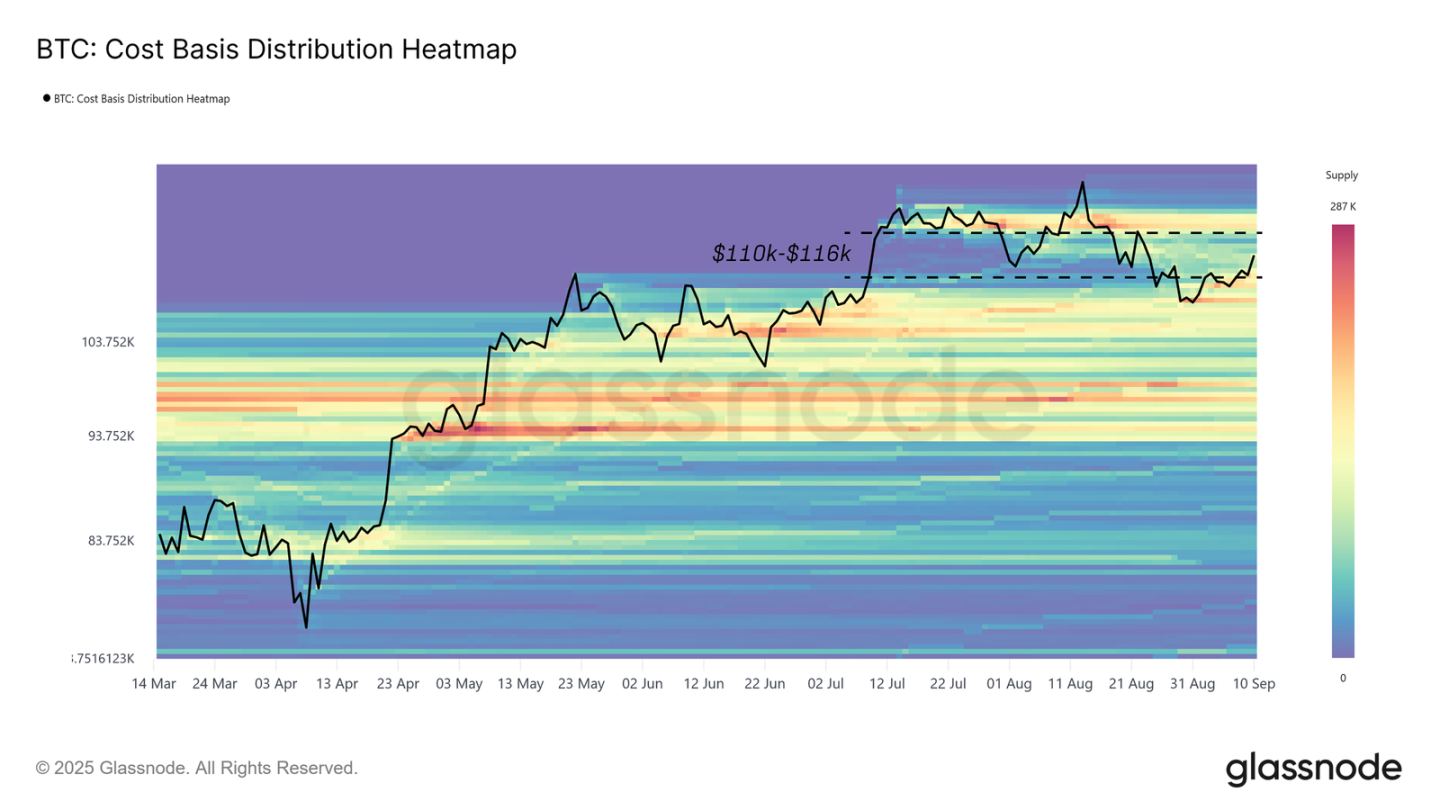
在 8 月中旬创下历史新高后,市场动能持续减弱,将比特币拉低至近期高位买入者的成本基础以下,并回到 11 万至 11.6 万美元的「缺口」区间。此后价格一直在此区间内波动,随着供应重新分配,逐渐填补该缺口。现在的关键问题是,这究竟是健康的盘整,还是深度回调的第一阶段。
如成本基础分布所示,从 10.8 万美元的反弹得到了链上明显买入压力的支撑,这是一种「逢低买入」的结构,有助于稳定市场。
本报告审视了链上和链下指标的卖方动态和动能,重点分析了最有可能推动比特币下一次决定性突破该区间的力量。
绘制供应集群
首先,我们绘制出当前价格附近集群的成本基础,因为这些水平通常会锚定短期价格走势。
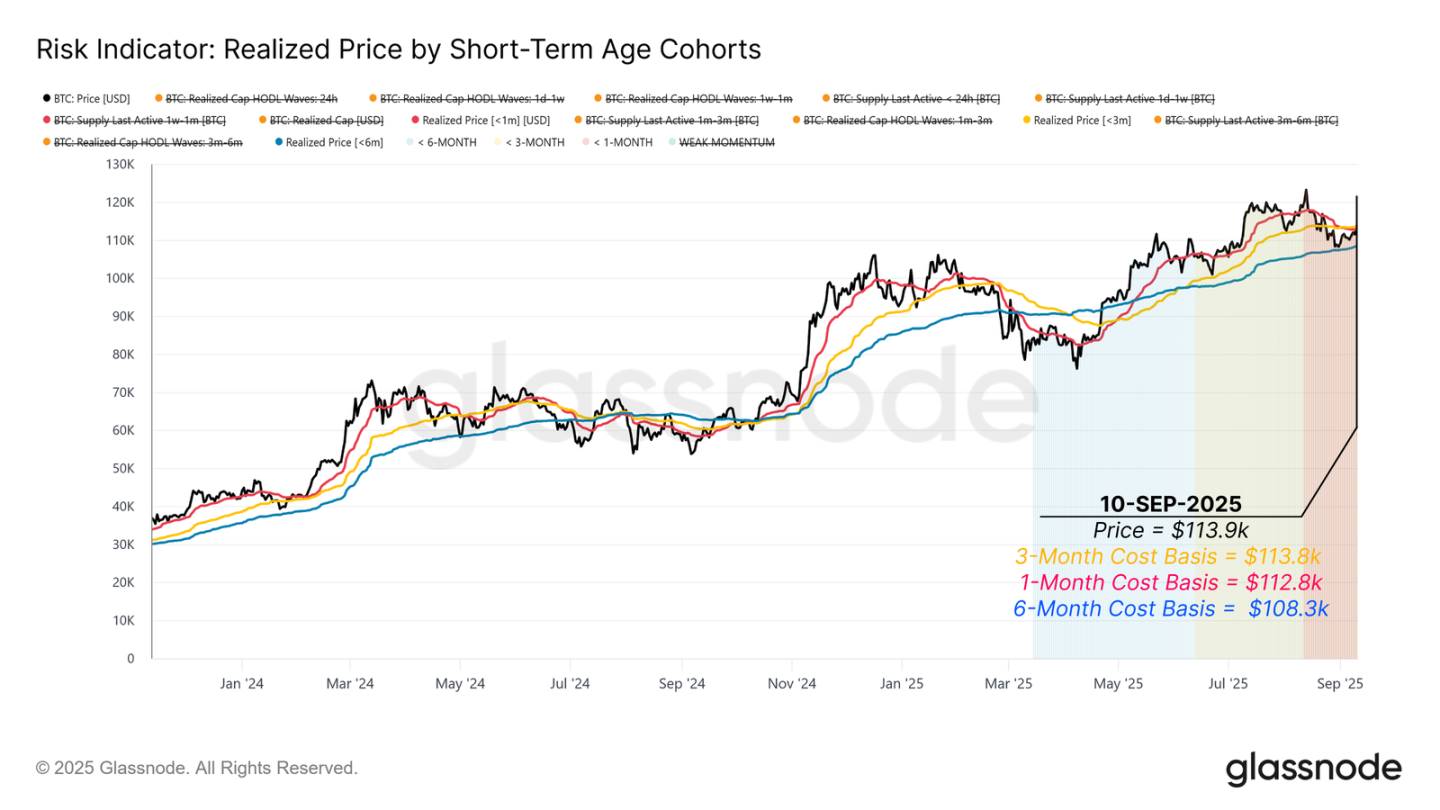
根据热力图,目前有三个不同的投资者群体在影响价格走势:
-
过去三个月的高位买入者,其成本基础接近 11.38 万美元。
-
过去一个月的逢低买入者,聚集在 11.28 万美元附近。
-
过去六个月的短期持有者,成本基础锚定在 10.83 万美元附近。
这些价格水平定义了当前的交易区间。收复 11.38 万美元将使高位买入者恢复盈利,并推动看涨趋势延续。然而跌破 10.83 万美元则可能使短期持有者再次陷入亏损,可能引发新的抛售压力,并为跌向下一个主要供应集群的下限(9.3 万美元)打开通道。
经验丰富的短期持有者获利了结
在确定了当前价格附近塑造区间的直接供应集群后,我们接下来考察了不同持有者群体在从 10.8 万美元反弹至 11.4 万美元期间的行为。
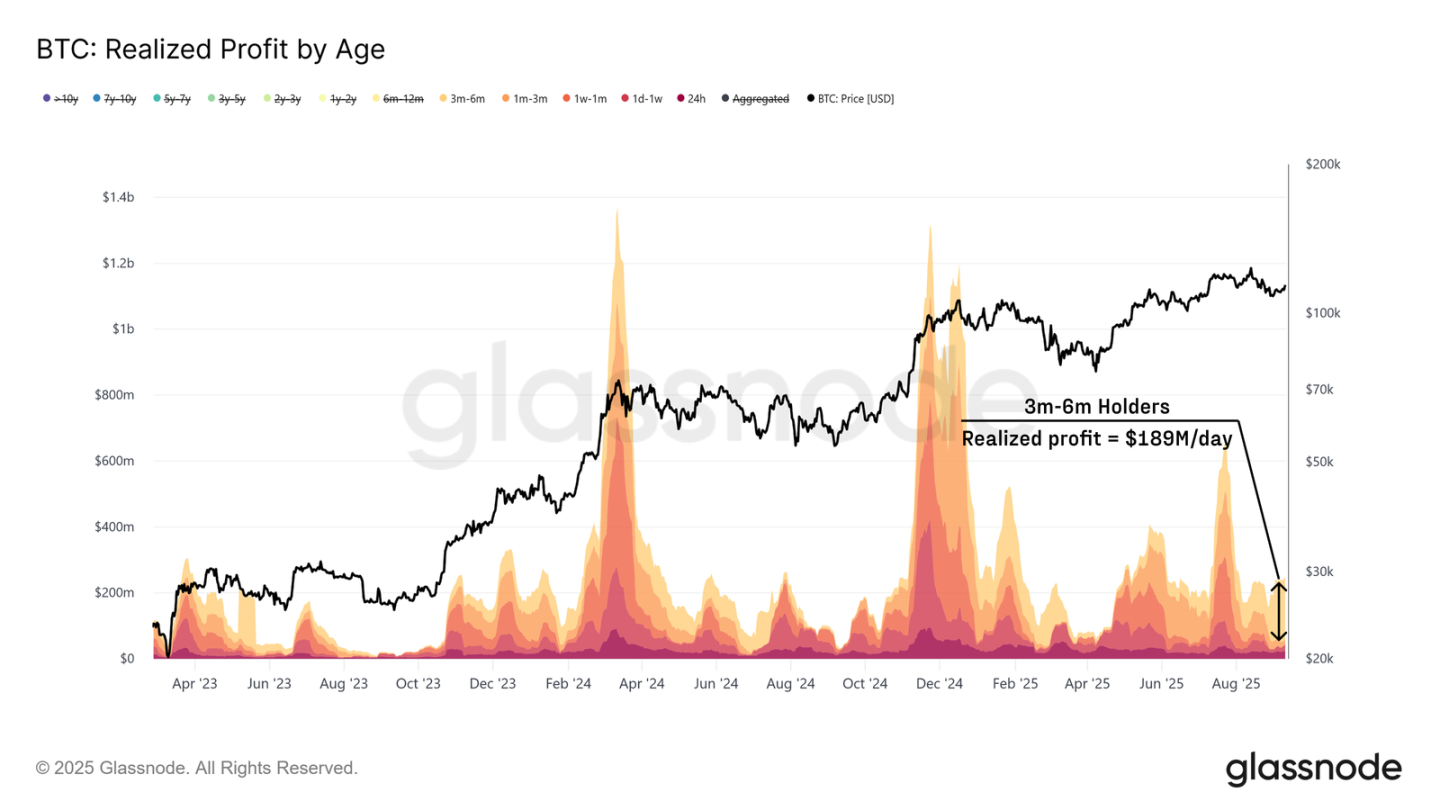
虽然逢低买入者提供了支撑,但抛售压力主要来自经验丰富的短期持有者。3-6 个月持有者群体每天实现约 1.89 亿美元的利润,约占所有短期持有者利润的 79%。这表明在 2 月至 5 月下跌期间较早买入的投资者利用最近的反弹获利了结,造成了明显的阻力。
高位买入者实现亏损
除了经验丰富的短期投资者获利了结外,近期的高位买入者也在同一反弹期间通过实现亏损给市场带来了压力。
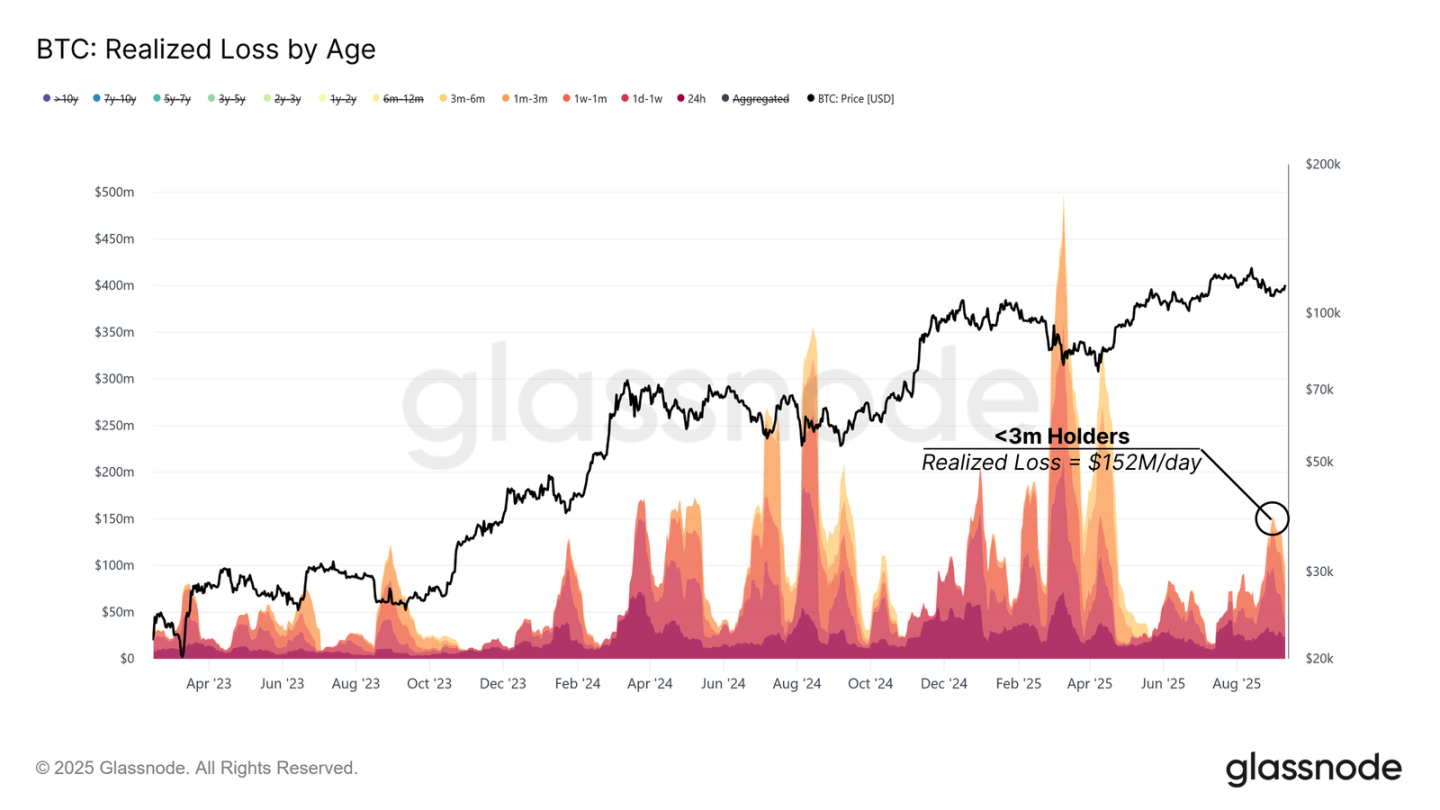
截至 3 个月的持有者群体每天实现高达 1.52 亿美元的亏损。这种行为模仿了 2024 年 4 月和 2025 年 1 月早些时候的压力时期,当时高位买入者以类似的方式投降。
要使中期反弹恢复,需求必须足够强劲以吸收这些亏损。如果价格稳定在 11.4 万美元以上,恢复信心并鼓励新的资金流入,则将得到确认。
流动性吸收卖方压力
在获利了结和亏损兑现都给市场带来压力的情况下,下一步是评估新的流动性是否足够强劲以吸收这些卖家。
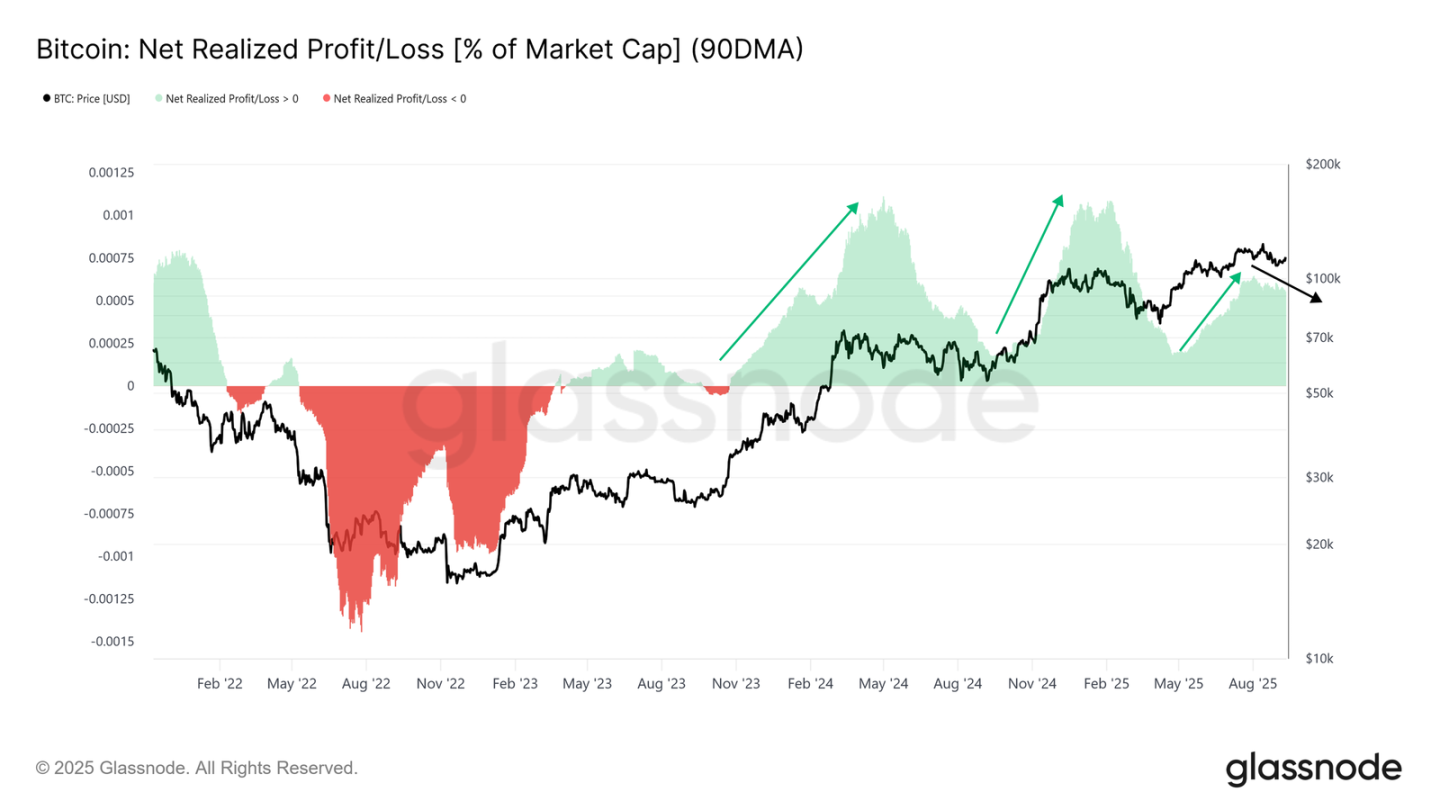
以市值百分比表示的净实现利润提供了这种衡量标准。90 日简单移动平均线在 8 月的反弹期间达到 0.065% 的峰值,此后呈下降趋势。虽然比峰值时弱,但当前水平仍然较高,表明资金流入仍提供支撑。
只要价格保持在 10.8 万美元以上,流动性背景就仍然具有建设性。然而,更深的下跌可能会耗尽这些流入资金并阻碍进一步的反弹。
传统金融资金流失去动力
除了链上资金流,通过 ETF 评估外部需求也至关重要,ETF 一直是本轮周期的主要驱动力。
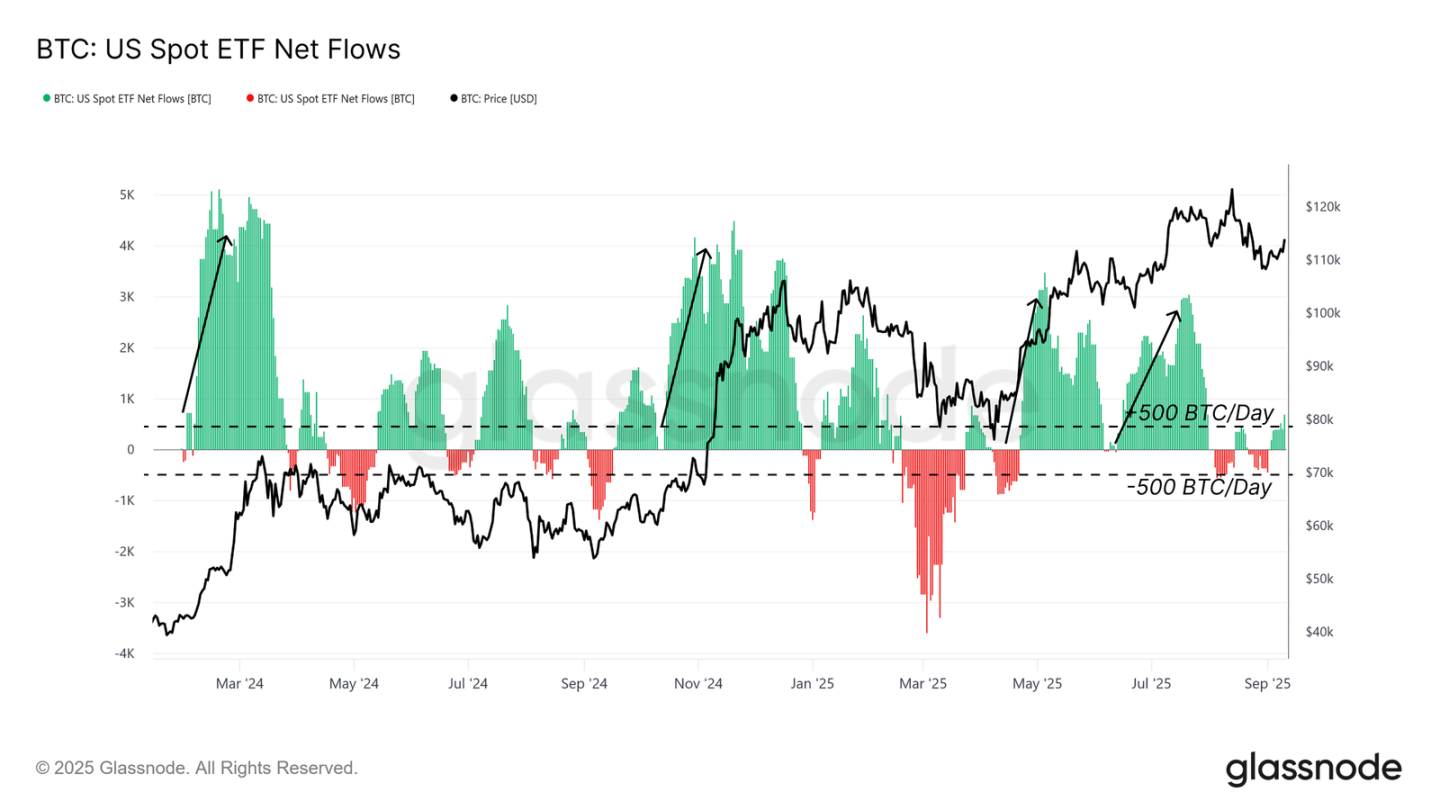
自 8 月初以来,美国现货 ETF 净流入大幅下降,目前徘徊在每天约±500 BTC 附近。这远低于支撑本轮周期早期反弹的流入强度,凸显了传统金融投资者动能的丧失。鉴于 ETF 在推动上涨方面所起的关键作用,其放缓增加了当前结构的脆弱性。
衍生品成为焦点
随着链上流动性疲软和 ETF 需求减弱,注意力现在转向衍生品市场,当现货流减弱时,衍生品市场往往定下基调。
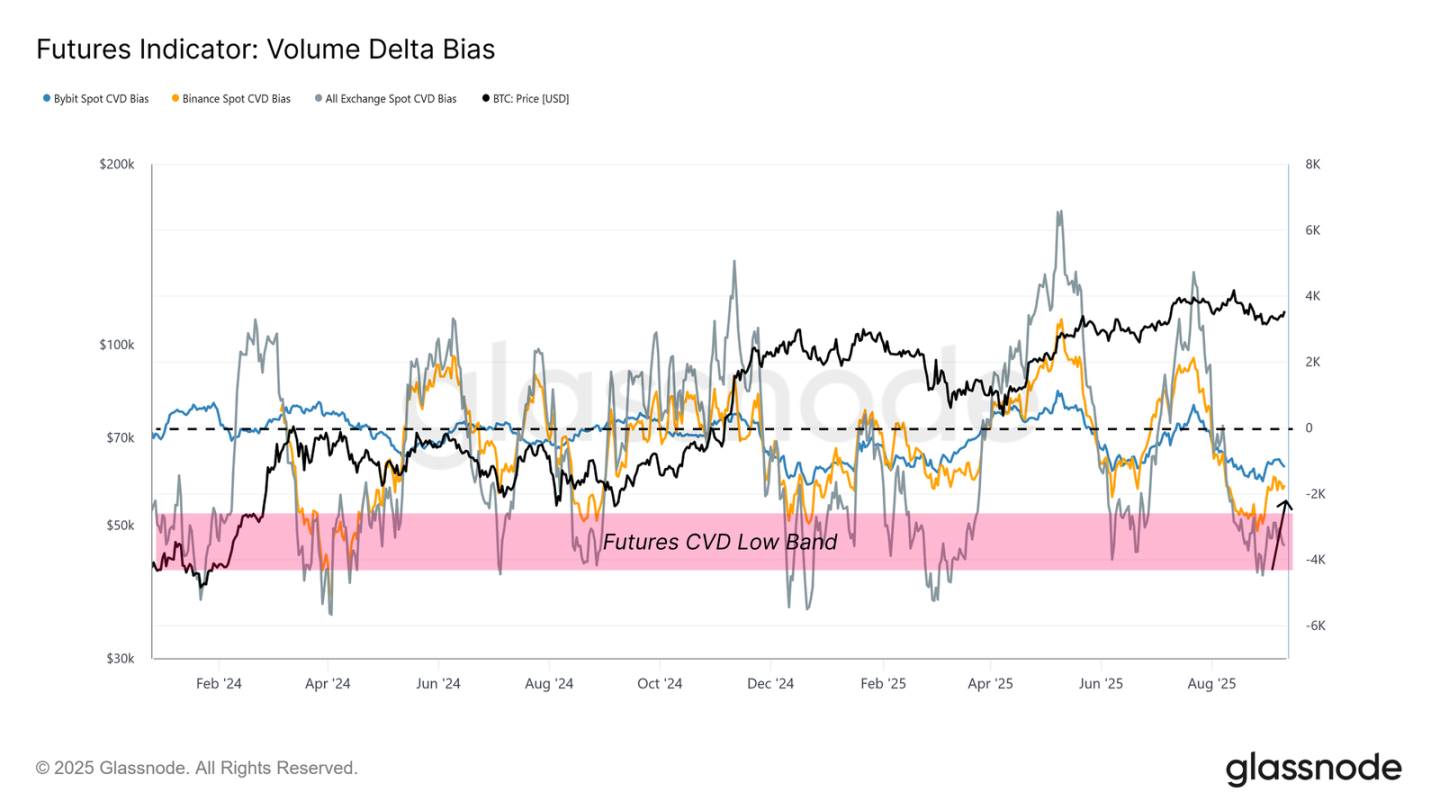
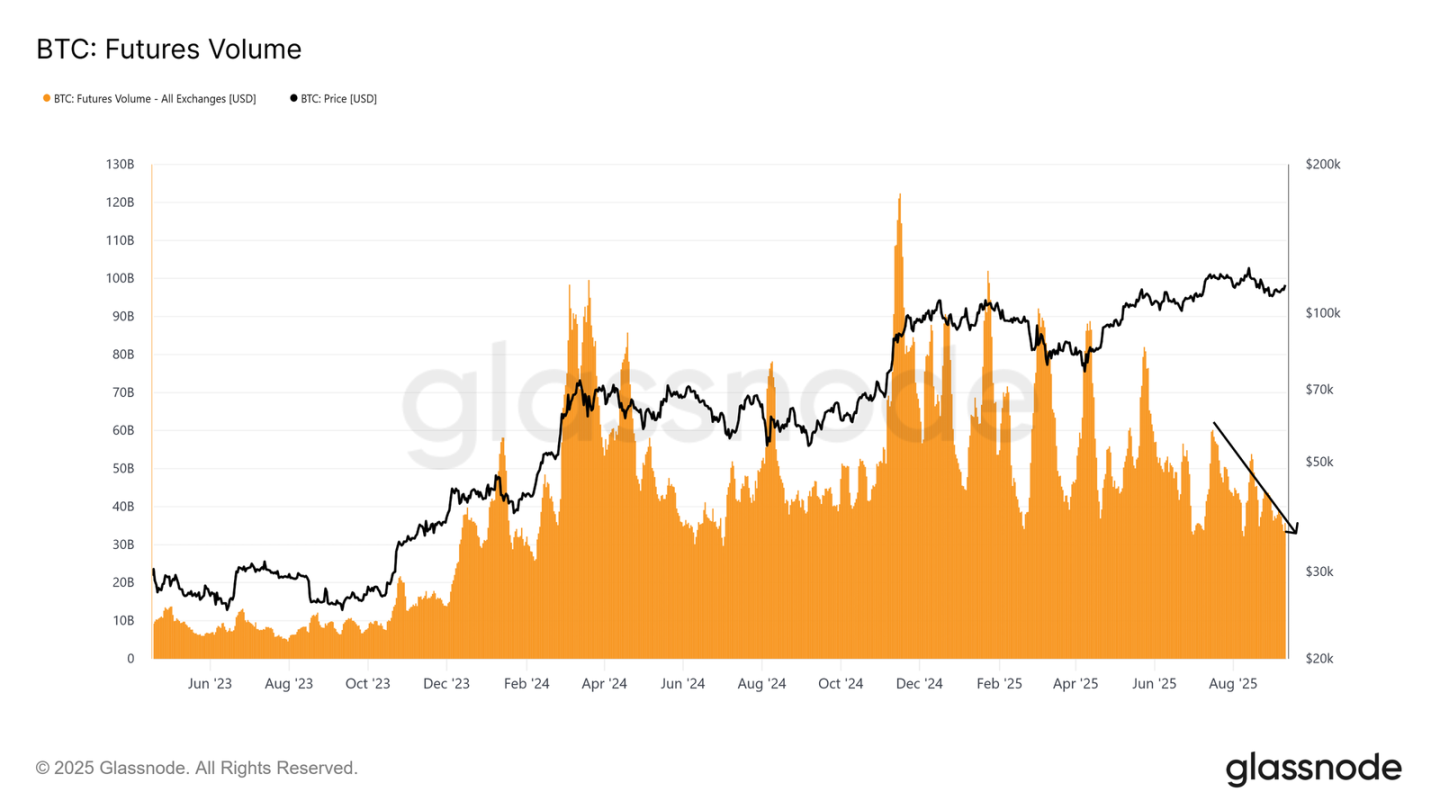
衡量累积成交量与其 90 日中位数偏差的成交量 Delta 偏度,在从 10.8 万美元的反弹期间有所恢复,表明在币安和 Bybit 等交易场所卖家力量枯竭。这表明期货交易者帮助吸收了近期的抛售压力。
展望未来,衍生品头寸的演变对于在这种低现货流动性的环境中驾驭市场至关重要。
平衡的期货市场
更深入地研究期货市场,我们发现市场显得平衡而非过热。
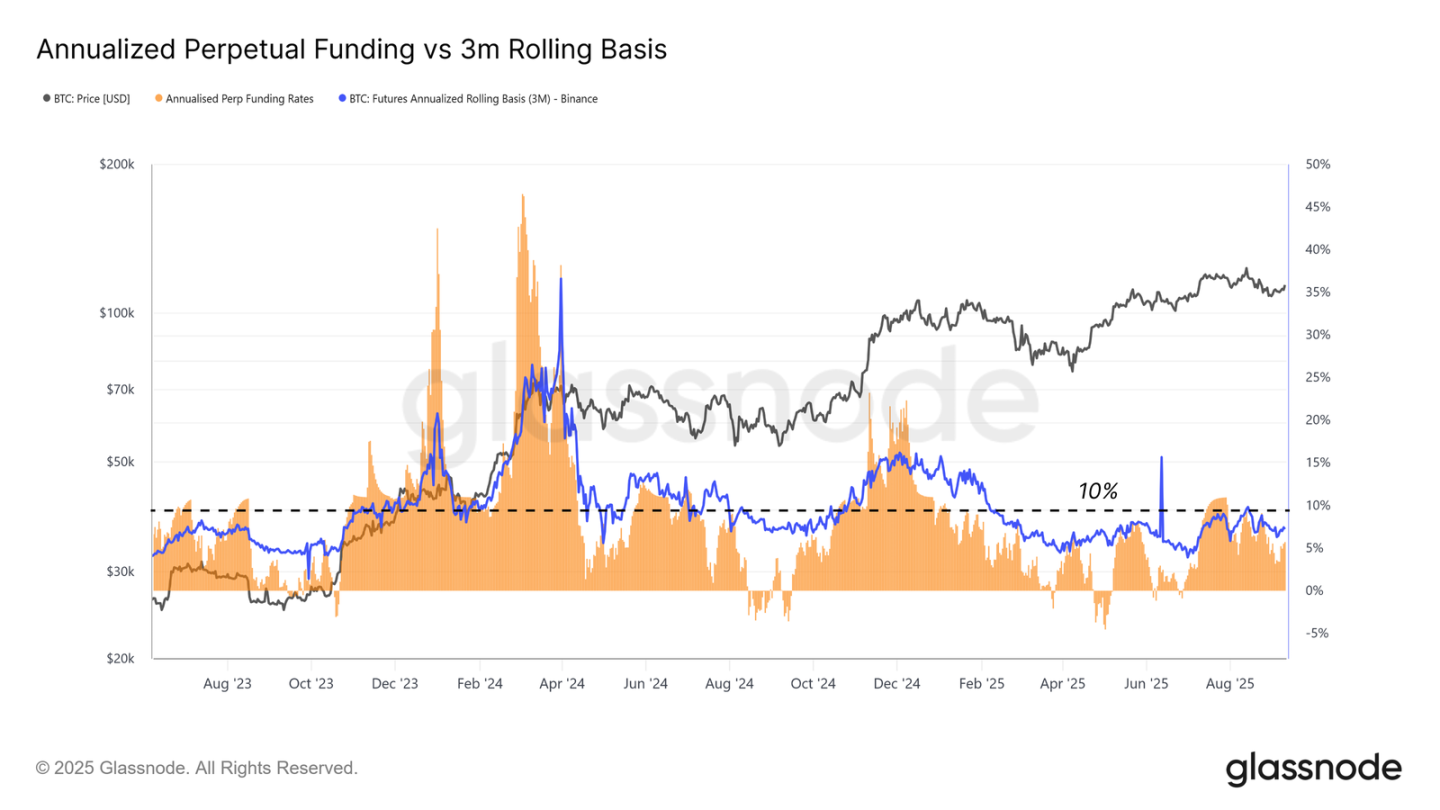
尽管价格较高,3 个月年化期货基差仍低于 10%,反映了对杠杆的稳定需求,而没有出现通常在清算前出现的极端情况。这表明市场结构更健康,更符合积累而非投机。
永续期货交易量也仍然低迷,与典型的狂热后平静期一致。缺乏激进的杠杆飙升表明上涨建立在更稳定的基础之上,而非投机过度。
期权在风险管理中的作用日益增长
最后,期权市场为了解参与者如何管理风险和构建头寸提供了进一步的见解。
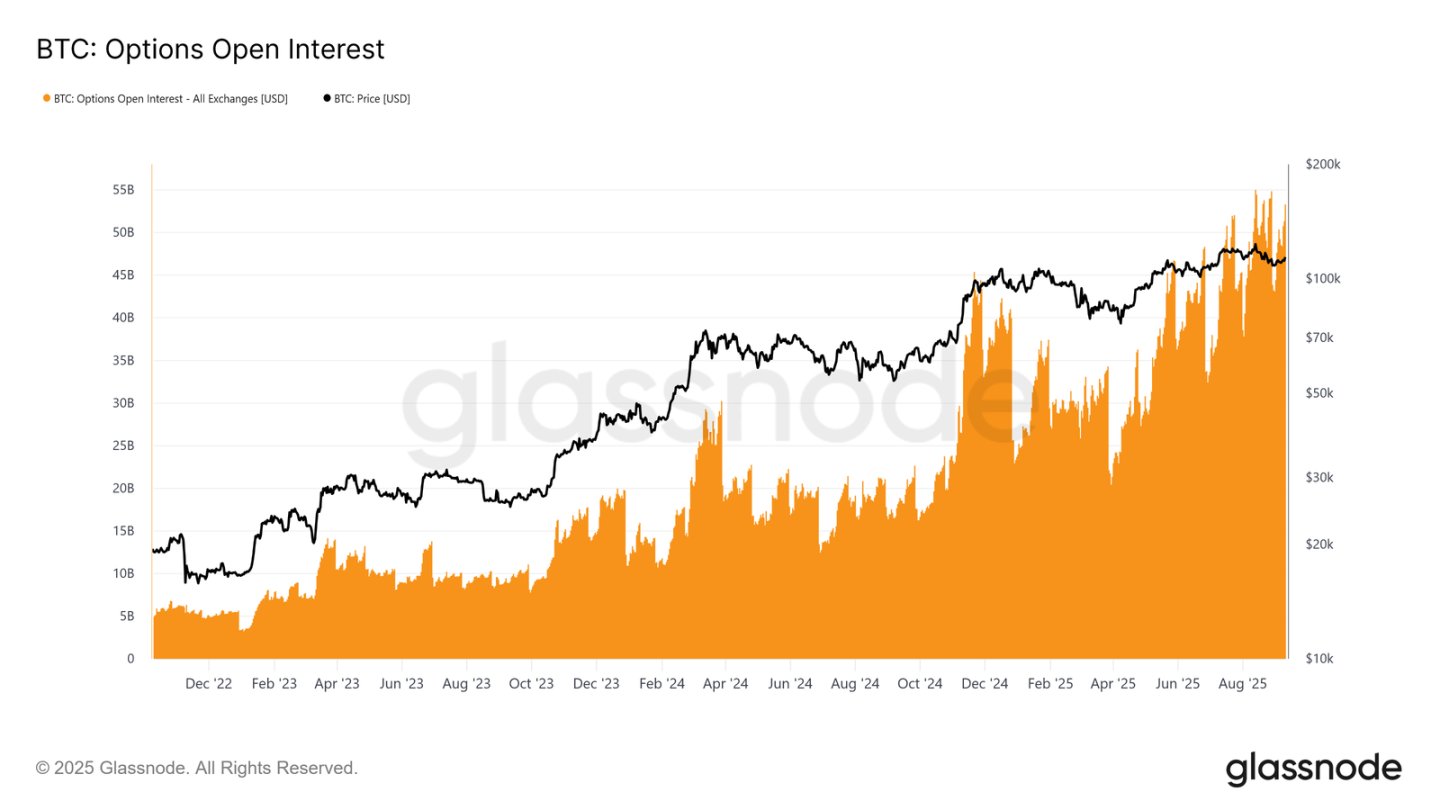
比特币期权未平仓合约量已达到历史新高,反映了其日益增长的重要性。随着 ETF 提供现货通道,许多机构更喜欢使用期权来管理风险,通过保护性看跌期权、备兑看涨期权或限风险策略。
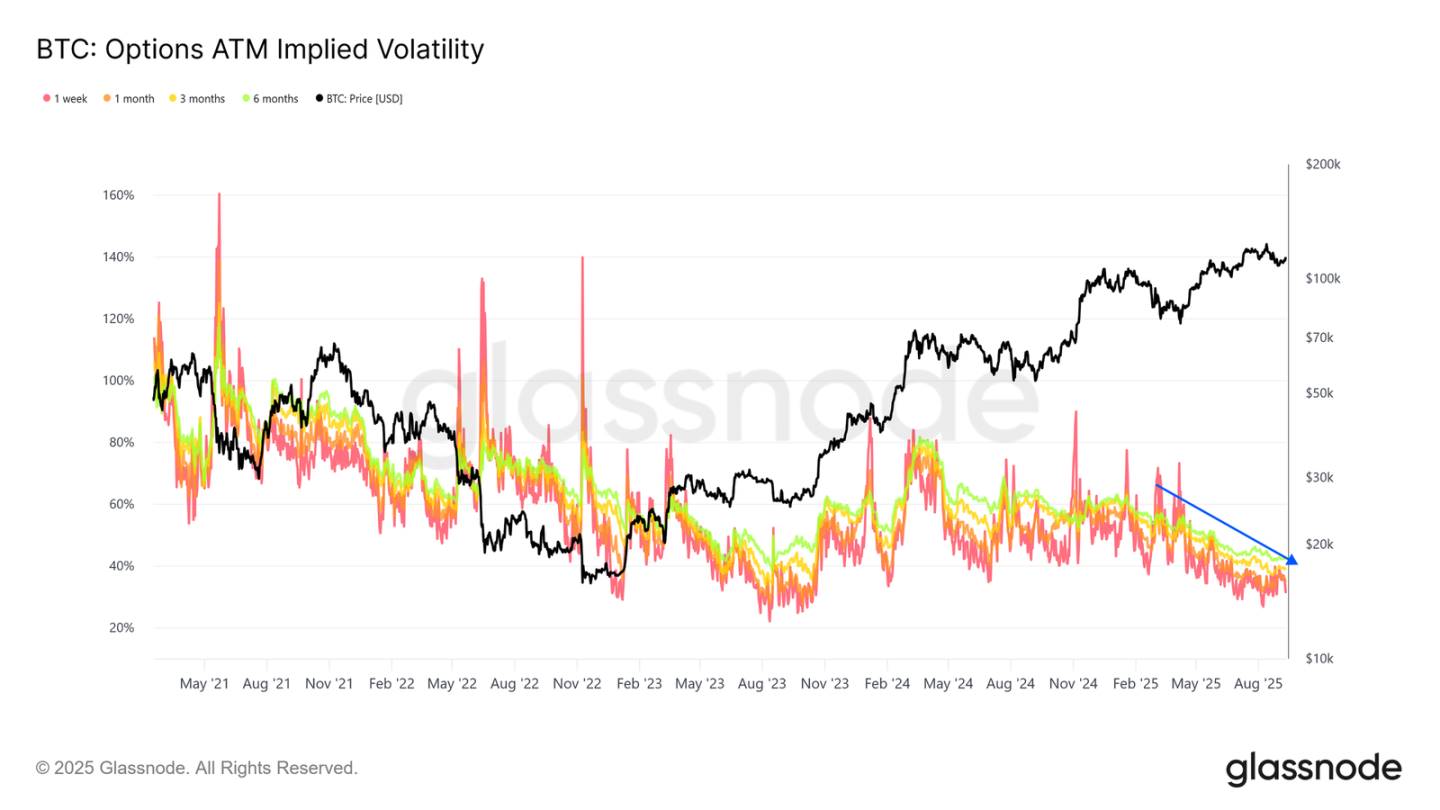
隐含波动率持续下降,这是市场更成熟、流动性更强的标志。波动率卖出(一种常见的传统金融策略)给隐含波动率水平带来了稳定的下行压力,导致与过去周期相比价格走势更加稳定。
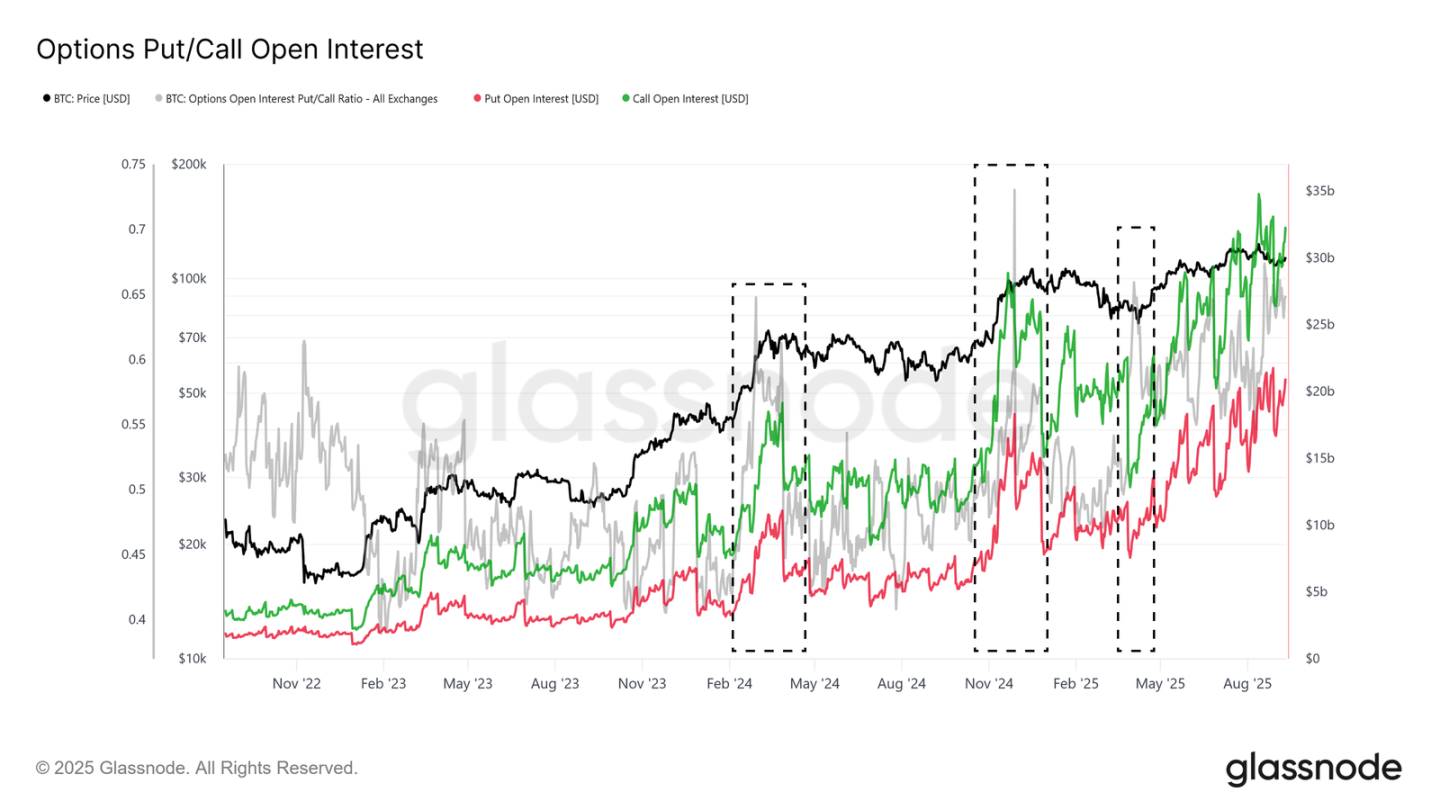
未平仓合约构成显示看涨期权明显多于看跌期权,尤其是在顶部形成阶段,突显了市场在仍管理下行风险的同时偏向看涨。总之这些动态表明市场结构更健康、更具风险管理特性,可能会抑制即将到来的狂热和看跌走势。
结论
比特币市场目前的特点是卖方压力与流入减弱之间的微妙平衡。经验丰富的短期持有者的获利了结,加上近期高位买入者的亏损兑现,限制了上涨势头,并使 11 万至 11.6 万美元区间成为主要战场。
链上流动性仍然具有建设性,但呈下降趋势,而 ETF 资金流曾经是本轮上涨周期的基石已经失去强度。因此衍生品市场变得更为重要,期货和期权活动有助于吸收抛售并影响价格方向。期货基差和期权头寸都反映出比过去过热阶段更平衡的结构,表明市场在更坚实的基础之上推进。
展望未来,能否收复并守住 11.4 万美元对于恢复信心和吸引新的资金流入至关重要。若无法做到,则短期持有者可能再次面临压力,10.8 万美元以及最终的 9.3 万美元是关键的下行水平。简而言之,比特币正处于十字路口,衍生品支持维持着市场结构,而更广泛的需求必须加强才能推动下一次持续反弹。
免责声明:本文章仅代表作者个人观点,不代表本平台的立场和观点。本文章仅供信息分享,不构成对任何人的任何投资建议。用户与作者之间的任何争议,与本平台无关。如网页中刊载的文章或图片涉及侵权,请提供相关的权利证明和身份证明发送邮件到support@aicoin.com,本平台相关工作人员将会进行核查。


