撰文:Frank,PANews
随着多个币安 Alpha 代币的暴涨,关于币安 Alpha 引领的山寨季讨论再次甚嚣尘上。
有不少用户在社交媒体上讨论,什么样的逻辑是潜在的财富密码。然而,这种所谓的山寨季实际上只是个别「暴走」项目引发的认知偏差,但如果要为这些财富密码找共性,在一众币安 Alpha 代币当中,什么样的代币条件能够引领市场?
PANews 通过对币安 Alpha 上线的 335 个代币进行全面的数据分析,从市值、链分布、交易对类型以及是否空投等多个维度,深入挖掘其背后真正的财富密码,并探究一个终极问题:所谓的币安 Alpha「山寨季」真的来了吗?
山寨季或是幻觉, 近一周涨幅超一倍代币仅有 5 个
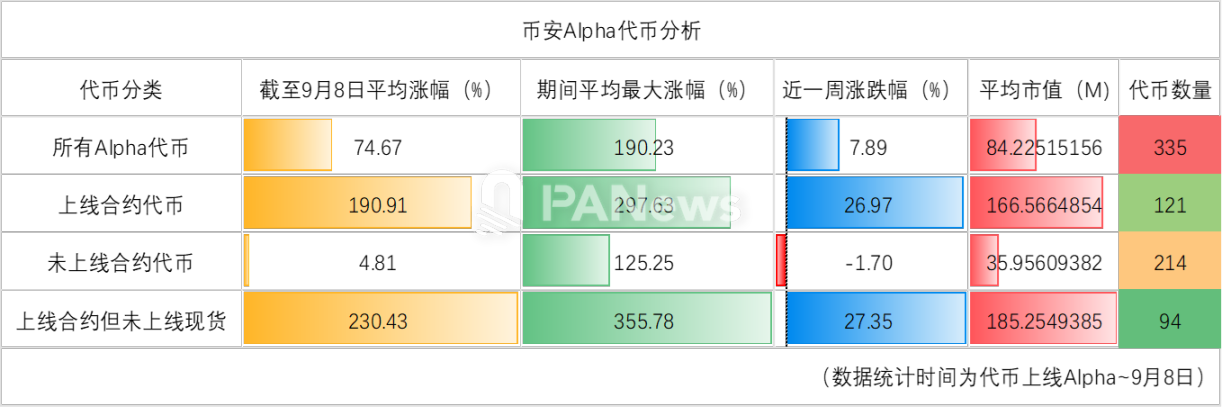
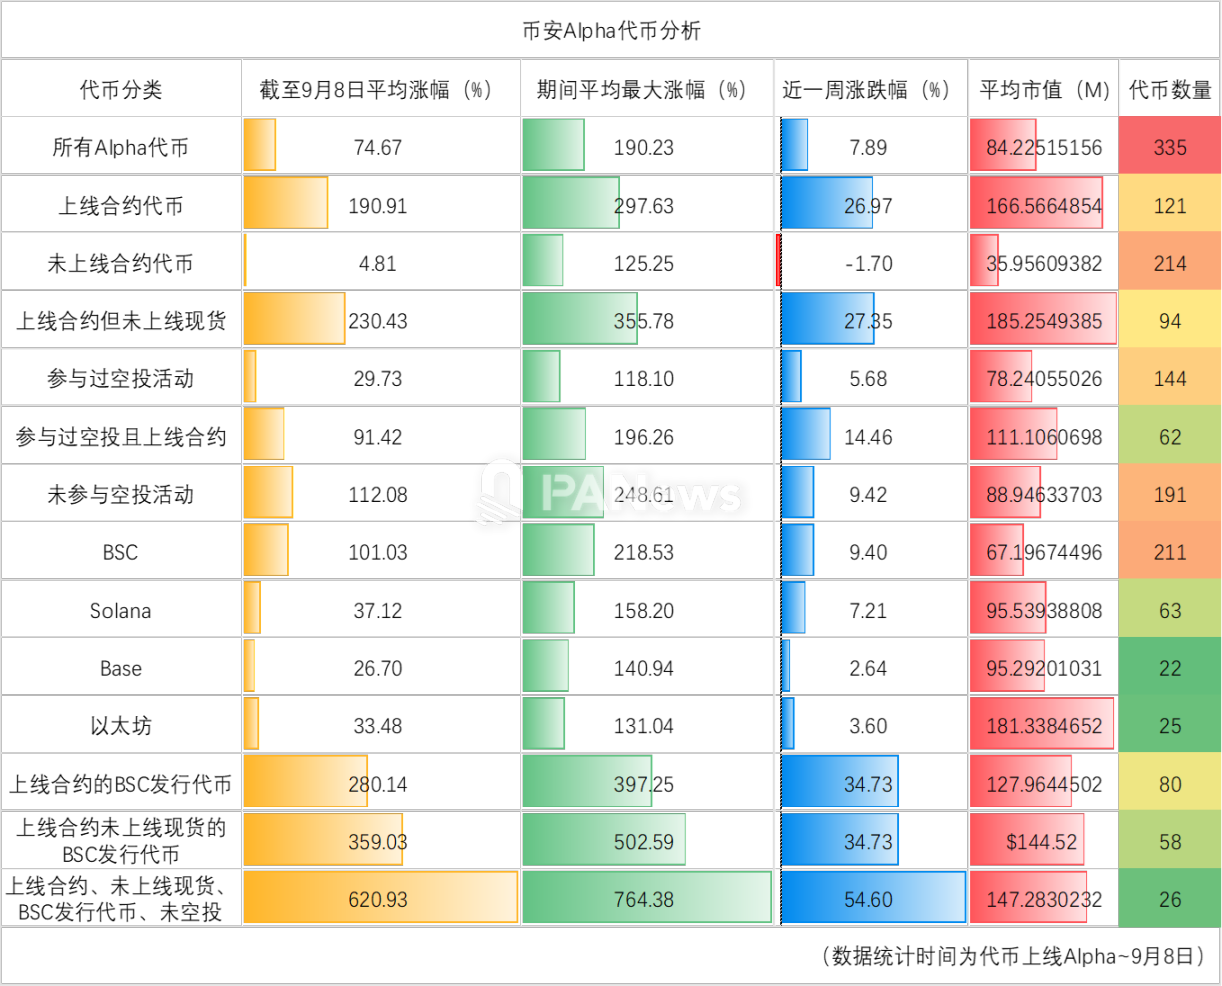
根据 PANews 对币安 Alpha 上线的 335 个代币的分析,其市场表现呈现出两个核心特征:普遍的「上线拉升效应」与悬殊的「业绩两极分化」。
普遍的拉升效应: 从整体数据看,这批代币自上线以来的平均涨幅为 74.6%,而历史平均最大涨幅更是高达 190%。这意味着绝大多数代币在登陆 Alpha 平台后都经历过一轮强劲的拉升。具体来看,有 120 个代币(占比 35%)在上线后的最高价曾一度翻倍,仅有 19 个代币从未突破其发行价。
业绩的两极分化: 然而,拉升后的长期表现差异巨大。截至目前,虽然有 146 个代币(占比 43.5%)实现上涨,其中 44 个涨幅翻倍,明星项目 MYX 更是创下 123 倍的惊人回报。但与此同时,也有 81 个代币(占比 24%)价格腰斩,最大跌幅超过 97%。
市值分布特征: 从项目体量来看,这批代币的平均市值为 8422 万美元,中位数为 1858 万美元。其中,市值超过 1 亿美元的项目数量最多(48 个),其次是市值在 1000 万美元至 2000 万美元区间的项目。这也表明,尽管市场中存在总市值低于 100 万美元的小项目,但 Alpha 平台上的主流项目仍具备一定规模。
近一周的数据:有 141 个代币在近一周内实现了上涨,其中涨幅最大的仍是 MYX,7 日的涨幅达到了 1064%。不过,最近一周涨幅超过 1 倍的代币实际上并不多,只有 5 个。从统计数据上来看,币安 Alpha 代币在最近一周的平均涨跌幅仅为 7.8%,远不及全周期的涨跌幅高。因此,币安 Alpha 上的山寨季在近期爆发可能只是一种认知偏差,并不存在普遍性。
上合约不上现货涨的更多?
除此之外,社交媒体上讨论甚多的话题之一是,上线币安合约但未上线现货的代币可能涨幅更大。
首先,在整体上来看,目前只有 28 个代币上线了币安的现货交易对,占比仅为 8.3%,其中绝大多数也上线了合约交易对。而上线了合约的交易对则相对较多,达到了 121 个,占比达到 36%。只上线了合约但未上线现货交易对的代币有 94 个,这些代币在 7 天内的涨幅平均值达到了 27%,的确高于所有代币的平均值。相比而言,没有上线合约交易对的代币平均涨幅为 -1.7%,近一周内整体处于下跌状态。
市值上,未上线合约的代币市值平均在 3596 万美元左右,而已经上线合约的代币平均市值约为 1.6 亿美元。显然,那些市值更高的代币更有可能优先上线合约交易。整个周期来看,已上线合约的代币到目前的平均涨幅达到 190%,历史最大涨幅平均达到 297%,数据表现的确要好一些,而上线了现货的代币至今的平均涨幅仅为为 45.77%(此处指的是上线 Alpha 之后的表现)。
相比来看,上线合约但不上线现货,平均涨幅达到 230%,平均最大涨幅达到 355%,符合这一条件的代币的确表现更好一些。
BSC 链本土优势明显,平均涨幅超一倍
在链的方面,是否也存在不同的效果呢?
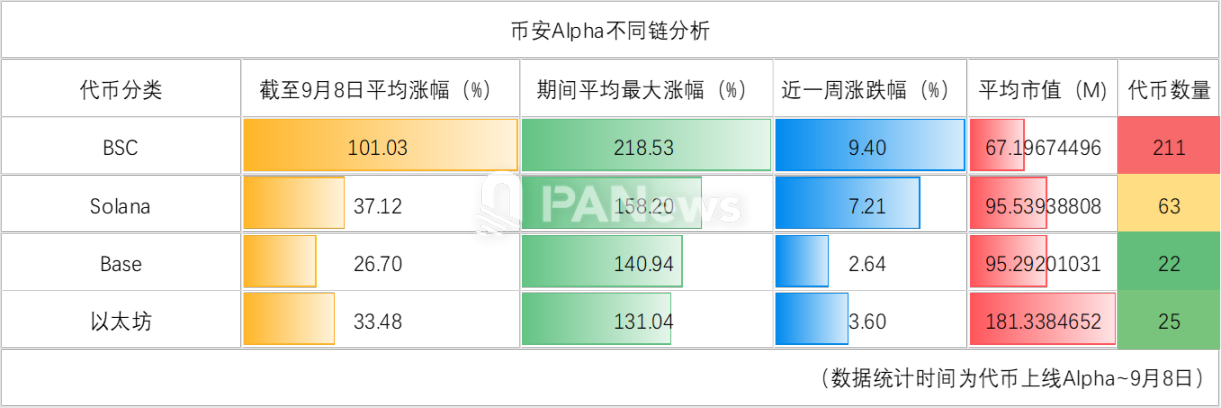
从链的分布来看,目前上线的代币当中,Base 链有 22 个,平均涨幅达到 26%;BSC 链的代币数量有 211 个,平均涨幅达到 101%;以太坊链上的代币有 28 个,平均涨幅约为 33.4%;Solana 链上的代币有 64 个,平均涨幅约为 37%。
从链的分布来看,BSC 作为原生的公链,的确更受市场的青睐,市场表现优于其他公链的代币。
买旧不买新,热门代币普遍上线较早
近期涨幅最大的几个代币都有什么特点?
1、BSC 链上的代币占据主导,近一周涨幅超过 100% 的 5 个代币当中,有 4 个来自 BSC 链上,1 个是 Solana 链上发行。
2、上线时间并非近期新上代币,这些代币普遍在 5 月和 7 月上线,只有一个是 8 月 24 日上线。
3、上线合约交易对的代币有 3 个,但这似乎并不能说明涨幅大于上线合约交易有直接关系。
4、市值分布方面,并无太大的统计意义。这 5 个代币的市值范围从数十万美元到数十亿美元都存在。不过 4 个代币的市值都是超过 1000 万美元。
如果将视线放的长远一些,分析一下上线至今涨幅超过 100% 的代币来看,则可能有更多的参考性。
1、市值方面,这些代币普遍的市值都超过了 1000 万美元,且市值超过 1 亿美元的代币涨幅排名普遍也更高。
2、上线合约的数量占到 54.5%,从这一点来看,但这似乎并不能直接证明高涨幅与上线合约交易有必然联系。
3、在 BSC 链发行的数量占到了 56%,在 Solana 上发行的代币数量占到了 22.7%。这两条链的总体占比就达到了近 8 成。
4、上线币安 Alpha 的时间上,有着明显的区别。上线时间的分布分别为:4 月(12 个)、5 月(4 个)、6 月(3 个)、7 月(16 个)、8 月(6 个)、9 月(3 个)。从这一数据来看,明显 4 月、7 月、8 月上线的代币在市场表现上更好一些。
发空投反而不利于代币价格拉升?
还有一个市场比较关心的角度,就是这些参与过币安 Alpha 空投活动的代币表现究竟如何?经过 PANews 调查,目前 Alpha 空投过的代币数量为 144 个。这些代币至今的平均涨幅约为 29%,实际上并不如所有 Alpha 代币的表现。其中有 91 个代币在上线 Alpha 后到目前的价格处于下跌状态,最大的跌幅达到了 97%。但是,从最大涨幅的角度来看,这些代币在上线 Alpha 后都曾迎来了一阵价格拉升,平均的最大涨幅约为 1235%,不过这里观察数据可以看到,REX 在上线后的最大涨幅达到了 1457 倍,这是由一个短时异常的 K 线导致。剔除此类异常的数据之后的平均最大涨幅约为 118%。
然而,当数据筛选条件为参与过空投活动、并且已经上线币安合约交易之后,这些代币的平均涨幅就达到了 91%,平均最大涨幅则达到了 196%。这一数据表现好于空投代币的平均水平,但又低于合约代币的平均水平。
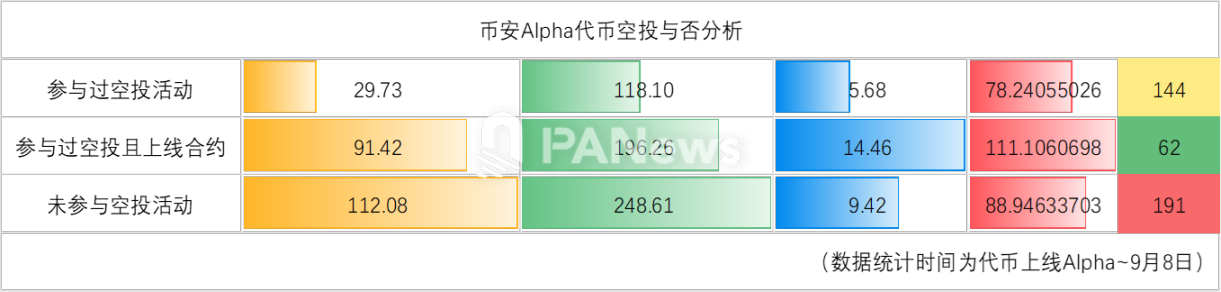
从这个角度来看,上线合约交易与否成为了币安 Alpha 代币最关键的利好要素之一。相反,参与空投对项目本身的市场价格来说,并没有什么推动作用,甚至可能起到副作用。
最优组合:上合约、不上现货、BSC 链、不空投
那么,回到我们的终极问题,什么样的代币可能是币安 Alpha 当中表现最好的类别?结合此前的分析,我们能够从多个维度当中,看到几个潜在的利好条件,分别是上线合约交易、发行于 BSC 链、未进行空投、未上线现货交易。
叠加几个条件后,如果是发行在 BSC 链上且已上线合约交易的代币的平均涨幅就已经达到 280%,高于只是上线合约的代币。而如果再增加未上线现货的筛选,则平均涨幅将达到 359%。而最强的筛选条件则是上线合约、未上线现货、未发行空投、BSC 链上发行的代币,这种情况的代币平均的涨幅达到了 620%,平均最大涨幅则是达到了 764%,近一周的涨幅则为 54%,各个角度的数据几乎都达到了最优情况。
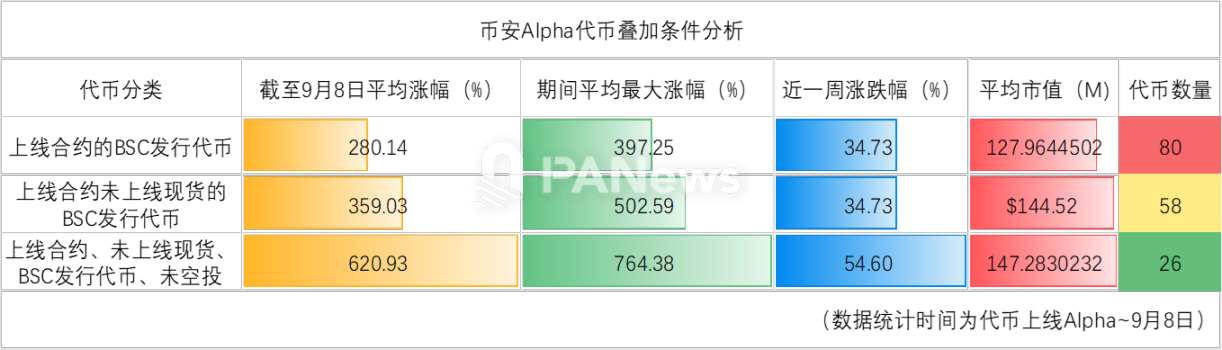
至此,我们似乎找到了币安 Alpha 上潜力股的密码,且这样的条件筛选之下的代币数量仅有 26 个。仔细分析这样结果的原因,我们能够发现实际上在这个过程中,上线合约交易和发行于 BSC 链与否成为最关键的要素,其他几项则更像是辅助要素。不过,戏剧化的是,这些辅助要素并不是因为这些项目或者代币多做了什么,反而是并未上线现货和空投这种减法。
从根本上来说,这背后的潜在逻辑或许在于,空投代币会给市场大量带来低价筹码,形成砸盘效果。而未上线现货交易,只上线合约交易,则意味着这些代币的价格难度相对更低。当然,对于持有现货的投资者来说,上涨总是好事,但对于喜欢合约交易的投资者来说,这类代币的波动也更大,很容易形成轧空效果。
不过,值得注意的是,以上研究所建立的条件是历史数据,且存在过度拟合的可能性。并且在研究过程中,一大遗憾是未能将这些代币的分类和更具体的项目信息进行分类,这些可能是更加重要的要素。因此,这些研究结论并不能作为实际的投资判断依据。希望这样的研究只是在方法引导上抛砖引玉,给读者提供一个新的角度。
当前的机遇并非无脑买入即可获利的牛市初期,而是一个需要精挑细选、深度分析的结构性市场。对于投资者而言,理解这种现象背后的逻辑,远比单纯追逐热点更为重要。因为在这场由合约交易主导、波动性极大的博弈中,机遇的另一面,永远是需要警惕的风险。
免责声明:本文章仅代表作者个人观点,不代表本平台的立场和观点。本文章仅供信息分享,不构成对任何人的任何投资建议。用户与作者之间的任何争议,与本平台无关。如网页中刊载的文章或图片涉及侵权,请提供相关的权利证明和身份证明发送邮件到support@aicoin.com,本平台相关工作人员将会进行核查。


