加密市场在美联储主席杰罗姆·鲍威尔今天发表温和言论后重新活跃起来。鲍威尔在杰克逊霍尔的演讲中为降息打开了大门,传统市场和加密市场对此都充满期待——尽管并不一定是预期。
加密货币重新攀升至4万亿美元以上,道琼斯工业平均指数在鲍威尔暗示可能降息后上涨了900点,日内涨幅达到2%。在经历了数周的整合后,传统和数字资产同步出现风险偏好反弹,标准普尔500指数上涨了1.68%,以科技股为主的纳斯达克上涨了2.1%。
鲍威尔在年度研讨会上的主题演讲比市场预期的更加温和。他表示:“就业的下行风险正在上升。由于政策处于限制性区域,基线前景和风险平衡的变化可能需要调整我们的政策立场。”
这些评论有效地确认了市场对9月降息的预期——这是特朗普总统第二任期内的首次降息——使风险资产飙升。为什么?较低的利率意味着更便宜的资金,这通常会导致更多资金从安全的、收益投资转移到风险更高的投资,如股票和加密货币。
与此同时,随着中东紧张局势升级,油价本周上涨了4%,达到76.45美元。然而,加密市场似乎对地缘政治的不确定性毫不在意。
比特币今天上涨了3.5%,当前价格超过116,000美元。但通常情况下,当比特币上涨时,流动性较低的山寨币会被推得更高。
以太坊今天上涨超过12%,让交易者期待突破其历史最高价4,878美元——这一纪录自2021年11月以来保持不变。但不仅仅是ETH:狗狗币和索拉纳,这两种市场上最大的山寨币也在经历显著的涨幅。
以下是图表的分析:
狗狗币(DOGE)价格:表情包之王的回归
在过去24小时内,狗狗币上涨了9%,达到0.23美元,显著超过比特币的温和涨幅。DOGE目前在市值前十的币种中稳居舒适位置,总价值超过350亿美元。
除了对更广泛市场走势的典型过度反应外,这一激增还伴随着8月份超过6.8亿DOGE(价值1.57亿美元)的鲸鱼积累,技术指标显示未来还有更多上涨空间。
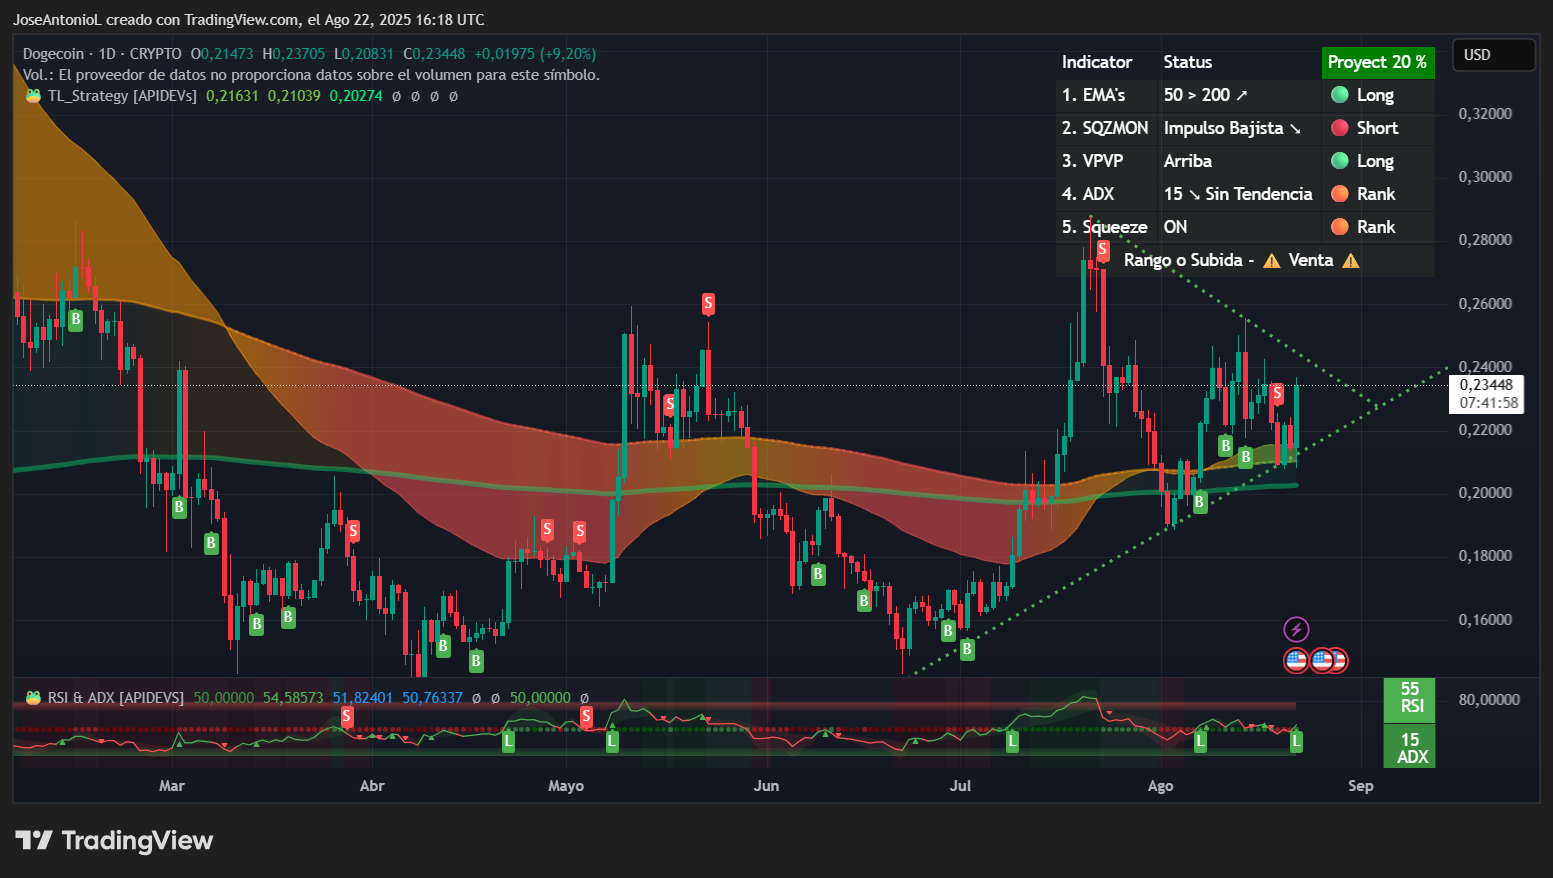
狗狗币价格数据。图片来源:Tradingview
狗狗币仍处于对称三角形中,自7月以来价格处于压缩阶段。今天的激增可以被解读为从三角形支撑位的预期反弹——在决定性突破之前还有一些继续上涨的空间。
如果这一模式保持,预计在接下来的几天内会出现更低的高点和更高的低点。
该币的相对强弱指数(RSI)为55。RSI在0到100的范围内测量动量,70以上的读数表示超买状态,30以下则表示超卖。在55的水平上,DOGE在达到交易者通常获利了结的水平之前还有上涨空间,表明健康的买入压力而没有过度投机。
狗狗币(DOGE)的平均方向指数(ADX)为15。这确认了三角形内部的行为,表明无论哪个方向的动量都非常低。该指标在一个范围内测量趋势强度,读数超过25确认强趋势,低于20则表明没有明确方向。DOGE的低ADX读数表明最近的看跌修正正在减弱——可以认为是卖压逐渐消退——如果买家坚定介入,可能会为趋势反转铺平道路。
50日指数移动平均线(过去50天的平均价格)在0.20美元附近提供支撑——基本上是今天的起始价格——而200日EMA大约在0.18美元。当当前价格高于这两个水平时,正如DOGE目前所做的,通常会发出看涨市场的信号。该币最近进入了“金叉”形态,经验丰富的交易者通常将其解读为明确的看涨信号。但EMA之间的差距非常缓慢,大多数交易者很难期待近期会有飞向月球的行情。更可能的解读是“它不再下跌了”。
挤压动量指标显示“开启”状态,并与其他指标一致,表明在压缩期后波动性正在增加。当该指标发出信号时,通常会在市场突破交易区间之前预示爆发性走势。结合鲸鱼积累和ETF投机——以及三角形之前的尾部是看涨的事实——你就得到了一个可能让看涨交易者满意的局面。
关键水平:
立即支撑:0.21美元(最近反弹水平)
强支撑:0.20美元(50日EMA)
立即阻力:0.24美元(三角形阻力)
强阻力:0.30美元(主要目标,决定性看涨突破)
索拉纳(SOL)价格:“以太坊杀手”展现实力
索拉纳上涨了令人印象深刻的8.99%,达到196.53美元,交易量激增至38亿美元——几乎是日均水平的两倍。SOL目前在市值前五的币种之外,市值超过1050亿美元。
如果不提到该币的看涨激增与坎耶·韦斯特的YZY表情包币昨晚在索拉纳上推出的巧合,我们就失职了。Ye的表情包币短暂达到了30亿美元的市值,随后稳定在15亿美元,测试了网络的链上交易量承载能力。
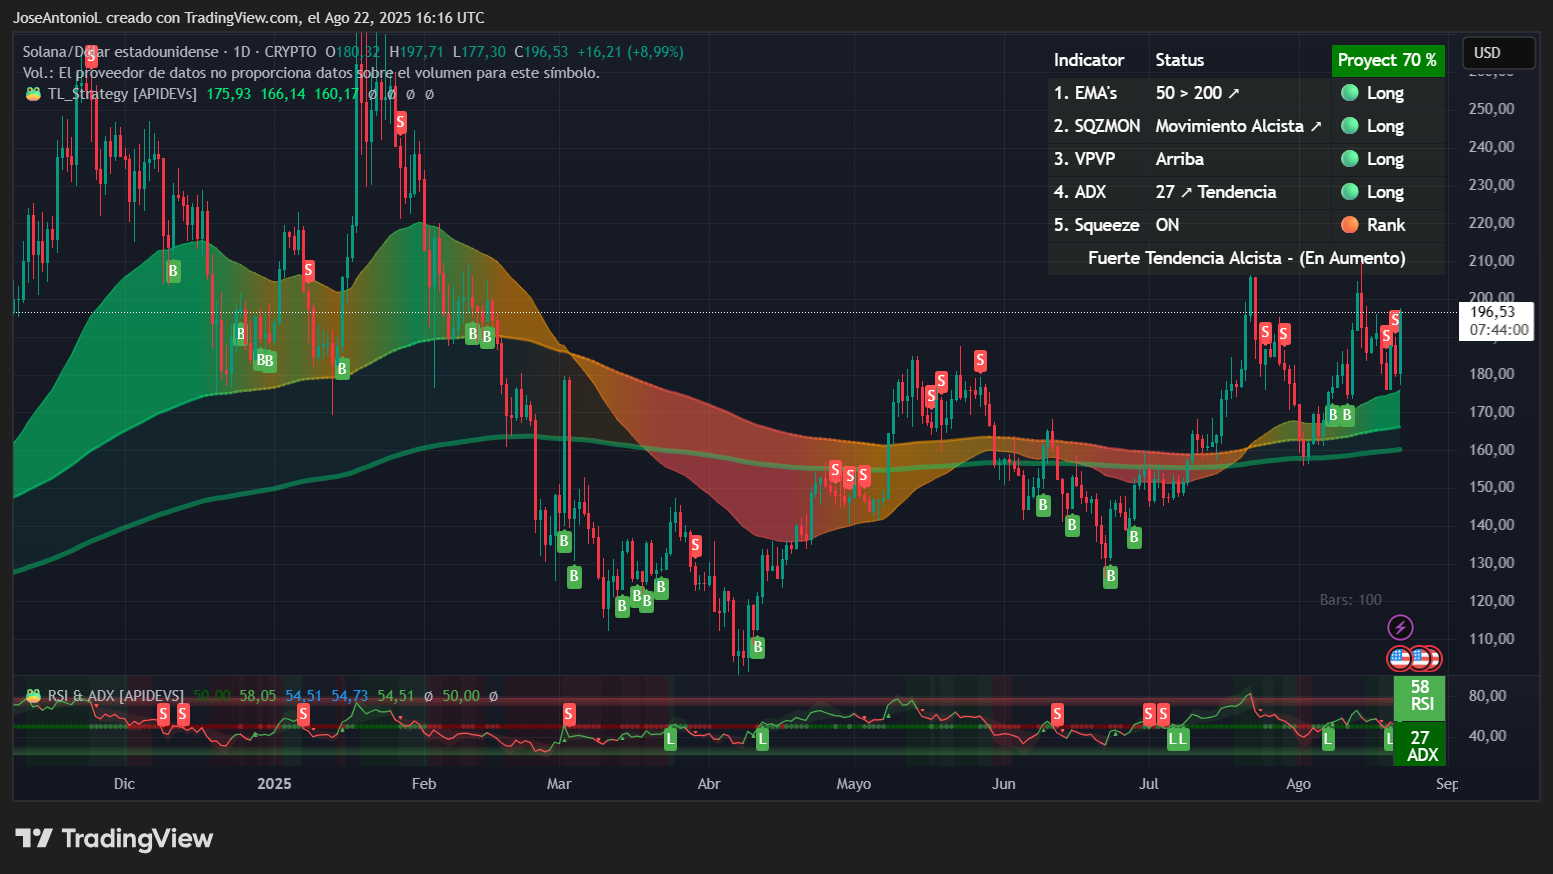
索拉纳价格数据。图片来源:Tradingview
无论索拉纳的多头应该感谢鲍威尔还是Ye(其实是鲍威尔,实话实说),毫无疑问SOL的市场情绪正在转变。在Decrypt母公司Dastan开发的预测市场Myriad上,索拉纳在年底前达到历史最高价294.33美元的概率今天激增超过10%。不过,尽管概率仍然偏向空头,但正在缩小:Myriad用户目前认为SOL有44.4%的机会打破其纪录。
图表似乎与这种转变的观点一致。
索拉纳的ADX现在为27,突破了确认趋势建立的关键25阈值。SOL的读数表明,最近的上升趋势具有持续性,动量在增强而不是耗尽。
SOL的RSI为58,处于交易者所称的“甜蜜点”——足够强劲以显示出真正的买入兴趣,但远低于70的水平,通常在此水平会出现获利了结。这一定位允许在达到历史超买条件之前再有20-30%的上涨空间,而在超买条件下通常会发生修正。
50日EMA在166美元时为最近的下跌提供了关键支撑,目前价格舒适地在196美元以上交易。200日EMA在160美元更低的位置形成了支撑水平的安全网。移动平均线之间的扩展差距——较快的50日线远离较慢的200日线——通常发生在持续的上升趋势中,并为买家在任何回调时提供多个入场点。
该币最近也进入了金叉。但与DOGE不同,这里的EMA正在分离。这表明看涨动量虽然缓慢,但正在积累。
关键水平:
立即支撑:180美元(突破水平)
强支撑:166美元(50日EMA)
立即阻力:210美元(7月高点)
强阻力:250美元(心理目标)
以太坊(ETH)价格:山寨币之王咆哮
以太坊,山寨币之王,去中心化智能合约“世界计算机”的保护者,名副其实的首位,今天在其宝座上微笑。ETH正在火热上涨。
即使在昨天的损失之后,今天这位山寨币之王以12.16%的强劲涨幅领先于加密主要币种,突破了4700美元,短暂触及4830美元,接近2021年的历史最高点4878美元。
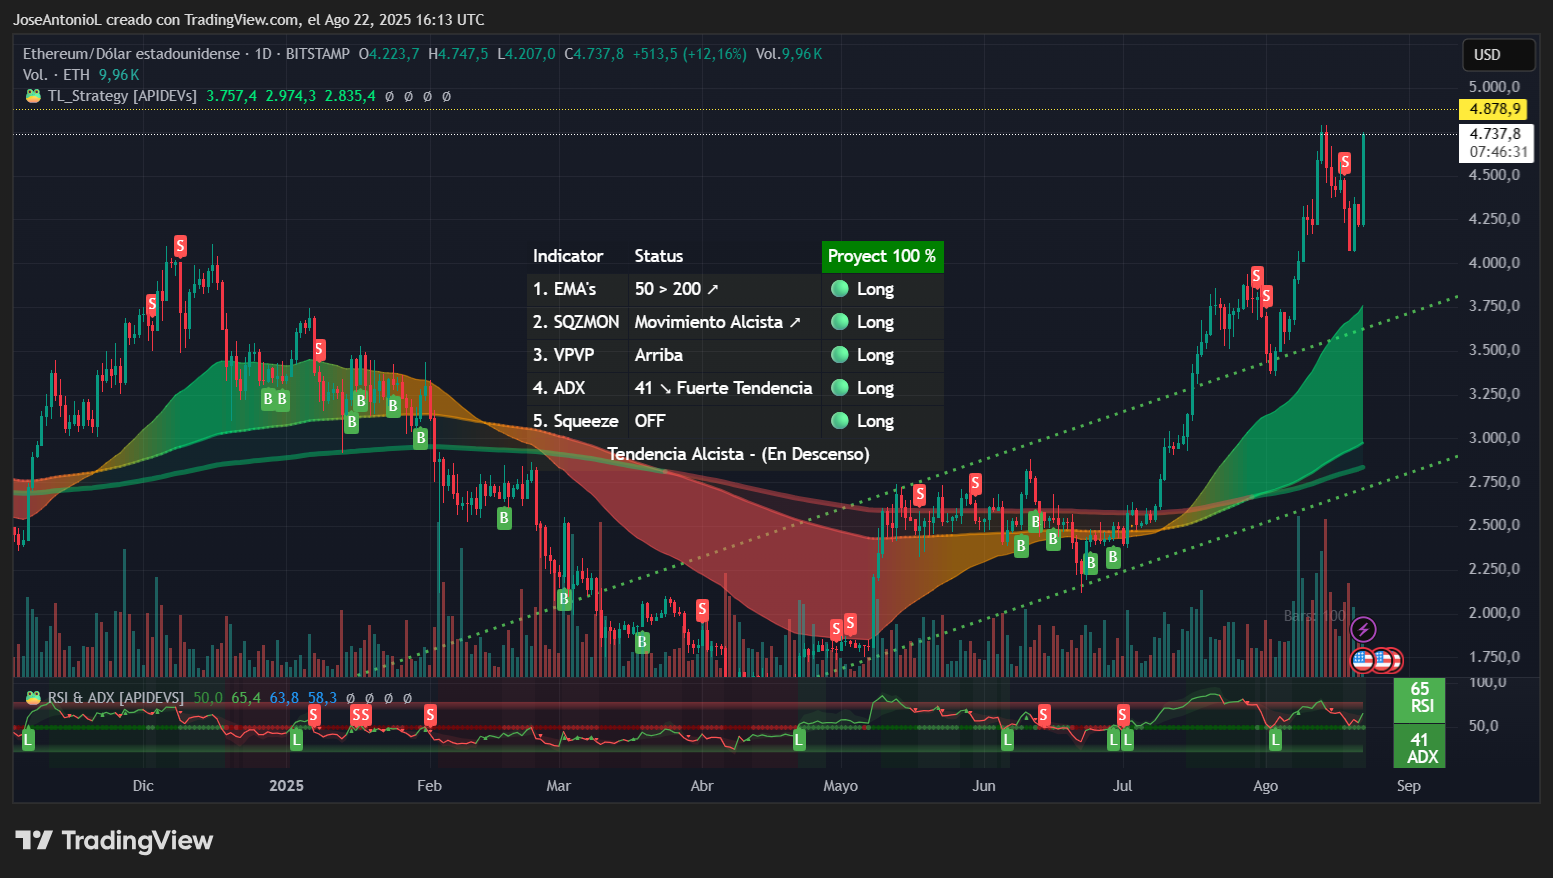
以太坊价格数据。图片来源:Tradingview
ADX为41,信号显示出极强的动量——读数超过40表明强势趋势,修正往往较浅且短暂。历史数据显示,ETH在主要上涨期间可以维持ADX读数超过40数周。而价格远高于任何统计支撑——这可能是一把达摩克利斯之剑,因为这使得急剧下跌与异常看涨的走势同样可能。
RSI为65,接近但尚未达到70的超买阈值。在强劲的上升趋势中,RSI可以在50-70之间维持较长时间——这被称为“嵌入RSI”。
挤压动量指标也表明,爆发性走势已经从最近的压缩阶段释放出来。这通常标志着一个趋势期,动量保持稳定,因此对多头来说可以是一个安全的押注。
预测市场在说什么?我们很高兴你问了。在Myriad上,ETH达到5000美元的概率已经飙升至89%,自昨天以来上涨超过17%。一个独立市场显示以太坊在今年达到新的历史最高点的概率接近94%。
关键水平:
立即支撑:4500美元(心理水平)
强支撑:3757美元(50日EMA)
立即阻力:4866美元(历史最高点)
强阻力:5500美元(测量移动目标)
作者表达的观点和意见仅供信息参考,并不构成财务、投资或其他建议。
免责声明:本文章仅代表作者个人观点,不代表本平台的立场和观点。本文章仅供信息分享,不构成对任何人的任何投资建议。用户与作者之间的任何争议,与本平台无关。如网页中刊载的文章或图片涉及侵权,请提供相关的权利证明和身份证明发送邮件到support@aicoin.com,本平台相关工作人员将会进行核查。


