
毫无疑问,这轮加密牛市率先在美股启动。
当“加密金库储备策略”成为美股的弄潮儿,币股联动时,我们应该如何评估一个股票的好坏?是看谁储备的加密资产金额大,还是看谁有钱一直在买加密资产?
如果最近频繁关注加密美股的分析,那么你应该会频繁看到一个术语反复出现 --- NAV,即 Net Asset Value,净资产价值。

有人拿 NAV 来分析加密股票是否被高估或低估,有人则借 NAV 将某个新加密储备公司的股价和微策略的股价做对比;而更关键的财富密码在于:
一个美股公开上市的公司如果开展加密储备策略,持有1美元的加密货币,其价值是大于1美元的。
这些加密资产储备的公司,可以继续增持资产或自己回购股票,导致其市值往往远超其NAV(净资产价值)。
但对于普通韭菜来说,玩币圈里的大部分项目很少用严肃指标来评估,更不用说以此来评估传统资本市场中的股票价值。
因此,小编也打算做一期 NAV 指标的科普,帮助关注币股联动的玩家们,更好的理解币股的运作逻辑和评估方法。
NAV:你的股票,究竟值多少钱?
在深入探讨加密美股之前,我们需要先弄清楚一个基础概念。
NAV 并不是一个专门为加密市场设计的指标,而是传统财务分析中最常见的衡量公司价值的方法之一。它的本质作用在于回答一个简单的问题:
“一家公司的每股股票究竟值多少钱?”
NAV 的计算方式非常直观,即公司资产减去负债后,股东每股能够分到的价值。


为了更好地理解 NAV 的核心逻辑,我们可以用一个传统的例子来说明。假设有一家房地产公司,拥有以下财务状况:
资产:10 栋楼,总价值为 10 亿美元;负债:贷款 2 亿美元;总股本:1 亿股。
那么这家公司的每股净资产价值为:80美元/股。这意味着,如果公司清算资产并偿还所有债务,每股股票的持有人理论上可以分得 80 美元。
NAV 是一个非常通用的财务指标,特别适用于资产驱动型的公司,比如房地产公司、投资基金公司等。这些公司拥有的资产通常比较透明,估值也相对容易,因此 NAV 能很好地反映其股票的内在价值。
在传统市场中,投资者通常会将 NAV 与股票当前的市场价格进行对比,来判断一只股票是否被高估或低估:
-
如果 股价 > NAV:股票可能存在溢价,投资者对公司的未来增长潜力有信心;
-
如果 股价 NAV:股票可能被低估,市场对公司的信心不足,或者资产估值存在不确定性。
当 NAV 被应用到加密美股中时,其意义发生了一些微妙的变化。
在加密美股领域,NAV 的核心作用可以总结为:
衡量一家公开上市公司持有的加密资产对其股票价值的影响。
这意味着 NAV 不再仅仅是传统意义上的“资产减去负债”公式,而是需要特别考虑公司持有的加密货币资产的价值。这些加密资产的价格波动会直接影响公司的 NAV,并间接影响其股价。
像 MicroStrategy(微策略)这样的公司,其 NAV 的计算方式会特别强调其比特币持仓的价值,因为这部分资产占据了公司总资产的绝大部分。
于是上面的计算方式稍作延伸:


当加密资产被加入到 NAV 的计算中时,一些你不得不考虑的变化是:
-
NAV 的波动性大幅增加:由于加密货币的价格波动剧烈,这使得 NAV 不再像传统市场中的房地产或基金资产那样稳定。
-
NAV 的价值被加密资产“放大”:加密资产通常会在市场中获得溢价,这意味着投资者愿意支付高于其账面价值的价格来购买相关股票。例如一家公司持有 1 亿美元的比特币资产,但其股价可能反映的是市场对比特币未来增值的预期,导致公司市值达到 2 亿美元。
当市场对比特币的未来价格看涨时,公司 NAV 可能会被投资者赋予额外的溢价;反之,当市场情绪低迷时,NAV 的参考价值可能会下降。
如果你还是没搞明白 NAV,我们不妨用微策略来做个例子。


截止发稿时(7月22日),公开数据显示微策略持有比特币607,770 枚,时价117,903美元,比特币资产总价值在 720亿美元左右,其他资产在1亿美元左右,公司负债则为82亿美元。
而微策略的总股本在2.6亿左右,按照上述计算它的 NAV 约为 248 美元/股。也就是说,在持有 BTC 作为加密储备的情况下,微策略的一股应该值 248美元。
然而,上一个美股交易日中,微策略的实际股价是426美元。
这就反映了市场溢价,即市场如果认为比特币未来还会涨,那么投资者就会将这一预期计入股价,使其股价原高于 NAV。
这种溢价,反映了 NAV 无法完全捕捉市场对加密资产的乐观预期。
mNAV:加密美股情绪温度计
在 NAV 之外,你还能经常看到一些分析师和 KOL 在说另一个类似的指标 --- mNAV。
如果说 NAV 是衡量一股究竟值多少钱的基本款指标,那么 mNAV则是一个更贴合加密市场动态的进阶工具。
如前所说,NAV 的重点是反映公司当前的净资产(大部分是加密资产)状况,而不涉及市场对这些资产的预期;而 mNAV 是一个更具市场导向的指标,用于衡量公司市值与其加密资产净值的关系。其计算公式为:


这里的“加密资产净值”指的是公司持有的加密货币资产减去相关负债后的价值。
我们可以用一张表来清晰的对比两个指标的区别:
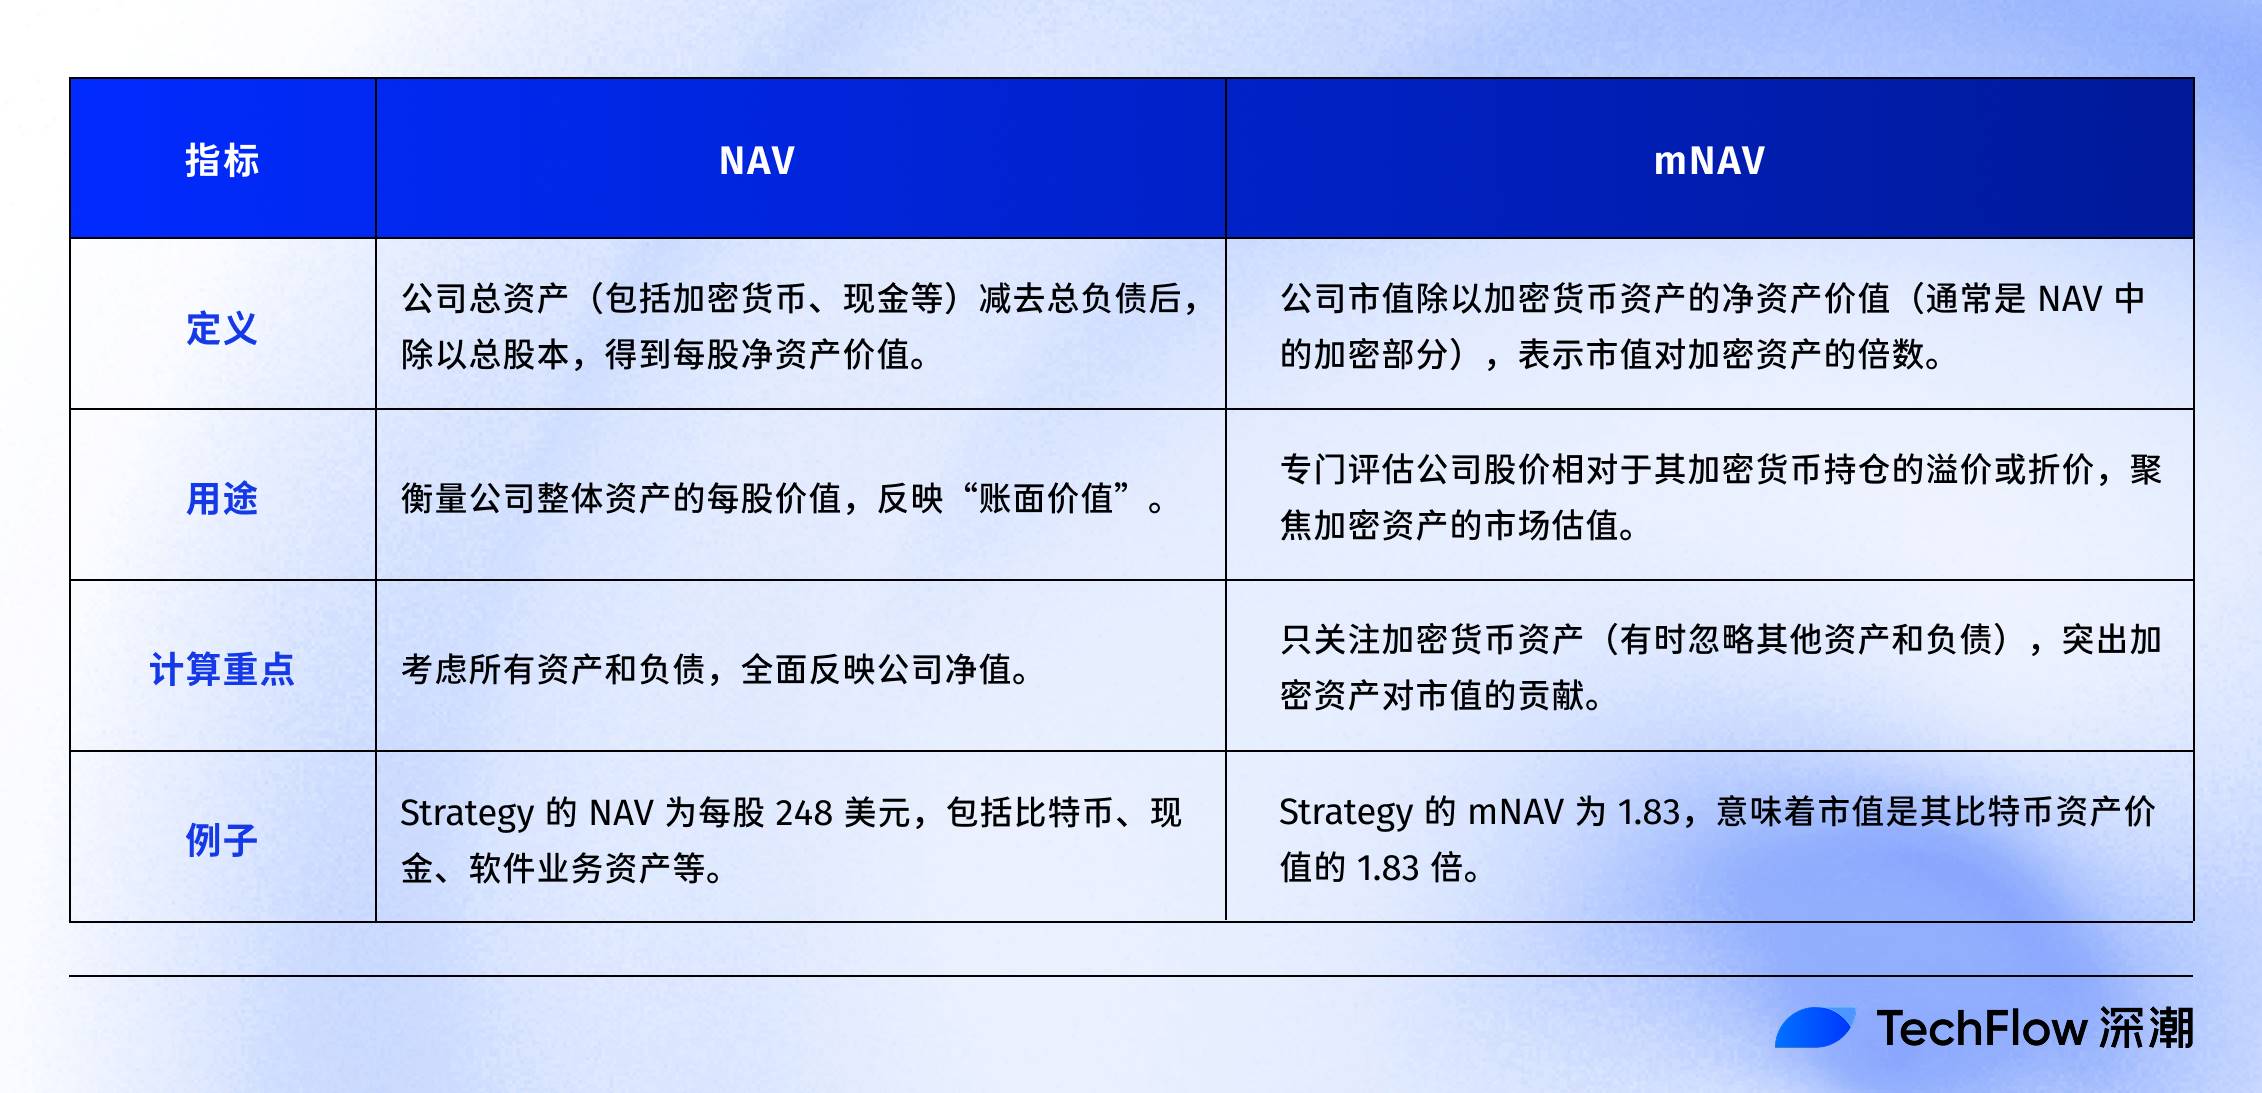
同样按照前文计算,微策略的股票总市值为 1200亿美金左右,而持有的 BTC 的净价值(加密资产+公司其他资产-负债)在635亿左右,那么其 mNAV 大约在1.83。
也就是说,微策略的市值是其比特币资产价值的1.83倍。
所以,当公司持有大量加密货币资产时,mNAV 能更好地揭示市场对这些资产的预期,反映投资者对公司加密资产的溢价或折价情况;比如上面的例子中,微策略的股价相对其加密净资产溢价了1.83倍。
对于关注市场情绪的短线投资者,mNAV 是一个更敏感的参考指标:
当比特币价格上涨时,投资者可能对加密资产驱动型公司的未来表现更加乐观。这种乐观情绪会通过 mNAV 反映出来,导致公司股票的市场价格高于其账面价值(NAV)。
mNAV 高于 1 ,表明市场对公司加密资产的价值有溢价;mNAV 低于 1 ,则意味着市场对公司加密资产的信心不足。
溢价、反身性飞轮与死亡螺旋
如前所说,目前微策略的 mNAV 在1.83左右;
而当 ETH 越来越多的成为上市公司的资产储备时,了解这些公司 mNAV 对于识别对应的美股是否被高估还是低估同样具有一定发的参考意义。
来自 Cycle Trading 的分析师 @Jadennn326eth 已经整理了一份相当详尽的表格,直观的展示了主要的 ETH 储备公司们的资产负债情况以及mNAV值(数据截止至上周)。
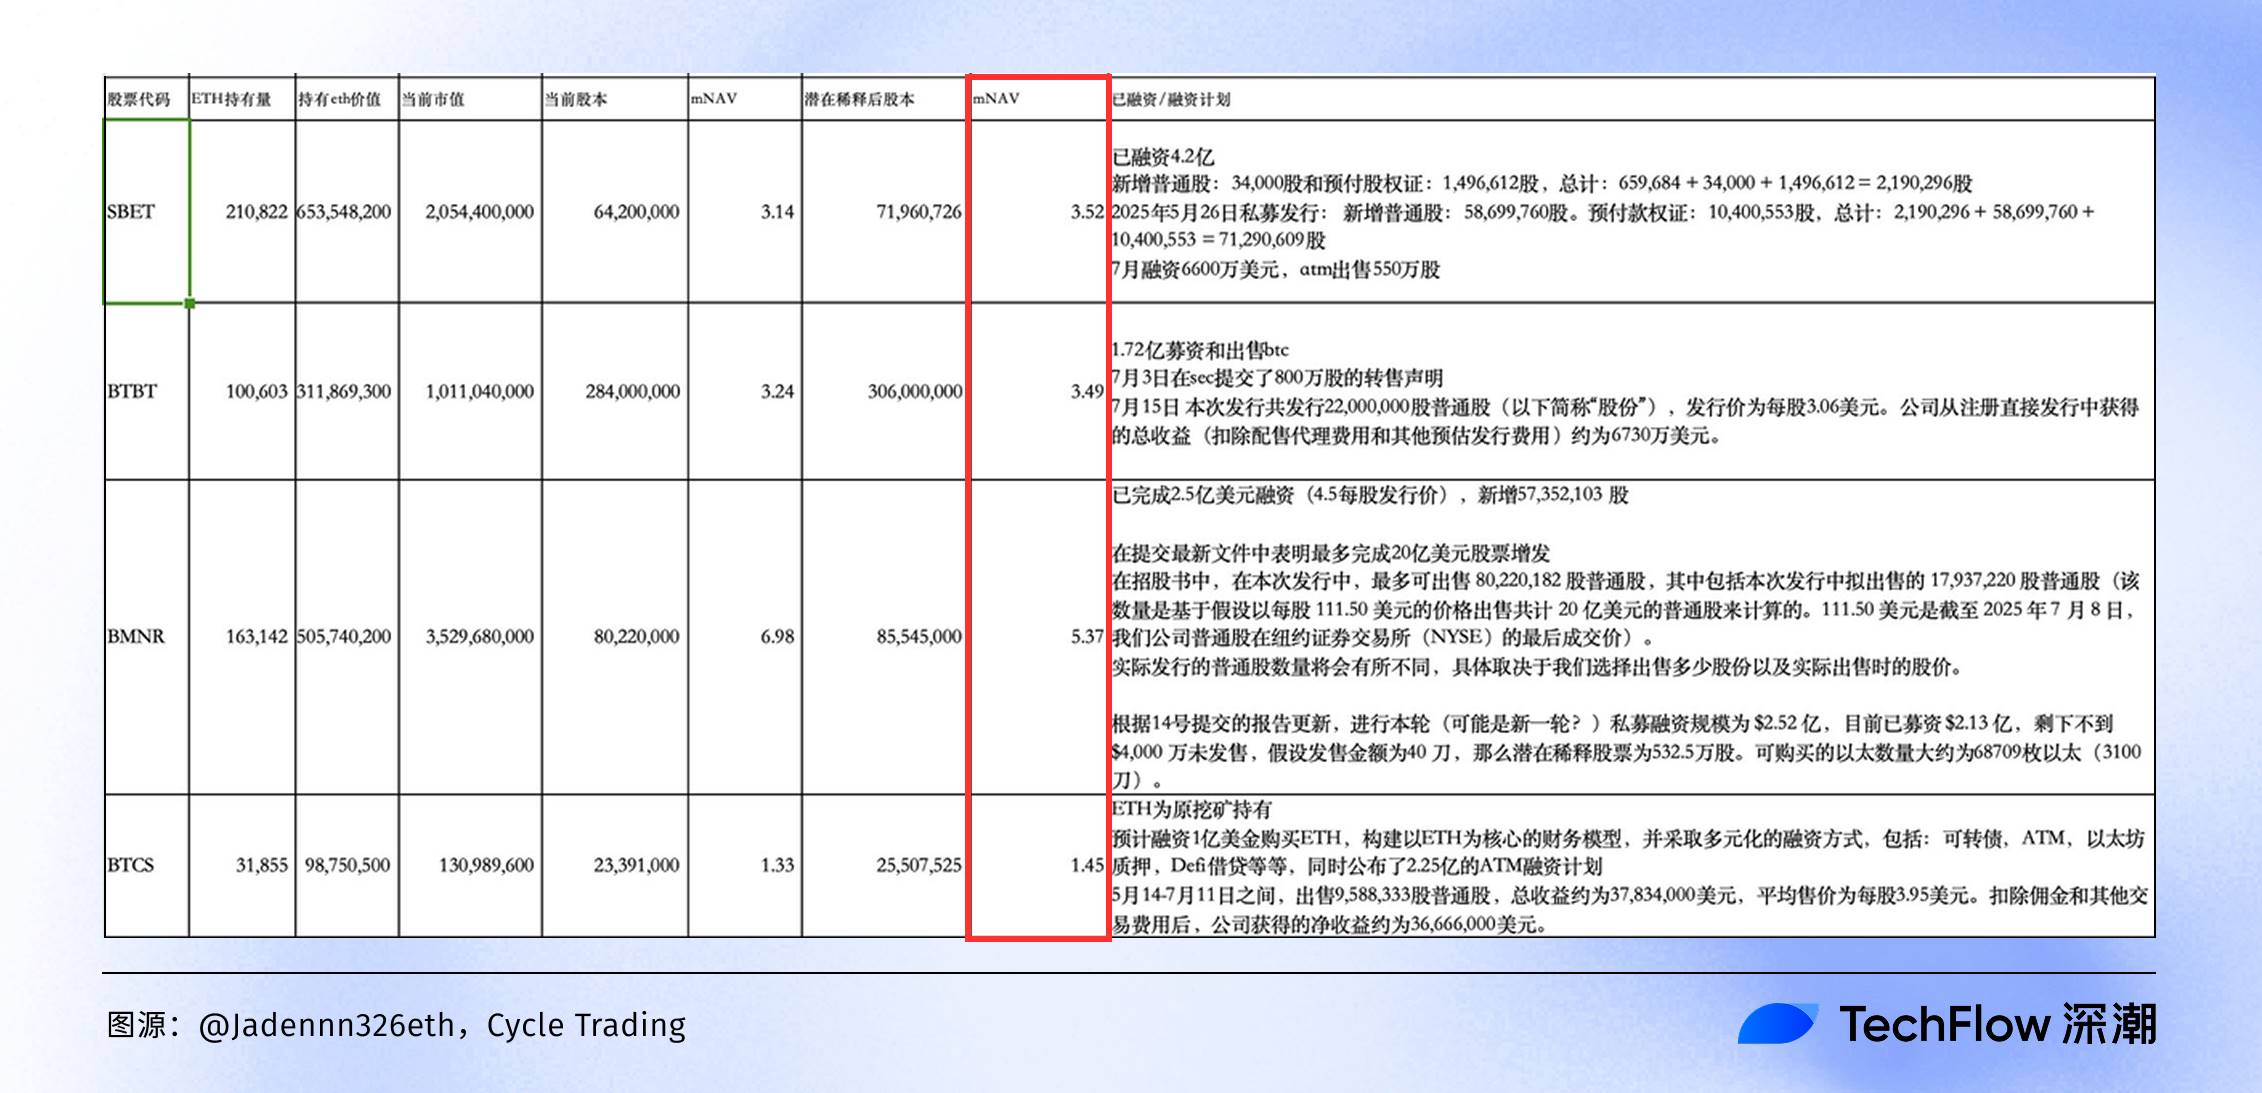
(图源:@Jadennn326eth,Cycle Trading )
从这张ETH储备公司mNAV比较图表中,我们能一眼看出2025年币股联动的“财富地图”:
BMNR 以6.98倍mNAV高居榜首,市值远超其ETH持仓价值,但这可能藏着高估泡沫——一旦ETH回调,股价也将首当其冲受到损害。而 BTCS仅1.53倍mNAV,相对来说溢价较低。
既然看到了这些公司的数据,就不得不聊聊“反身性飞轮”(Reflexivity Flywheel)。
这个概念源自金融大佬索罗斯的反身性理论,在币股联动的2025年牛市中,成了这些公司股价暴涨的“秘密引擎”。
简单说,反身性飞轮就是一个正反馈循环: 公司先发行股票或ATM(At-The-Market)融资,换来现金大举买入ETH;ETH持仓增加推高NAV和mNAV,吸引更多投资者追捧,股价飙升;更高的市值又让公司更容易再融资,继续增持ETH……就这样,形成一个自我强化、滚雪球般的飞轮效应。

而一旦ETH价格回调、监管收紧(比如SEC对加密储备模式审查)或融资成本飙升,升天飞轮就可能逆转成死亡螺旋:股价崩盘,mNAV暴跌,最后受伤的或许也是股市的韭菜。
最后,看到这里你应该明白:
NAV 等指标不是万灵丹,而是工具箱里的利器。
玩家们在追逐币股联动时,多结合比特币/以太坊的宏观趋势、公司负债水平和增长率进行理性评估,才能在看似机会遍地但实则凶险的新周期里,找到属于自己的机会。
免责声明:本文章仅代表作者个人观点,不代表本平台的立场和观点。本文章仅供信息分享,不构成对任何人的任何投资建议。用户与作者之间的任何争议,与本平台无关。如网页中刊载的文章或图片涉及侵权,请提供相关的权利证明和身份证明发送邮件到support@aicoin.com,本平台相关工作人员将会进行核查。


