撰文:Tanay Ved、Victor Ramirez,Coin Metrics
编译:Luffy,Foresight News
关键要点:
-
比特币与股票和黄金的相关性最近已降至接近零的水平,这表明比特币正处于与传统资产的脱钩阶段,这种情况通常出现在重大市场催化因素或冲击期间。
-
虽然比特币与利率的相关性较低,但货币政策的转变也会影响比特币的表现。在 2022 年至 2023 年的货币紧缩周期中,比特币与加息之间呈现出较强的负相关性。
-
尽管比特币素有 「数字黄金」 之称,但从历史上看,它相对股票表现出更高的 beta 系数和更强的上行敏感性,尤其是在宏观经济形势乐观的情况下。
-
自 2021 年以来,比特币的波动率稳步下降,目前其波动趋势更接近热门科技股,这反映出其风险特征正在趋于成熟。
引言
比特币正在与更广泛的市场脱钩吗?比特币最近相对于黄金和股票的出色表现,再次引发了这一话题的讨论。在比特币 16 年的历史中,被赋予了许多标签,从 「数字黄金」 到 「价值储存手段」,再到 「风险偏好资产」。但它真的具备这些特点吗?比特币作为一种投资资产,是否与众不同,还是仅仅是市场上现有风险资产的一种杠杆化表现形式呢?
在本期的《Coin Metrics 网络状况报告》中,我们将探究比特币在不同市场环境下的表现,重点分析它与股票、黄金等传统资产之间相关性较低时期背后的催化因素和条件。我们还将研究货币政策制度的转变如何影响比特币的表现,评估它对更广泛市场的敏感度,并结合其他主要资产来分析它的波动率特征。
不同利率制度下的比特币
美联储是金融市场中最具影响力的力量之一,因为它能影响利率。联邦基金利率的变化,无论是在货币紧缩还是宽松的情况下,都会直接影响货币供应量、市场流动性以及投资者的风险偏好。在过去十年里,我们经历了从零利率时代,到新冠疫情期间前所未有的货币宽松政策,再到 2022 年为应对不断上升的通货膨胀而进行的激进加息。
为了解比特币对货币政策变化的敏感度,我们将其历史划分为五个关键的利率制度阶段。这些阶段考虑了利率的走向和水平,范围从宽松型(联邦基金利率低于 2%)到紧缩型(联邦基金利率高于 2%)。由于利率变化并不频繁,我们将比特币的月度回报率与联邦基金利率的月度变化进行比较。
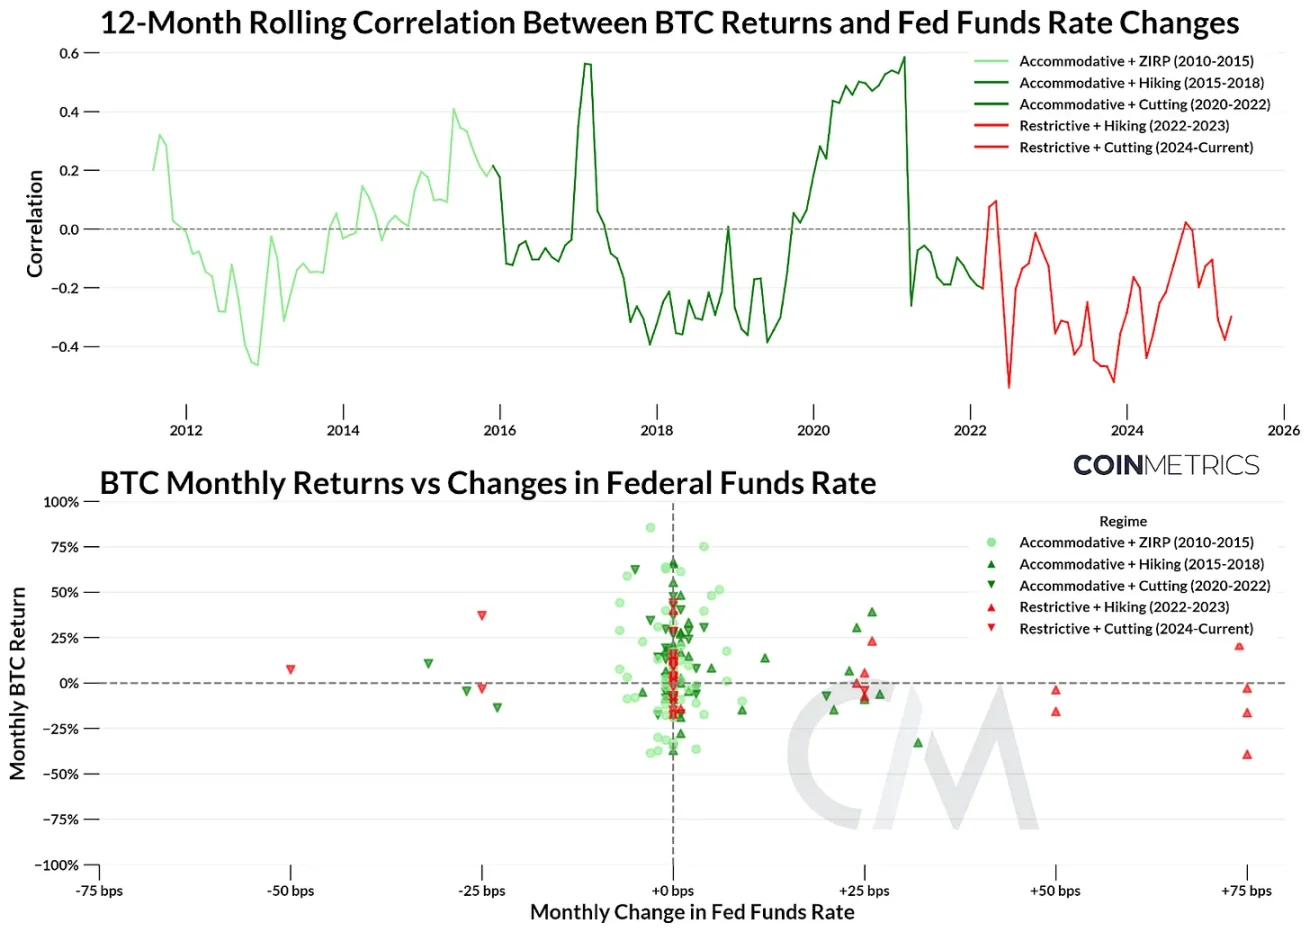
数据来源:Coin Metrics 和纽约联邦储备银行
虽然比特币与利率变化的相关性总体较低,且集中在中间水平附近,但在政策制度发生转变时,仍出现了一些明显的模式:
-
宽松政策 + 零利率(2010 年 - 2015 年):在 2008 年金融危机后的零利率政策推动下,比特币实现了最高的回报率。比特币与利率的相关性大致呈中性,这与比特币的早期增长阶段相吻合。
-
宽松政策 + 加息(2015 年 - 2018 年):随着美联储开始将利率提高至接近 2%,比特币的回报率出现了上下波动。虽然在 2017 年相关性有所飙升,但总体上仍保持在较低水平,这表明比特币与宏观政策存在一定的脱节。
-
宽松政策 + 降息(2018 年 - 2022 年):为应对新冠疫情,这一时期开始了激进的降息和财政刺激措施,随后是两年的接近零利率时期。比特币的回报率变化很大,但偏向于正向。在这一时期,相关性出现了大幅波动,从 2019 年的低于 - 0.3 上升到 2021 年的 + 0.59,之后又回到接近中性的水平。
-
紧缩政策 + 加息(2022 年 - 2023 年):为了应对飙升的通货膨胀,美联储实施了其最快的加息周期之一,将联邦基金利率推高至 5% 以上。在这一制度下,比特币与利率变化之间呈现出较强的负相关性。在避险情绪的影响下,比特币的表现疲弱,特别是叠加上加密货币领域特有的冲击,如 2022 年 11 月 FTX 的倒闭。
-
紧缩政策 + 降息(2023 年 - 至今):随着三次高位降息的完成,我们看到比特币的表现从中性到适度正向。这一时期还出现了一些催化因素,如美国总统选举,以及贸易战等冲击事件,这些因素继续影响着比特币的表现。相关性仍然为负,但似乎逐渐接近 0,这表明随着宏观经济条件开始缓和,比特币正处于一个过渡阶段。
虽然利率决定了市场背景,但通过比较比特币与股票和黄金的关系,可以更好地揭示它相对于主要资产类别的表现。
比特币回报率与黄金和股票的关系
相关性
要判断一种资产是否与另一种资产脱钩,最直接的方法是查看回报率之间的相关性。下面是比特币与标准普尔 500 指数和黄金之间 90 天回报率相关性的图表。
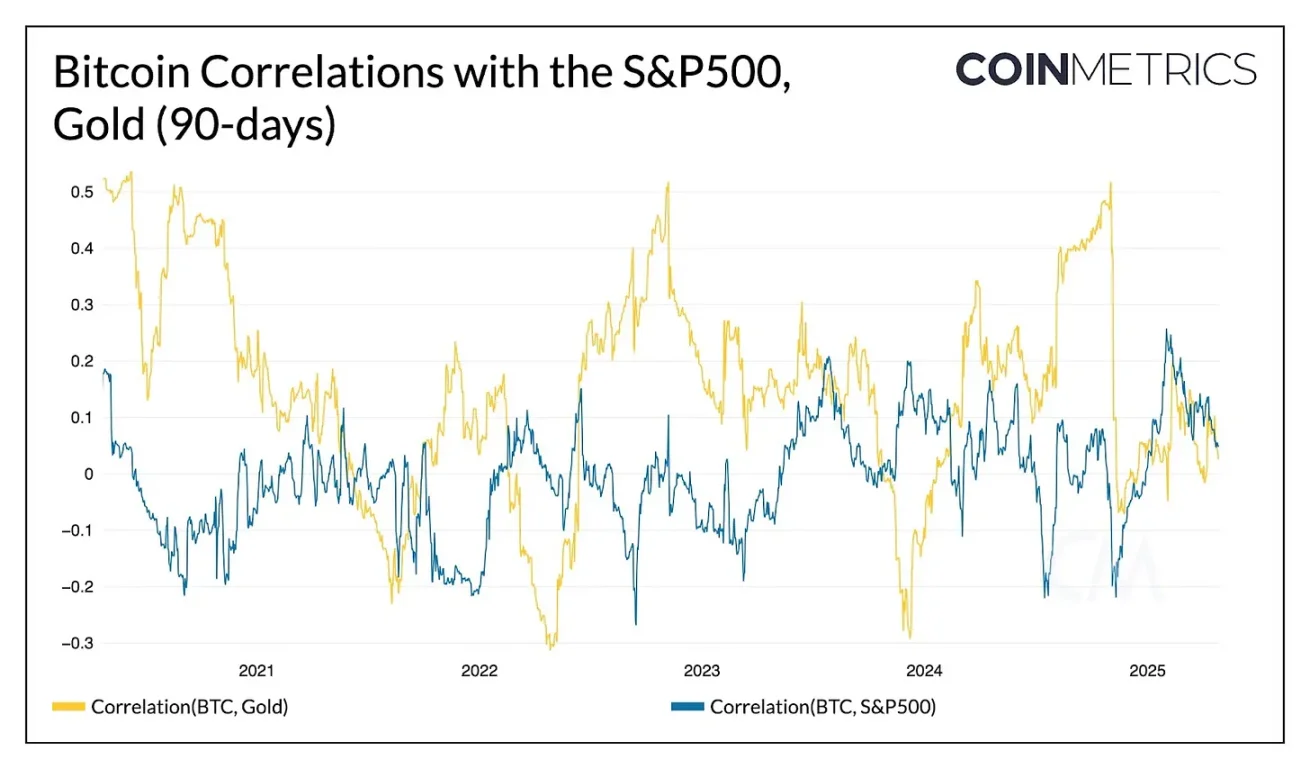
数据来源:Coin Metrics
确实,我们看到比特币与黄金和股票的相关性在历史上都处于较低水平。通常情况下,比特币的回报率会在与黄金或股票的相关性之间波动,与黄金的相关性一般更高。值得注意的是,随着市场情绪升温,比特币与标准普尔 500 指数的相关性在 2025 年有所上升。但从 2025 年 2 月左右开始,比特币与黄金和股票的相关性都趋向于零,这表明比特币正处于一个与黄金和股票 「脱钩」 的独特阶段。自 2021 年末上一个周期的高峰期以来,这种情况还未曾出现过。
当相关性如此之低时,通常会发生什么呢?我们整理了比特币与标准普尔 500 指数和黄金的滚动 90 天相关性低于显著阈值(约 0.15)的时间段,并标注了当时最值得关注的事件。
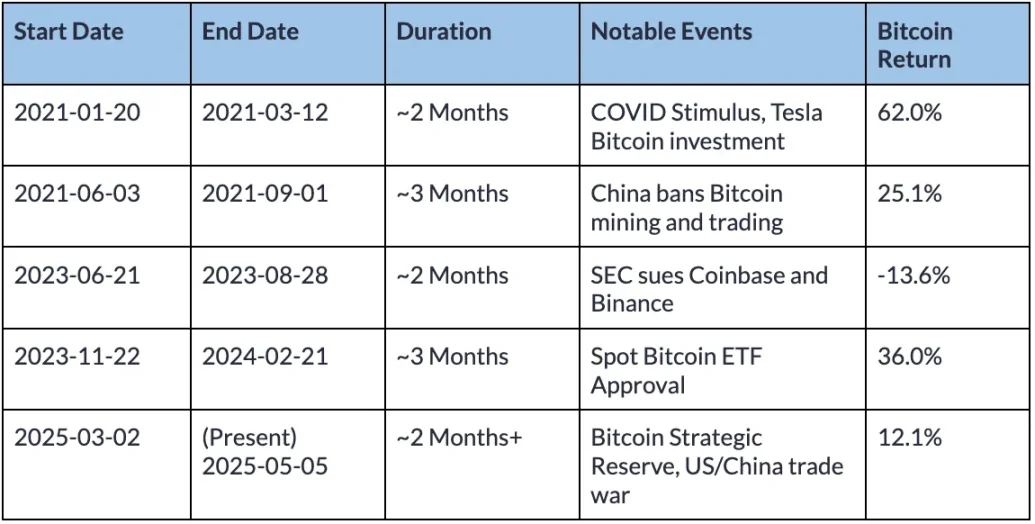
比特币与标准普尔 500 指数的低相关性时期
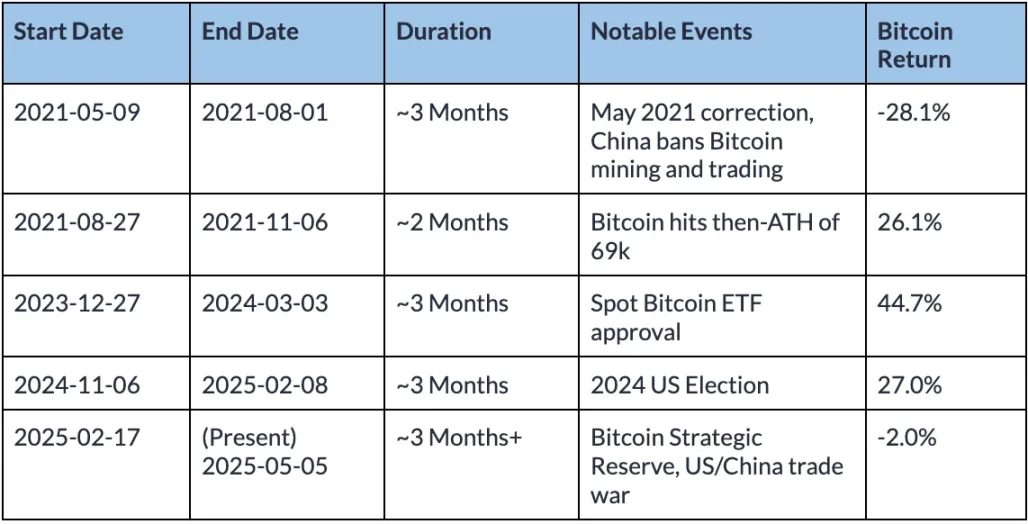
比特币与黄金的低相关性时期
不出所料,过去比特币与其他资产的脱钩情况发生在加密货币市场出现重大冲击的特殊时期,比如中国对比特币的禁令以及比特币现货 ETF 的获批。从历史上看,低相关性时期通常持续 2 到 3 个月左右,不过这取决于你所设定的相关性阈值。
这些时期确实伴随着适度的正回报率,但鉴于每个时期都有其独特之处,在对比特币近期的表现得出任何结论之前,请仔细思考这些时期的独特之处。话虽如此,对于希望在风险分散型投资组合中大量配置比特币而言,比特币近期与其他资产的低相关性是一个理想的特性。
市场 beta 系数
除了相关性之外,市场 beta 系数是另一个衡量资产回报率与市场回报率之间关系的有用指标。市场 beta 系数量化了一种资产的回报率预期会随着市场回报率变动的程度,其计算方法是资产回报率减去无风险利率相对于某个基准的敏感度。相关性衡量的是一种资产与基准回报率之间线性关系的方向和强度,而市场 beta 系数衡量的是一种资产对市场波动的敏感度的方向和幅度。
例如,人们常说比特币相对于股票市场的交易具有 「高 beta 系数」。具体来说,如果一种资产(如比特币)的市场 beta 系数为 1.5,那么当市场基准资产(标准普尔 500 指数)变动 1% 时,预计该资产的回报率将变动 1.5%。负 beta 系数意味着当基准资产的回报率为正时,该资产的回报率为负。
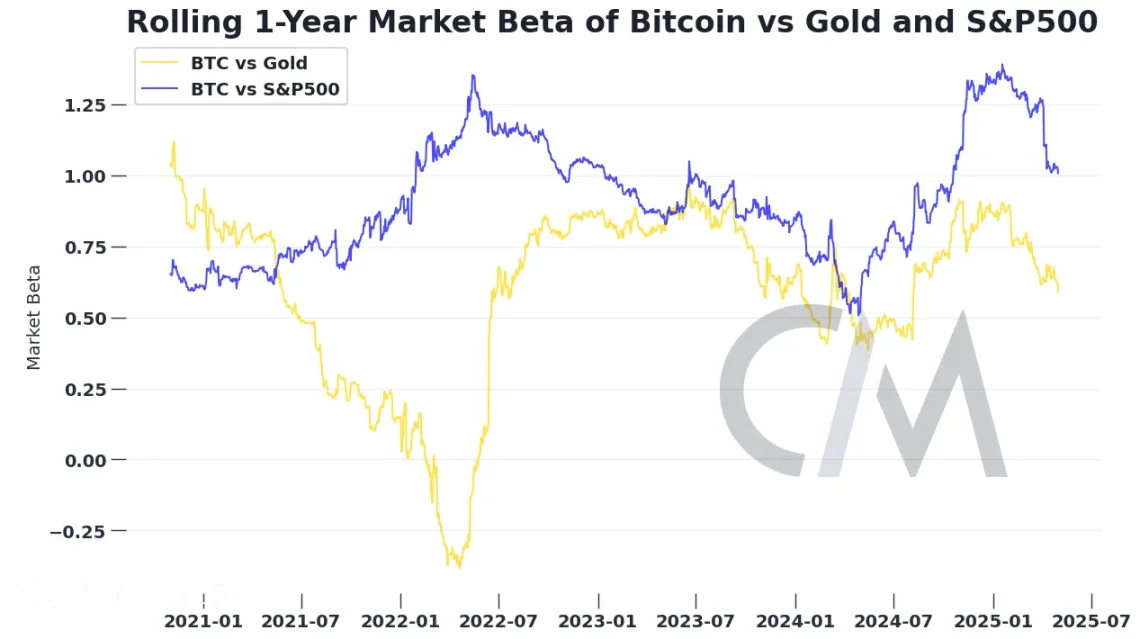
在 2024 年的大部分时间里,比特币相对于标准普尔 500 指数的 beta 系数远高于 1,这意味着它对股票市场的波动高度敏感。在乐观的、风险偏好较高的市场环境中,持有一定比例比特币的投资者相比于仅持有标准普尔 500 指数的投资者,获得了更高的回报。尽管比特币常被贴上 「数字黄金」 的标签,但其相对于实物黄金的低 beta 系数表明,同时持有这两种资产可以对冲各自资产的下行风险。
随着我们进入 2025 年,比特币相对于标准普尔 500 指数和黄金的 beta 系数开始下降。尽管对比特币对这些资产的依赖程度正在降低,比特币仍然对市场风险敏感,其回报率也仍然与市场回报率相关。比特币可能正在成为一种独特的资产类别,但它的交易方式在很大程度上仍类似于风险偏好资产,目前还没有强有力的证据表明它已经成为一种 「避险资产」。
高波动时期的比特币表现
已实现波动率为理解比特币的风险特征提供了另一个维度,它衡量了比特币价格在一段时间内的波动幅度。波动率常被认为是比特币的核心特征之一,既是风险的驱动因素,也是回报的来源。下面的图表对比了比特币的 180 天滚动已实现波动率与纳斯达克指数、标准普尔 500 指数以及一些科技股等主要指数的波动率。
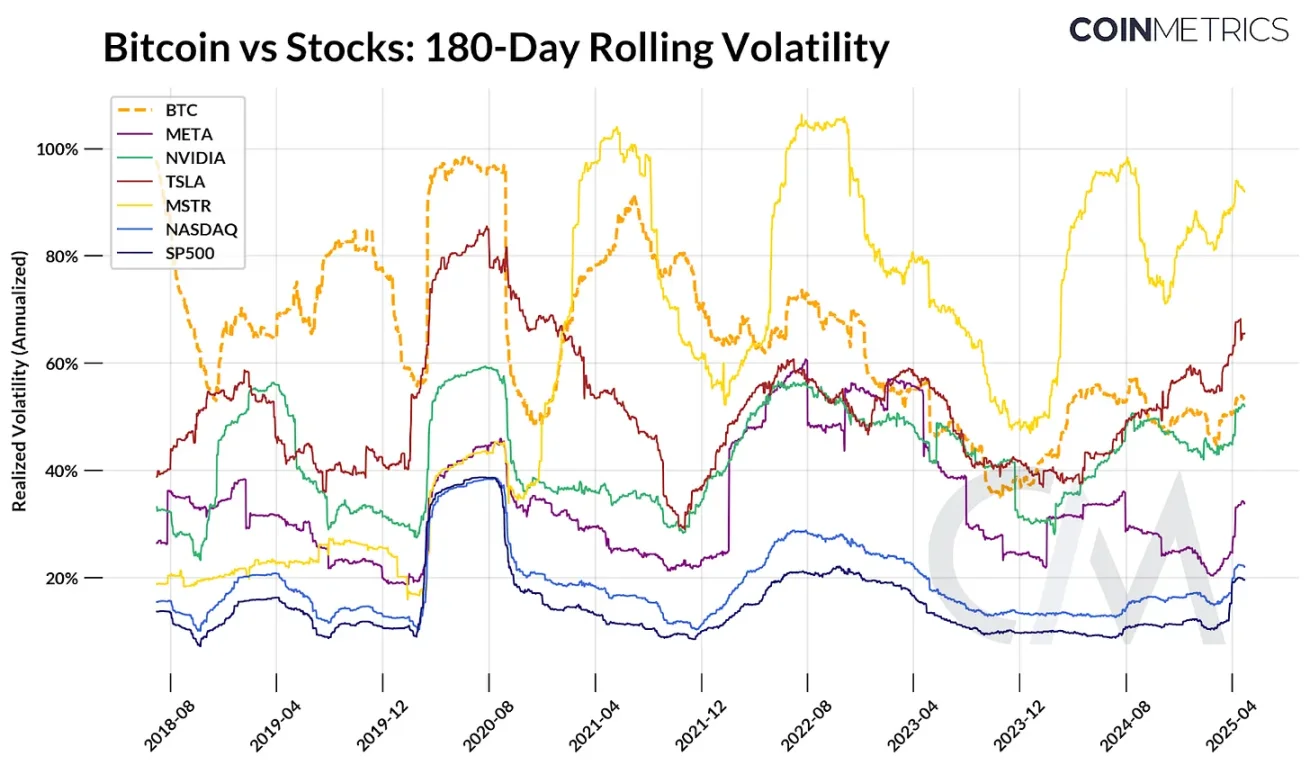
数据来源:Coin Metrics 和谷歌财经
随着时间的推移,比特币的波动率呈下降趋势。在比特币早期阶段,受价格大幅上涨和回调周期的驱动,其已实现波动率经常超过 80%-100%。在新冠疫情期间,比特币的波动率与股票波动率一同上升,并且在 2021 年和 2022 年的一些时期,受 Luna 和 FTX 倒闭等加密货币领域特有的冲击影响,其波动率也独立上升。
然而,自 2021 年以来,比特币的 180 天已实现波动率逐渐下降,最近即使在市场波动率较高的情况下,也稳定在 50%-60% 左右。这使其波动率与许多广受欢迎的科技股相当,低于 MicroStrategy(MSTR)和特斯拉(TSLA),而与英伟达(NVIDIA)的波动率非常接近。尽管比特币仍然容易受到短期市场波动的影响,但与过去的周期相比,其相对稳定性可能反映了它作为一种资产的成熟度。
结论
比特币是否已经与市场其他部分脱钩了呢?这取决于你如何衡量。比特币并非完全不受现实世界的影响。它仍然受制于影响所有资产的市场力量:利率、特定的市场事件,以及其他金融资产的回报率。最近,我们看到比特币的回报率与市场其他部分的相关性消失了,但这是一个暂时的趋势,还是长期市场变化的一部分,仍有待观察。
比特币是否已经脱钩引出了一个更大的问题:在一个试图分散风险的投资组合中,比特币能发挥什么作用呢?比特币的风险和回报特征可能会让投资者感到困惑,一周它可能像是高杠杆化的纳斯达克指数,另一周又像是数字黄金,再一周又成为了对冲法定货币贬值的工具。但也许这种波动性是一个特点,而非缺陷。与其将比特币与其他资产进行不完美的类比,更有建设性的做法是理解为什么随着比特币逐渐发展成为一种独特的资产类别,它会走出自己的行情。
免责声明:本文章仅代表作者个人观点,不代表本平台的立场和观点。本文章仅供信息分享,不构成对任何人的任何投资建议。用户与作者之间的任何争议,与本平台无关。如网页中刊载的文章或图片涉及侵权,请提供相关的权利证明和身份证明发送邮件到support@aicoin.com,本平台相关工作人员将会进行核查。


