作者: 0xWeilan
本报告所提及市场、项目、币种等信息、观点及判断,仅供参考,不构成任何投资建议。
在3月报告中,我们提示“反者道之动”并指出“杀跌与恐慌已得到最大程度的释放”,“Q2将迎来反转行情”。最终,4月BTC迎来猛烈反弹,单月劲升14.11%,收复“关税战”以来所有跌幅。
主导全球金融市场走势的“对等关税战”在4月正式开打,对市场形成猛烈冲击,恐慌情绪飙升,资产价格大幅下修。但情绪释放之后,伴随特朗普“软化”及相对韧性的美国经济及就业数据的发布,抢筹资金涌入美股和加密市场。
BTC先于美股调整,同步美股完成探底之后,在百亿抢筹资金驱动下涨势逼人。更重要的是经过2个多月的调整,筹码结构得到极大改善,内部状态更加稳定。
标普500及加密市场市场已经全部收复“对等关税战”以来的所有跌幅。相对尚未收场的“关税战”和美国经济是否衰退的悬而未决,市场走势非常强劲,不断对各类最新信息完成定价。然而,市场要就此实现反转,仍需“关税战”步入第三阶段(达成协议)及美国经济数据的确认。中间,料将颇多波折。
宏观金融:“对等关税战”预期交易引发市场剧烈修订
在3月报告中我们提到,“新的交易判断框架在2月底初步确立,整个3月都围绕不断发布的各类经济、就业和利率数据输入这个判断框架后的产出进行”。4月则在此基础上继续演化,其中特朗普在“对等关税战”上的表态和行动的“软化”起到主要作用。叠加4月发布的经济和就业数据表现相对强劲,交易者弱化了对于“经济衰退”的担忧,最终在月度修订行情告一段落之后,押注关税战不会导致经济衰退的前瞻性交易主导了市场走势。先跌后涨的纳指和BTC均录得月度正收益。
4月2日特朗普宣布国家紧急状态,启动对等关税;4月3日对全球商品加征10%关税,对中国商品加征104%关税。商务部长卢特尼克和财政部长贝森特强调与盟友合作对抗中国。
4月3日至5日,美股恐慌性下跌,三大股指均跌破年线,标普500跌至2024年1月点数。特斯拉、英伟达等高估值股票被腰斩。长端和短端美债均大幅下跌,交易者抛售股票避入债市和欧股。周末,全美出现大规模抗议游行。
4月7日周一,标普500 VIX指数突破60。市场抛售潮进入第二阶段,美债遭大举抛售。9日关税正式实施,2年期美债收益率升超4%,11日10年期美债收益率接近4.6%。21日,抛售蔓延至汇市,美元指数跌至97.911,超过去年Carry Trade崩溃时的低点。纳指跌入技术性熊市。
特朗普超出预期的“对等关税”、对金融市场下跌的漠视和中国政府的强硬反击,推动美国股债汇出现“三杀”的惨烈局面。这一局面引发了市场更大恐慌,来自企业和金融界的批评与抗议沸反盈天,而且动摇了市场的根本信心,特朗普被迫做出让步。
首先,对除中国以外的所有国家暂停90天关税,以缓解与盟友的紧张关系并争取更多谈判时间。4月23日,有报道称特朗普政府可能大幅削减对中国商品的104%高额关税,甚至减半以上,以缓和与中国的紧张关系。期间,特朗普强调一直在与中国政府进行接触,但中国政府否认了这一点。
黄金成为唯一赢家,自9日起迎来一轮强劲上涨,由2970美元/盎司最高升至3499.93(4月22日)。但自23日,消息称特朗普考虑削减中国商品的高额关税后,进入持续调整,及至月底跌至3288.54美元/盎司。但单月仍录得5.08%的大幅上涨。
美股暂时在4月4日触底之后强劲反弹,23日特朗普“软化”之后反弹得以继续,及至本报告完成时间(5月2日)纳指和标普500已将关税战导致的跌幅完全收复。
全月来看,纳指4月升0.85%,标普500跌0.76%,道琼斯跌3.17%,BTC劲升14.11%。
在此过程中,虽然市场一度下注美联储会启动临时降息,并预计5月降息概率超过80%,但美联储始终保持了强硬态度,只在股债汇“三杀”之际再次强调如果就业市场出现意外将会出手干预市场,释放少许“鸽派”信息。
4月10日美国劳工统计局发布数据,得益于能源价格下跌,3月CPI(消费者价格指数)环比下降0.1%(季调后),为近五年来首次月度下降,低于市场预期0.1%的涨幅。年化CPI增长率从2月2.8%降至2.4%(未季调)。核心CPI(剔除食品和能源)环比增长0.1%(低于预期0.2%),年化增长2.8%,为2021年3月以来最低。
4月30日,美国经济分析局发布第一季度初步估计,实际GDP年化季率下降0.3%,创2022年第二季度以来最低水平,远低于2024年第四季度2.4%的增长率,也低于市场预期的0.4%(Dow Jones共识预测)或0.3%(华尔街日报4月12日调查中值)。
5月2日,劳工统计局(BLS)发布4月非农就业报告,非农就业人数增加17.7万,高于Dow Jones预期13.3万,但低于3月修正后的18.5万(2月和3月数据下修5.8万)。过去六个月平均每月新增19.3万个岗位,显示劳动力市场仍具韧性。4月失业率维持在4.187%(3月为4.152%),符合预期,劳动力参与率略有上升,表明市场相对稳健。平均时薪环比增长0.2%(低于预期0.3%),年化增长3.8%(低于预期3.9%),显示工资压力温和。
通胀数据出现降温,且就业数据仍然强劲。这暂时降低了市场对于经济衰退的忧虑,叠加特朗普的“软化”,尽管关税战仍在第二阶段(“谈判”)艰难进行,但来自散户和主动型基金的资金启动前瞻性交易,大举买入推动美股强劲反弹。
EMC Labs认为,中短期关税战所引发的恐慌已经得到相对充分的释放,而GDP数据表明至少现在美国经济仍未遭受较大破坏,加上特朗普团队似乎正在由“失控”回归“理性”,这是前瞻性资金敢于大举买入的原因。我们倾向于,2-4月的调整为连涨2年估值过高的美股在“关税战”冲击下的一次剧烈调整,对熊市的一次技术性试探,但还没有数据充分表明美国经济将出现衰退。目前美股估值得到一定下杀,但亦不便宜,市场定价已经相对充分,如果继续向上需要有更多条件支持,如 “关税战”进一步缓和,CPI进一步下降。而降息方面并不乐观,CME FedWatch显示 ,市场对于降息的预期已经延后至7月。在大幅反弹后,我们倾向于中性判断,需密切关注关税战进展及经济数据,如果出现经济恶化趋势出现,恐将再现下修。
加密资产:稳固筹码结构+长期
月初崩溃式下跌,月底已大幅反弹。4月BTC走势是“反向交易”的典范,在恐惧情绪中买入等待时态缓和时资产价格的迅速反弹。
4月BTC开于82534.31美元,最低跌至74420.69美元,收于94182.54美元,全月上涨14.11%计11648.22美元,月振幅高达26.12%。
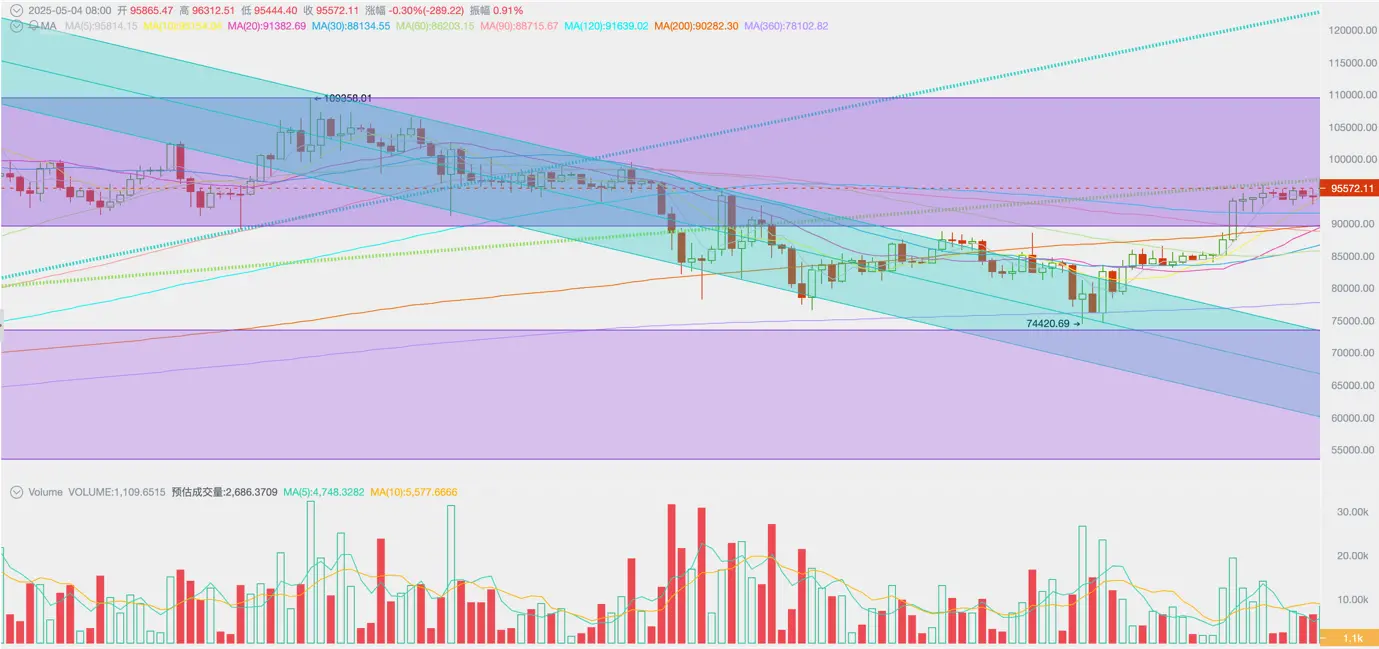
BTC价格日线走势
全月走势呈先跌后涨,最低点出现在4月7日“黑色星期一”,及至“对等关税”正式实施之后,触底回升逐步上涨。以日内涨跌计算,30个交易日中上涨日远高于下跌日。
技术上,BTC在联动美股的暴跌中3次回踩年线完成了长期趋势的确认,并在4月22日以6.82%的大涨强势突破200日线,重新回到“特朗普底”(特朗普获胜后所构筑的箱体结构)并逼近本轮牛市的“第一上升趋势线”(上图绿色点线)。
相比美股,BTC走势非常强劲,这得益于价格回调在3月即已展开,长期持有者和大户群体的增持,以及政策与用例层面的利好支撑。
自3月特朗普签署行政令,建立“战略比特币储备”后,美国多州持续推进各自的“比特币储备法案”。4月30日,亚利桑那州众议院通过了两项比特币储备法案,目前正等待州长签署。如法案生效,亚利桑那州将成为美国首个允许州财政持有比特币的州。亚利桑那州法案一旦正式生效,相信各州的推进速度亦会加快。
BTC的用例拓展和价格上升正处于相互加强的持续反馈过程中。3-4月,特朗普关税战引发的全球金融市场的动荡和再修订暂时打断了这一过程。但加密市场内部持币结构和市场运动保持完整和平稳,一旦恐慌情绪消退,BTC即会重拾升势。后市随关税战和宏观金融的潜在动荡,BTC价格仍会有波折,突破前高有待关税战尘埃落定且美国经济不至跌入衰退地步。
筹码结构:长手、鲨鱼增持,长线买家扫货
2024年10月4日,伴随资金凶猛涌入市场,长手群体启动了本轮周期的第二拨抛售。旺盛的资金流入在吸收抛压之后,继续将价格推升至接近11万美元。
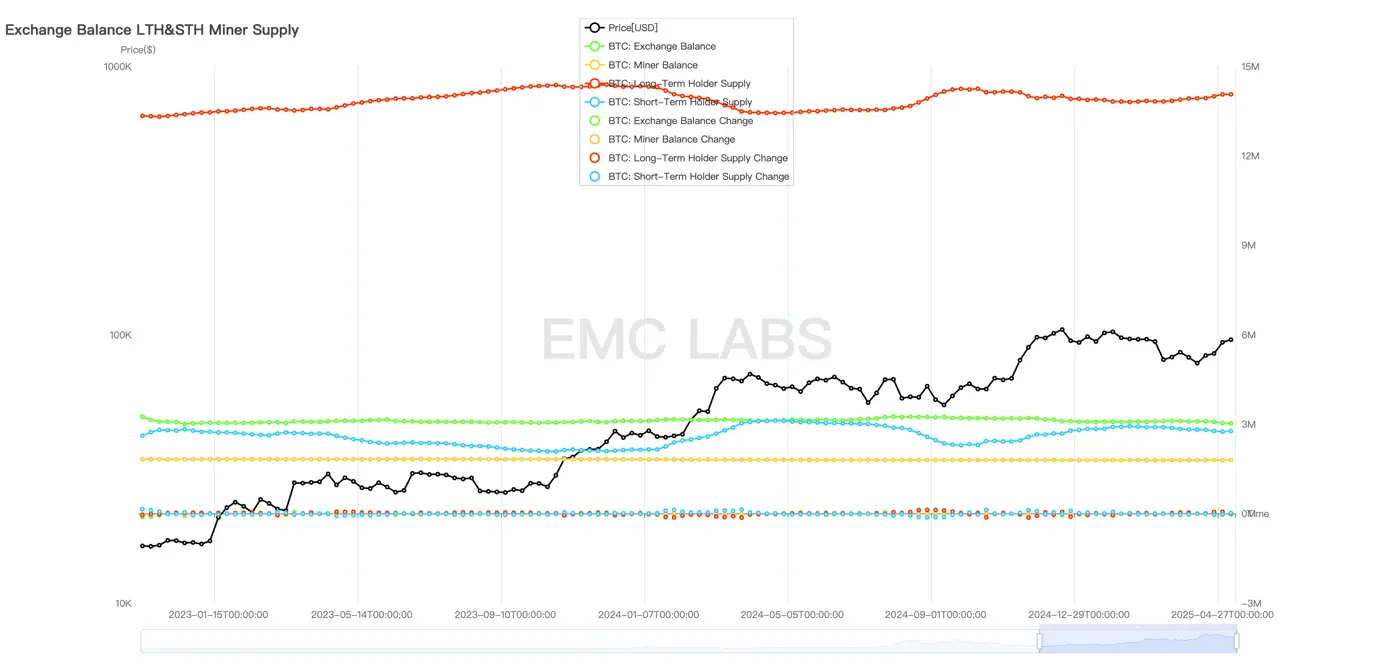
长手、短手和交易所持有BTC规模
进入3月之后,伴随流动性丧失BTC价格大幅下跌,此后长手群体再次发挥“稳定器”作用,由抛售转为增持。
此外持有量介于100-1000 枚BTC区间的大户群体之一——鲨鱼,亦于下跌过程中持续增持,并在4月下旬加速扫货,全月加仓超过8万枚,成为力挽狂澜的中坚力量。值得注意的是,这一群体也是2024年10-12月BTC价格由7万美元拉升至10万美元区间的主要买家。基于这一群体在本周期扫货规模远超抛货规模的特性,可以判断这一群体的行为符合长期投资者特征,其对这一价格区间的认可有助于价格的稳定。
在各方买家扫货之后,交易所BTC存量在4月减少了6万枚左右。
2月下旬价格启动下跌,至4月底价格重新回到2月下旬的价格。伴随市场波动,筹码充分交换,对比1月31日和4月30日的来你上筹码分布,可以看到7.4-10万美元区间的筹码重心出现了显著下移,部分标价为10万美元以上的筹码下移至7.4-9.4万区间。
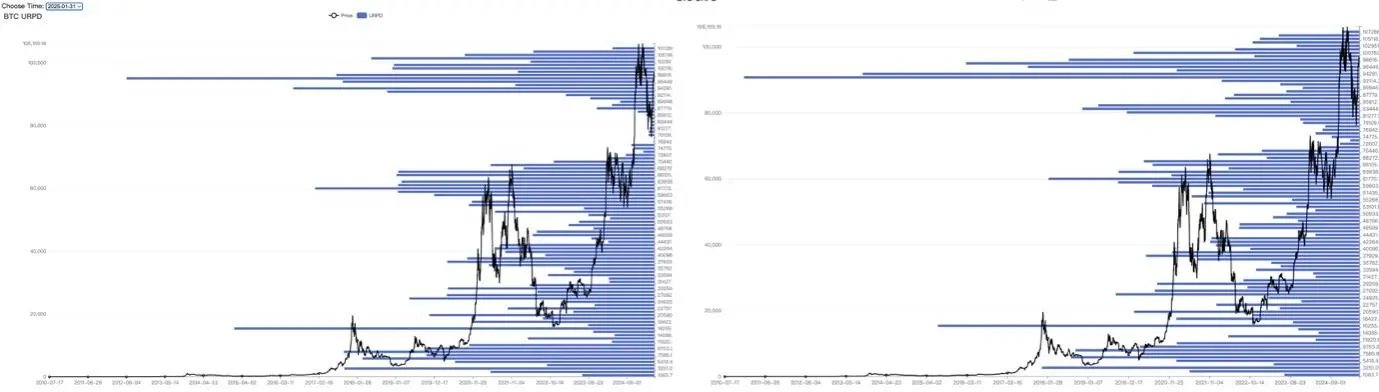
BTC筹码分布(1月31日 vs 4月30日)
过去两月的市场震荡,从筹码分布角度来看便是FOMO新入场的筹码在猛烈下跌中被迫抛售,而过去7.4-9.4区间筹码不足的情况得到了重新填补。据eMerge Engine数据显示,目前短手持仓已经脱离浮亏,而全链处于浮亏状态的BTC也跌至14%。恐慌和亏损引发的市场抛压已大为改善。
资金:力挽狂澜,超百亿资金抢筹
以月中为界,在“关税战”和宏观金融恐慌情绪压迫之下,上半月资金整体呈流出态势,但稳定币资金进入4月以来持续流入,及至月中伴随特朗普“软化”及美股企稳反弹,BTC Spot ETF通道资金亦开始抢筹,将BTC价格迅速推高至94000美元之上。
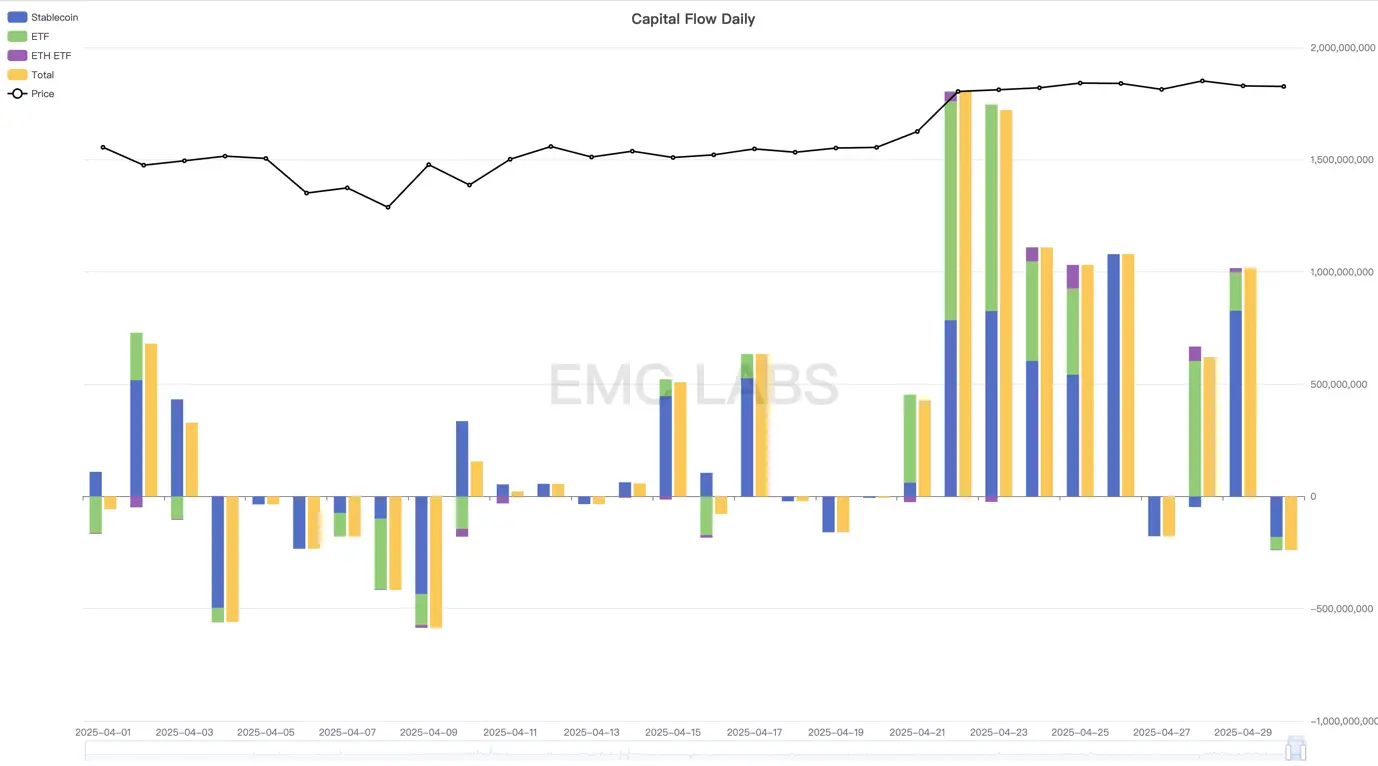
加密市场资金流入流出统计(日)
以月度视角来看,二三月掌握短线定价权的ETF通道资金呈流出态势推动BTC价格下行,而四月整体资金流入高达84亿美元,成为本周期以来的第六大流入月。
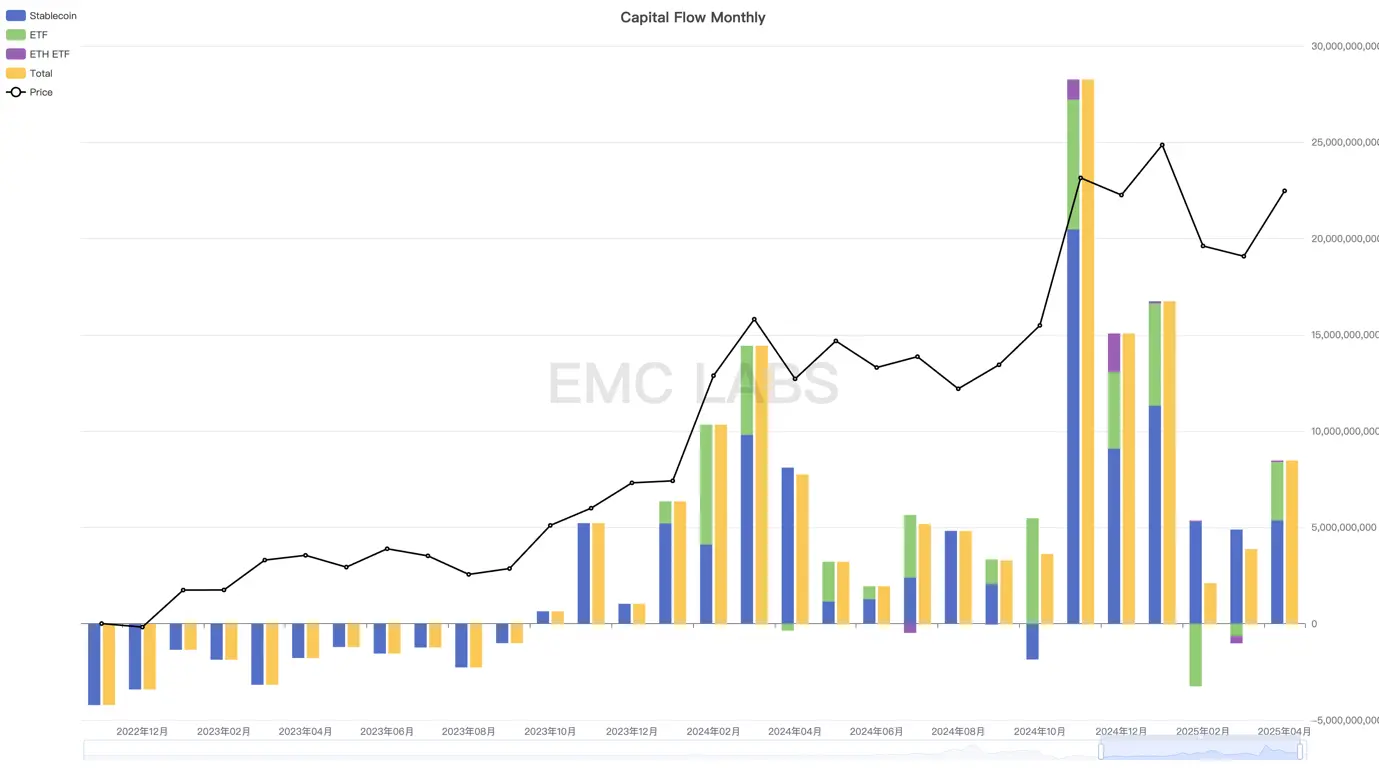
加密市场资金流入流出统计(月)
如上统计并未包含Strategy公司的加仓数据,据其公告,Strategy公司在4月通过募资进行了3次加仓,总计购入25370枚BTC,投入超22亿美元。如是,4月全市场流入资金规模超过百亿美元。
BTC的价格走势是资金流入流出的市场呈现。目前可统计的资金流入分三类,一类是BTC Spot ETF通道资金,往往跟随美股波动;一类是Strategy公司的募资,其流入持续性较好;一类是稳定币通道资金,亦即场内资金,自2023年10月呈流入以来,仅有一个月净流出,其他月份均呈正流入(稳定币资金并非全部流入加密市场)。
虽然2-4月,加密市场发生了剧烈波动,技术上一度跌入熊市,但综合资金和长手派筹趋势分析,我们认为市场周期依然运行于上升期亦即牛市。EMC Labs认为,在调整后,筹码重回长手和大户群体,此次下修调整有助于筹码结构的加固,待到关税战冲击逐步消退,市场交易热情复燃,BTC价格将大概率再次向上突破。
结语
3月报告中,我们指出“经历一季度的疾风骤雨,第二个季度前景仍然不够明朗,但可能最痛苦的时刻已经过去,待到华府和美联储恢复到理性博弈状态,市场应该便可回到自身运行规律中去”。
4月,市场表现初步证明了这一判断,背后是特朗普“软化”和美国经济数据的相对坚挺。
经过数月的市场调整和筹码再分配,加密市场内部更加稳固,长手持有更多筹码,短手浮亏压力消除,且浮盈尚未出现,仅有14%的比特币处于浮亏状态。这种内部状态为市场上行提供了坚实支撑。
但市场外部尤其是“对等关税战”的不确定性非常之大,此外“对等关税战”可能引发的美国经济衰退与通胀再上行,可能会引发美股估值再次下修,以及美联储降息的再延后。这一点尤其需要注意。
市场走势是动态条件下交易各方动态博弈的合力结果。我们对BTC下半年及长期走势充满信心,但需警惕“对等关税战”对资金、情绪和全球经济的不可预测的破坏。
免责声明:本文章仅代表作者个人观点,不代表本平台的立场和观点。本文章仅供信息分享,不构成对任何人的任何投资建议。用户与作者之间的任何争议,与本平台无关。如网页中刊载的文章或图片涉及侵权,请提供相关的权利证明和身份证明发送邮件到support@aicoin.com,本平台相关工作人员将会进行核查。


