Source of the article: https://insights.glassnode.com
Original authors: CryptoVizArt, Glassnode
Proofreading: Akechi, Edward
Layout: Edward
Review: Amber
Abstract
- Since Bitcoin hit a historical high of $73,000 in March, the Bitcoin market has transformed into a widespread net distribution pattern, under which Bitcoin has fully demonstrated its liquidity and perfectly adapted to the new demand entering the market.
- According to the NUPL indicator, the Bitcoin market is still in a cheerful phase in the current cycle. However, as the price has been consolidating, market sentiment has gradually cooled down.
- In this article, we will mention an example analysis process to identify potential turning points and local lows in the market driven by various subsets of short-term holders.
Distribution under Panic
Currently, the Bitcoin market continues to consolidate around $60,000, after reaching $73,000 in mid-March, with its price remaining restricted within this range. In this issue, we will evaluate whether investors are more inclined to distribute their assets or accumulate them during this consolidation period.
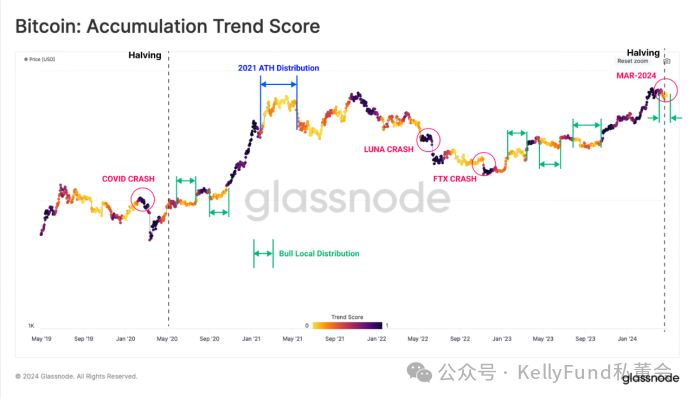
First, we will use the cumulative trend score to illustrate how the pattern of investors accumulating their assets since the FTX crash has shaped local market tops and bottoms.
In the early stages of the 2020-21 and 2023-24 bull markets, we can see the overlap between local distribution areas (light-colored) and price contraction ranges. However, as the market price rebounds to new highs, selling pressure on assets will be rekindled, as price changes prompt investors to bring dormant supply back to the market to meet new inflows.
With Bitcoin's spot price reaching a new high in mid-March, the same local distribution pattern appeared in the market, and as the Middle East conflict escalated, this distribution pattern was further reinforced, leading to a pullback in the Bitcoin price to $60,300.
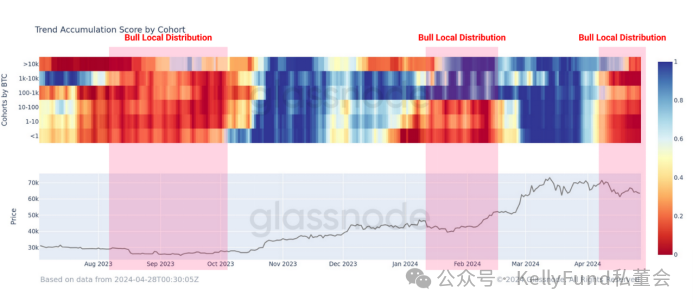
If we review the sub-indicators of the above indicators based on wallet size, our analysis will be more detailed. Here, we see a significant increase in net outflows for all groups in April, indicating a comprehensive pattern of selling pressure in the market.
Unrealized Net Profit & Return Cycle
A unique feature of the current bull market is the positive impact of the US spot ETF momentum on price trends. In the current market, the impact of ETFs on investor behavior can be explained by the Unrealized Net Profit/Loss (NUPL) indicator, which measures the size of the net book profit (or loss) of asset holders in the market after normalization by market value.
Through NUPL, we can identify the classic cheerful phase of the bull market, characterized by the fact that during this phase, unrealized profits exceed half of the market value (NUPL>0.5).
In the 2020-21 cycle, this phase was triggered 8.5 months after the Bitcoin halving and continued to drive the price upward for nearly 10.5 months. However, in this cycle, NUPL broke the 0.5 threshold about 6.5 months before the halving. This clear shift highlights the important fact that the US ETFs have shaped and accelerated the Bitcoin price trend by introducing strong demand to the market.
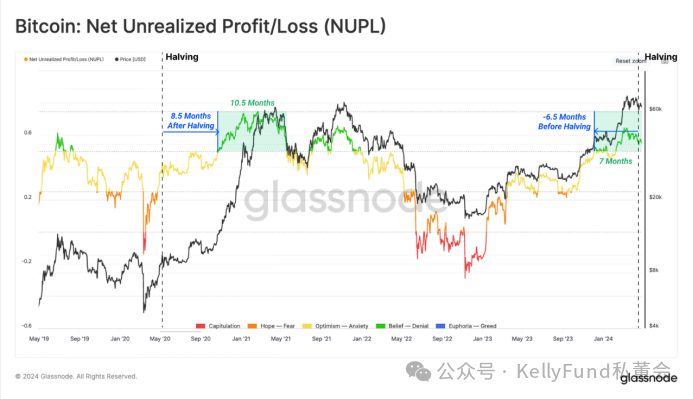
Based on this indicator, the cheerful phase of this bull market (NUPL>0.5) has lasted for 7 months. However, we know that even the strongest upward trend will experience adjustments, and the events during these adjustment periods will provide valuable information about investor positioning and sentiment.
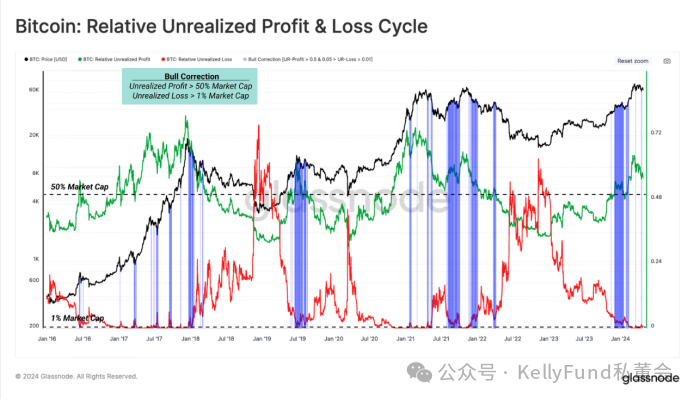
To gain a deeper understanding of the dynamics of this bull market adjustment, we will consider the following two conditions:
- Relative unrealized profit > 0.5, indicating a widespread book profit in the market.
- Relative unrealized loss > 0.01, implying that investors are currently facing significant financial pressure and are forced to hold a large amount of unrealized losses during the market adjustment.
As shown in the following figure, these adjustment events are common and expected in all bull markets. Since the price reached a historical high of $73,100, this structure has appeared in three independent retracement periods, until the current price returned to around $60,000.
Identifying Local Lows
After confirming that the current market is still in a cheerful range and anticipating a price adjustment, the focus of the next part of this report is to establish a "compass" to "navigate" the expected direction of the market when the market contracts.
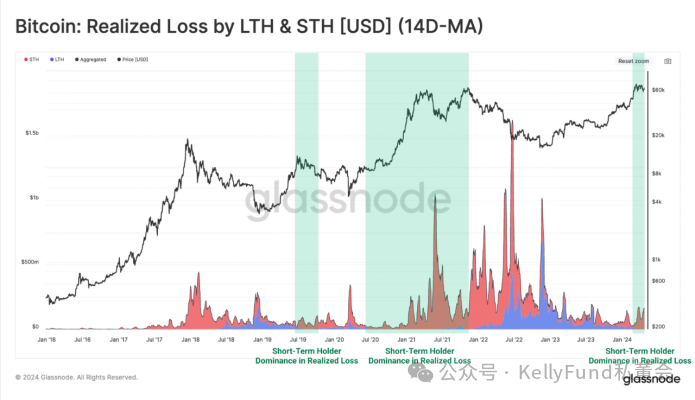
The first step is to identify the aggressive party in the market during the adjustment period, which we define as the group of investors contributing the most to the duration and depth of each pullback.
We can use realized losses as a sub-indicator (priced in USD) to determine that short-term holders (especially recent buyers) are showing a dominant position in the market.
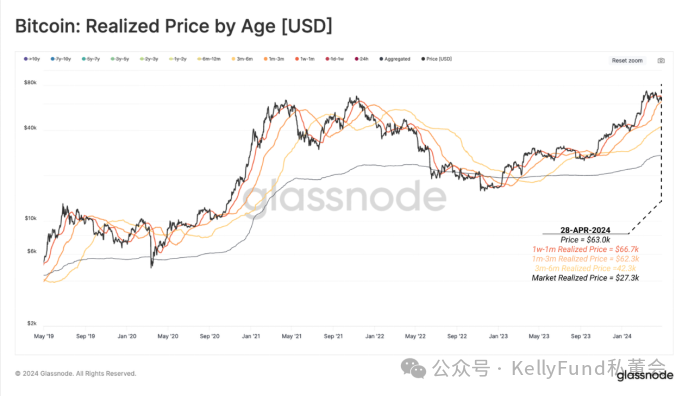
Given that the focus is on short-term holders currently in a loss position, we will use a new combination of sub-indicators to analyze the cost basis of these recent buyers.
The cost basis of the 1-3 month and 3-6 month holding groups among these relatively short-term holders (especially recent buyers) will be a valuable tool for distinguishing between bull and bear market structures. The cost basis of the 1 week-1 month holding group shows their current situation corresponding to potential local lows (in a bull market) and local highs (in a bear market), helping us discover potential turning points.
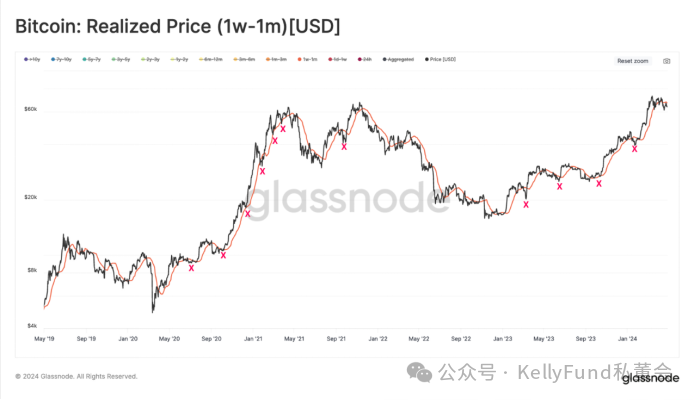
Spot prices often react to the cost basis of investors holding for 1 week to 1 month, an idea discussed in our recent research articles on the behavior analysis of short-term and long-term holders. The theoretical basis for this conclusion is that recent buyers are more sensitive to prices and are more likely to consume in the short term.
Therefore, during a bull market adjustment, as the market begins to sell off, short-term holders tend to increase their selling pace. When the market price approaches the cost basis of each subgroup, their selling speed is expected to slow down (exhaustion of selling pressure).
Here, we use the realized price (cost basis) of Bitcoin assets held by short-term holders with a holding period of 1 week to 1 month as a guide to identify potential exhaustion of selling pressure in the short term.
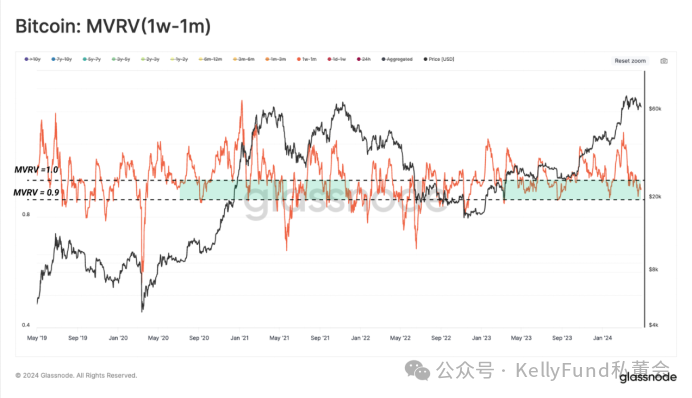
We can use the MVRV ratio to measure the typical statistical deviation between the spot price and the cost basis of each group during the price adjustment period.
The figure below shows that during bull market pullbacks, the MVRV ratio of investors holding for 1 week to 1 month usually falls within the range of 0.9-1. This means that for investors holding for 1 week to 1 month, their average cost basis typically decreases by 0%-10% during the market adjustment.
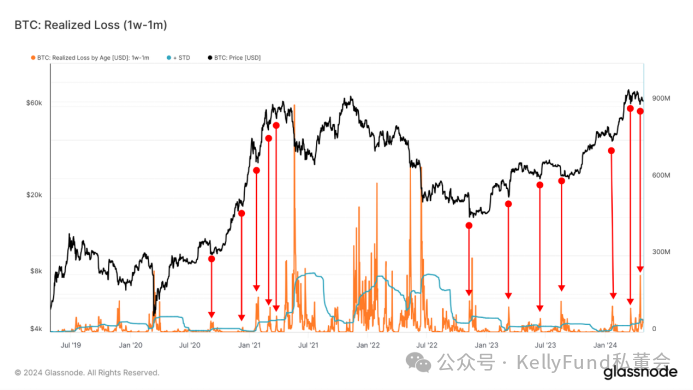
Now, after evaluating the hidden pressure faced by investors holding for 1 week to 1 month, we can directly track the level of panic exhibited by this group of investors through the "realized losses" indicator. Our approach is to analyze the aggressive selling pressure exerted by this group of investors on the market.
Here, we list the realized losses of recent 1 week to 1 month holders (priced in USD). Next, we will use some simple statistical methods (standard deviation > 1) to determine the higher range of realized losses.
It is worth noting that due to the recent price drop leading to panic selling of their held crypto assets, the realized losses of this group often peak at local market lows.
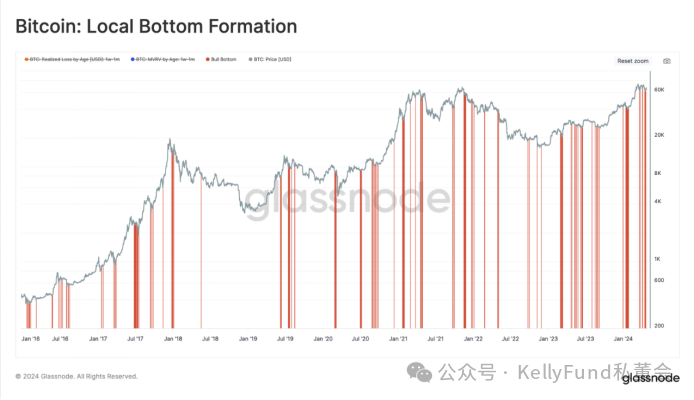
By combining the two conditions described above, we can derive a specific set of conditions to discover potential turning points for local lows:
- MVRV (1 week-1 month) is below 1, but above 0.9
- Realized losses (1 week-1 month) within a 90-day window exceed +1 standard deviation
These two conditions together form a compass that can help identify when short-term holders may be exhausted in selling pressure under certain market structures.
As of the writing of this article, the cost basis for short-term holders holding for 1 week to 1 month is $66,700, and since mid-March, their realized losses have exceeded the 90-day +1 standard deviation level multiple times. As the Bitcoin price is currently in the range of $60,000 to $66,700, it meets the conditions expressed by MVRV, and we can say that the market is now forming a local bottom. However, this also means that if the current MVRV level continues to decline, it may trigger a series of investor panics and ultimately force the market to seek and establish a new balance.
Summary
In this article, we are confident that since Bitcoin hit a historical high of $73,000 in March, the Bitcoin market has transformed into a widespread net distribution pattern. The NUPL indicator also indicates that the current Bitcoin market is in a cheerful phase, but it has clearly started to cool down since the price adjustment began.
The Bitcoin price adjustment has provided valuable information about investor sentiment and selling activity. From this, we have developed a standardized analysis method to identify the subset of short-term holders with the greatest impact on the market through maximum selling activity. Based on this, a new combination of sub-indicators has been developed to formulate some simple rules that may help determine that the exhaustion of selling pressure by this group is indeed a factor contributing to the current price being a local low.
免责声明:本文章仅代表作者个人观点,不代表本平台的立场和观点。本文章仅供信息分享,不构成对任何人的任何投资建议。用户与作者之间的任何争议,与本平台无关。如网页中刊载的文章或图片涉及侵权,请提供相关的权利证明和身份证明发送邮件到support@aicoin.com,本平台相关工作人员将会进行核查。


