Author: Mary Liu, BitpushNews
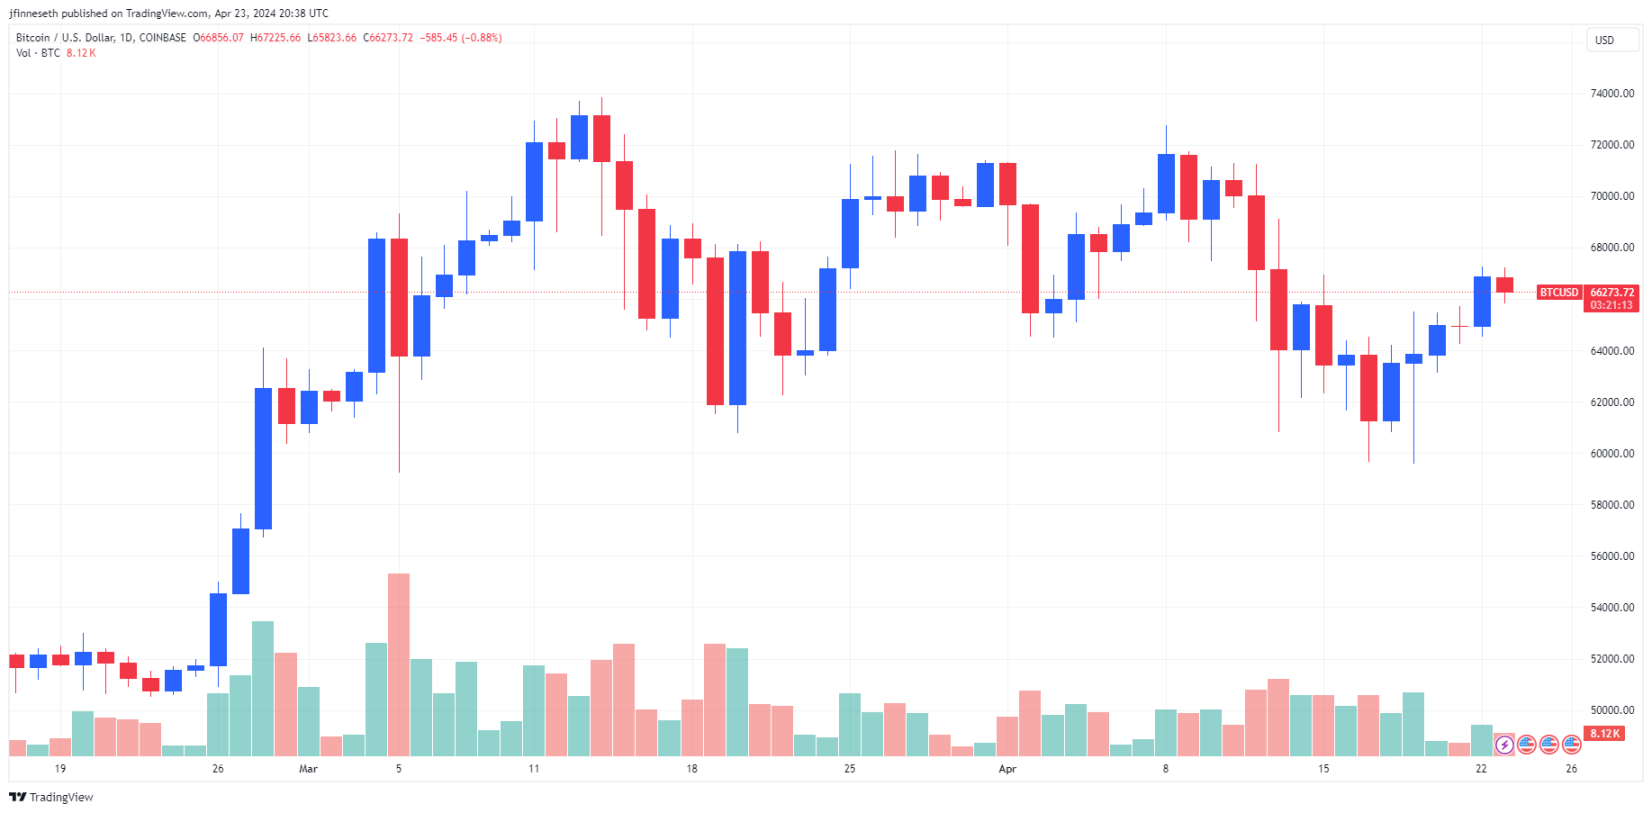
On Tuesday, the cryptocurrency market showed mixed performance, with both bullish and bearish forces of Bitcoin evenly matched after the halving event, and the trading price remained stable above $66,000.
The top 200 market cap altcoins experienced mixed gains and losses, with 7 tokens recording double-digit gains. Hedera (HBAR) led the gains, rising by 40.4%, followed by cat in a dogs world (MEW) with a 31.9% increase, and Akash Network with a 24.2% increase. Stablecoin project Ethena (ENA) experienced the largest decline, dropping by 7.7%, followed by Ontology (ONT) with a 7.6% decline, and Jito (JTO) with a 5.8% decline.
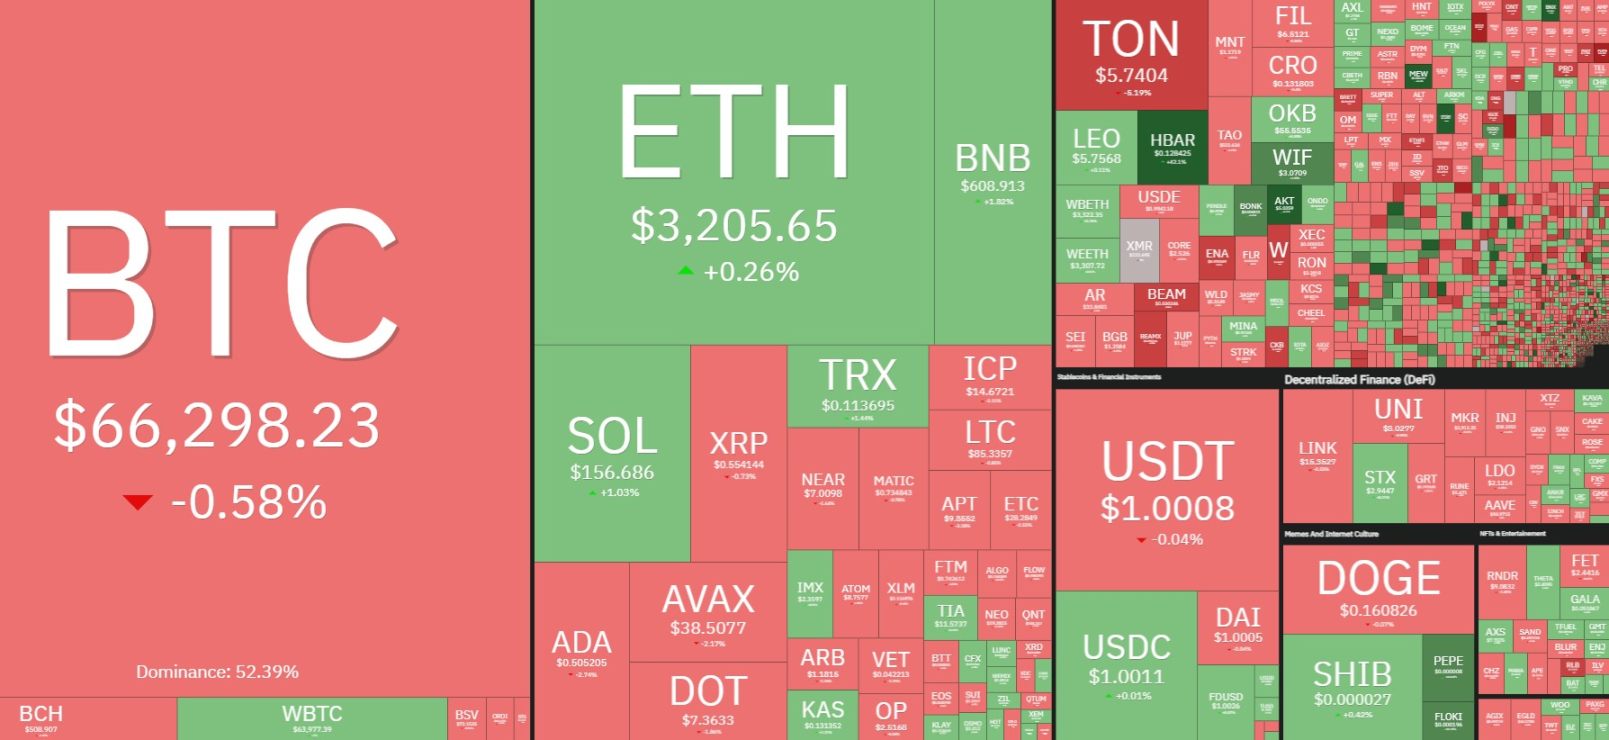
The overall cryptocurrency market cap is currently at $2.45 trillion, with Bitcoin's dominance at 53.4%.
At the close, the S&P, Dow, and Nasdaq indices all rose, increasing by 1.20%, 0.69%, and 1.59% respectively. The US dollar index fell by 0.4% on the day.
Bitcoin's 200-day Moving Average Nearing Historic High
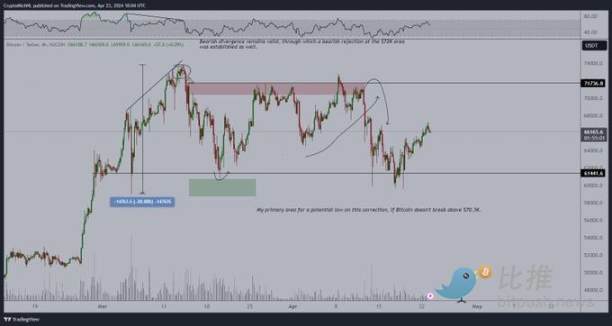
An analyst from Secure Digital Markets stated, "Bitcoin has recently rebounded from the uptrend line and is currently attempting to break through the short-term resistance level of around $67,500. The release of US manufacturing and service industry PMI data this morning stimulated the surge in risk assets."
The analyst also mentioned that Bitcoin's 200-day moving average (a key indicator of long-term trends) is approaching a historic high, challenging the peak of $49,452 set in February 2022. Historical data shows that after this indicator surpasses the previous peak, the most intense phase of the bull market cycle unfolds, leading to an increase in Bitcoin's price when the indicator reaches a new high.
In early November 2020, six months after the third halving, Bitcoin's 200-day moving average rose to over $10,320, the highest at that time. By mid-April 2021, Bitcoin had surged 4.5 times to reach $63,800.
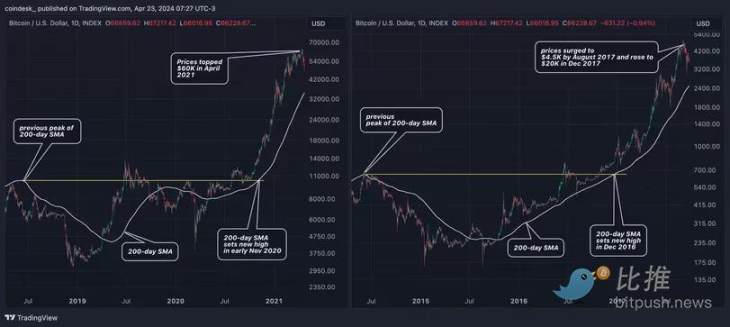
After the 200-day moving average set a new high in December 2016 (five months after the second halving), BTC surged by over 2000% within 12 months, reaching nearly $20,000. In November 2012, before and after the first halving, a similar rapid rebound occurred after the moving average reached a new high.
Short-term Weakness, Long-term Bullish
However, past performance does not guarantee future results.
Matt Ballensweig, Network Director at BitGo, stated in a report, "In the short term, the price trend of Bitcoin after halving events is often quite calm. The daily increase in newly mined Bitcoins after halving is 450 BTC, which is hardly enough to affect daily liquidity or immediate price trends. In fact, miners may even need to sell some of their existing BTC inventory to offset the decrease in daily income, leading to increased selling pressure in the days/weeks following the event."
Ballensweig believes that in the long run, the daily decreasing supply totaling 164,000 BTC (worth $12 billion) per year, combined with the net new demand for Bitcoin from ETFs, may lead to a significant long-term increase in Bitcoin's price. Data confirms this, as the average Bitcoin return in the month following all halving events in history is only 1.67%, while the average return in the year following halving events is as high as 3,211%, highlighting the difference between short-term and long-term impacts.
Steven Lubka, Head of Private Clients at Swan Bitcoin, agrees with Ballensweig's view that "the impact of halving is more pronounced in the medium to long term."
Lubka stated, "Based on the current price, there are approximately $30 million unsold every day, which may not seem like much on a daily basis, but over time, the amount will increase significantly. For example, over a month, it's $1 billion, and over a year, it's $12 billion."
Lubka pointed out, "The decrease in supply will have a mechanical effect, driving up prices. In addition, halving is built-in marketing for Bitcoin, attracting new users and creating a reflexive social layer, further driving up prices through increased demand. Ultimately, the combination of guaranteed supply reduction and social impact drives the long-term bullishness of Bitcoin."
As the market awaits the next catalyst to bring cryptocurrency prices back into an uptrend, Michaël van de Poppe, founder of MN Trading, stated that any pullback of Bitcoin below $60,000 is a "huge buying opportunity."
免责声明:本文章仅代表作者个人观点,不代表本平台的立场和观点。本文章仅供信息分享,不构成对任何人的任何投资建议。用户与作者之间的任何争议,与本平台无关。如网页中刊载的文章或图片涉及侵权,请提供相关的权利证明和身份证明发送邮件到support@aicoin.com,本平台相关工作人员将会进行核查。


