Author: Hexun
On November 20, both precious metals and industrial metals fell again. The main Shanghai gold contract fell by 4.90%, while the main Shanghai silver contract plummeted by 7.11% in a single day; COMEX gold and silver also showed significant declines overnight. Industrial metals also failed to stop declining, with Shanghai copper, tin, nickel, and zinc all experiencing varying degrees of declines that day.
Since November, the international metal market has undergone a noticeable adjustment. Gold and silver have continued to weaken, while industrial metals such as copper, aluminum, zinc, and tin have also been pressured in succession. Particularly, since mid-November, copper prices have accelerated their decline, dragging down the overall risk appetite in the metal market.
This round of adjustment is not driven by a single factor. Inflation pressure in the United States, a stronger dollar, and changes in interest rate expectations are suppressing metal prices; the concentration of previously accumulated long positions has further amplified the decline. At the same time, long-term logic regarding AI infrastructure investment, energy transition, and global metal supply and demand has also begun to be re-examined by the market.
Regarding this round of decline, the market has not formed a completely consistent judgment.
01, Metals in Collective Correction, What is the Market Repricing?
As of November 19, LME copper has fallen about 13.64% from its recent peak on October 21, COMEX gold has fallen 12.42% during the same period, COMEX silver has dropped 26.15%, and LME aluminum has fallen about 4.46%. Domestically, the main Shanghai copper has broken below 100,000 yuan/ton, falling about 9.87% in the past month; the main Shanghai silver has seen a decline of 22.27% in the past month. Both precious metals and industrial metals have experienced varying degrees of adjustment.
Chart | Market price performance of major metals over the past month
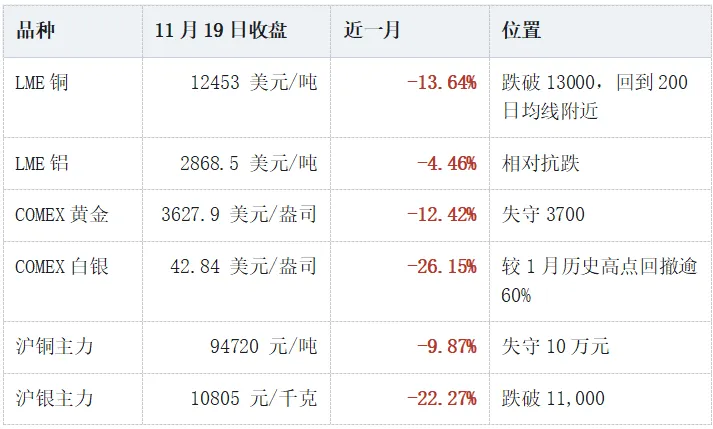
Data source: Wind. The one-month period is from October 21, 2026 to November 19, 2026. LME is the on-exchange closing price, COMEX is the main continuous contract, and the Shanghai Futures Exchange is the main closing price.
Attributions by various institutions for this round of correction are generally concentrated on several aspects.
First, the U.S. October CPI and core CPI both exceeded expectations month-on-month, with PPI increasing year-on-year to 6.5%. CME interest rate futures show that the probability of a 25 basis point rate hike in December has rapidly risen from about 80% a week ago to over 95%, with the dollar index rising to a yearly high of 103.9. Second, the adjustment in tech stocks transmitted through the path of "shrinking risk appetite—revising down copper and silver expectations for AI infrastructure" to metals, with Goldman Sachs clearly stating that the recent LME copper decline was "mainly driven by fluctuations in AI-related stocks, rather than a deterioration in the physical fundamentals." Third, the concentration of previously accumulated long positions in forced liquidation amplified the decline. Once prices broke key levels, forced selling occurred, reinforcing the sell-off. Fourth, cross-asset capital allocation. Some market views suggest that the synchronous crash on November 18 is related to Anthropic launching its IPO roadshow—quick money may have sold off crypto assets, precious metals, and copper to subscribe to this potentially record issuance.
In contrast to the market's performance, some physical indicators still show characteristics of tight supply. On November 18, the Yangshan copper premium rose to a historical high range of 360 dollars/ton, and the spot processing fees for copper concentrate remained in a deep negative range of -244 to -247 dollars/thousand tons. Mysteel data shows that as of November 19, domestic electrolytic copper spot inventory is at 54,800 tons; the copper inventory in China’s designated delivery warehouse dropped to 27,642 tons as of the week ending November 14, the lowest level since December 2023. The aluminum market is similarly facing inventory pressure, as LME aluminum inventory has dropped to about 220,400 tons as of November 17, the lowest level since 1990.
This forms the starting point of the market's divergence.
02, Gold: Short-term Interest Rate Pressure vs. Long-term Allocation Demand, Which is More Important?
The spot gold market has experienced consecutive declines over the past week, breaking through the critical thresholds of 3900, 3800, 3700, and 3600 dollars. Since the yearly high of 5,596 dollars, spot gold has dropped nearly 2,000 dollars, with a year-to-date decline of nearly 36%. The direct factor driving gold prices down is the change in expectations for U.S. monetary policy.
Gold continues to weaken in the short term, but foreign institutions’ judgments on mid- to long-term prices have not simultaneously turned pessimistic. Goldman Sachs, UBS, Morgan Stanley, and JPMorgan Private Bank's predictions still show varying degrees of optimism for gold prices in 2027.
Goldman Sachs has recently consecutively adjusted its gold price forecasts. The bank previously lowered its end-2026 gold target price to 4,150 dollars per ounce and adjusted its end-2027 target price from 5,400 dollars to 4,800 dollars; in mid-November, it further adjusted the end-2027 target price from 4,800 dollars to 4,650 dollars, while giving a forecast of 5,600 dollars by the end of 2028.
Goldman Sachs' long-term judgment on gold remains primarily focused on central banks' purchasing of gold and the need for reserve diversification. However, Goldman Sachs also predicts that the Fed may raise rates once each in December 2026 and March 2027, before gradually shifting to rate cuts. The bank describes the gold market of 2027 as "increasingly resembling 2022": central bank gold purchases provide support, but higher interest rates could limit the upward space for gold prices.
Statistics from the World Gold Council also show that central bank gold purchases continue to be an important component of gold demand. The World Gold Council estimates that global central bank gold demand in the third quarter of 2026 is about 321.2 tons, a year-on-year increase of 42%, higher than the quarterly average of 227 tons over the past five years; cumulative demand for the first three quarters is about 675 tons, a year-on-year increase of 6%.
Compared to Goldman Sachs, UBS’s judgment is closer to recent market trading. UBS believes that the recent sell-off of gold "is more like a short-term position adjustment, rather than a fundamental shift in market logic." The bank points out that a stronger dollar, higher real interest rates, and investor focus on other assets have put short-term pressure on gold prices, but gold ETF holdings still show certain resilience.
Morgan Stanley's prediction is more optimistic. In its November report "Global Outlook 2027," the bank lists gold as one of its most favored commodities, believing that gold will continue to benefit from sustained demand from ETFs and central banks. It predicts that gold prices will rise to 5,000 dollars per ounce in the second quarter of 2027 and reach 5,250 dollars in the fourth quarter.
The divergence can thus be summarized as: in the short term, the path of interest rate hikes has not converged, and gold prices lack upward drivers; in the medium term, central bank gold purchases, de-dollarization, and concerns about sovereign credit constitute a floor that is not easily broken through. The mixing of two time dimensions is the main reason for the "seemingly contradictory" current perspectives on gold.
03, Copper: Is Supply Tight or Not? Is Demand Sustainable?
The divergence concerning gold mainly revolves around "short-term and long-term," while the debate in the copper market is more direct—Is future supply really tight? Can AI and electrification demand support the previous high price expectations?
This week, copper prices exhibited a process of "a continuous decline shifting to a two-day sharp drop." On November 18, LME copper fell by 5.71% in a single day, COMEX copper dropped by 5.40%, and the pullback in AI tech stocks triggered a downward revision of copper expectations, accelerating the decline in copper prices; on November 19, Shanghai copper dropped an additional 5.07%, breaking below 100,000 yuan/ton; on November 20, it further fell by 3.35%, with LME copper also declining by 2.95% on the same day. Throughout the week, Shanghai copper accumulated a decline of about 12.1%, with the last three trading days contributing nearly 11.5% of that drop.
Goldman Sachs has recently experienced noteworthy changes in its judgment regarding the copper market. In mid-November, Goldman Sachs maintained its original forecast of 15,400 dollars per ton for copper prices in 2027, but simultaneously warned that this forecast faced downside risks. The bank noted in its report that "the main risks we predict arise from capital positions, rather than physical demand."
Goldman Sachs believes that post-U.S. midterm elections, market expectations for AI investment and data center expansion have changed, prompting investors to reduce their exposure to related assets, which has also impacted copper. The bank provided several scenarios: if the current level of capital positioning remains, the average price for copper in 2027 might drop to around 14,600 dollars per ton; if copper stocks hoarded in the U.S. this year are redirected to global markets, the 2027 average price could further drop to approximately 14,500 dollars per ton. Even so, these two figures are still significantly above the price of 12,526 dollars on November 19.
In contrast to Goldman Sachs’ focus on capital positions and price premiums, Deutsche Bank has a more optimistic medium-term judgment on copper prices. According to media reports on September 28, its metal research analysts predict that copper prices could rise to 10 dollars per pound in mid-2027, equivalent to about 22,000 dollars per ton. Its core logic is not a sudden sharp increase in global demand, but rather that copper inventories might continue to be hoarded and concentrated in a few markets, leading to a growing scarcity of copper available for actual procurement in other regions.
The International Copper Study Group's (ICSG) supply and demand forecasts offer a more globally aggregated perspective. In the latest forecast released in October 2026, ICSG estimated that global refined copper output in 2026 will be around 28.69 million tons, with consumption at about 28.59 million tons, resulting in a surplus of approximately 10.4 thousand tons; refined copper output is expected to reach 29.67 million tons in 2027, with consumption at approximately 29.30 million tons, expanding the surplus to about 36.8 thousand tons. According to this prediction, the global surplus of refined copper in 2027 will be significantly higher than in 2026.
Therefore, the divergence in the copper market is not simply a choice between "tight supply" and "oversupply." ICSG statistics global refined copper supply-demand balance, Deutsche Bank focuses on the delivery of immediate inventory distribution, while Goldman Sachs pays attention to how much premium capital is willing to pay for this balance.
This is also the most noteworthy change in the recent copper price adjustment: the market has begun to re-distinguish between actual consumption, inventory distribution, and price premiums driven by financial capital.
04, Silver: Has the Decline Been Enough, or Is the Adjustment Not Yet Over?
As of the close on November 20, silver futures and spot prices plummeted significantly, with institutional divergences focusing on whether the decline has been sufficient and when the turning point will occur. The main Shanghai silver contract was reported at 10,038 yuan per kilogram, down 7.11%; London silver spot on November 19 was reported at 42.88 dollars per ounce, down 4.83%; COMEX silver reported around 41.84 dollars during the day on the 20th; the main Shanghai gold contract fell by 4.90%. Since September 22, silver has cumulatively dropped nearly 37%, with the decline approximately double that of gold.
CITIC Futures takes a cautious stance. Their November 20 daily report suggests that gold and silver will continue weak fluctuations, and the substantial declines do not confirm a bottom, emphasizing risk prevention while needing to pay attention to the effects of oil prices, U.S. core inflation, employment data, and Federal Reserve officials’ statements on interest rate expectations, and warns that silver’s volatility may be greater than gold's, with commodity and equity markets resonating downward amplifying tail risks.
Other futures institutions also show a bearish outlook. Huatai Futures believes that under the ongoing hawkish stance of Federal Reserve officials and stubborn inflation, precious metals will continue to fluctuate, with short-term recovery lacking upward support; GF Futures previously suggested setting up short positions on rebounds, paying attention to the critical support level of 45 dollars per ounce (about 10,000 yuan per kilogram). On November 20, the main Shanghai silver contract closed at 10,038 yuan, approaching this level; Shouyi Futures judges that short-term precious metals will maintain a weak oscillatory bottoming pattern.
Relatively optimistic judgments are conditional. Goldman Sachs believes that during the rate hike phase, gold prices will experience greater volatility while remaining under pressure, relying solely on sustained central bank gold purchases to support the bottom, estimating that after the initiation of rate cuts at the end of 2027, gold is expected to rise to 5,600 dollars by the end of 2028, with the end-2027 target set at 4,650 dollars—a target that has been lowered for the second time in 11 days. Data from the World Gold Council on November 3 shows that global central banks net purchased 321 tons of gold in the third quarter, a year-on-year increase of 42%, with gold ETFs having a net inflow of 211 tons, reaching holdings of 4,256 tons. Official reserves and institutional allocation demand constitute long-term support, but for silver, the conveyance of this long-term logic requires more time.
There is currently no conclusive answer as to whether the decline has been sufficient or when the turning point will emerge. Institutions are generally paying attention to two clues: whether silver ETF holdings can stop falling, and whether photovoltaic and electronic orders can reactivate after price pullbacks. Until there is an easing of the Federal Reserve's hawkish stance and a weakening of the dollar, factors supporting the supply-demand gap, low inventories, and high gold/silver ratios are unlikely to be repriced; significant declines do not equate to having reached the optimal reduction.
05, Aluminum: Which Logic Prevails, Near-term Low Inventories or Long-term Oversupply?
As of the close on November 20, both Shanghai aluminum and alumina main contracts rebounded simultaneously, but prices remain at the low levels seen since mid-November. The main Shanghai aluminum contract reported at 21,535 yuan/ton, up 0.96%, with an open interest of 261,578 contracts; London aluminum for 3M settled at 2,843 dollars/ton, down 0.73%; the main alumina contract rose 0.96% to 2,618 yuan/ton.
Since November 11, Shanghai aluminum has cumulatively fallen about 4%, while London aluminum has retraced around 8%. Discrepancies in institutions’ judgments for the outlook still exist, focusing on the expectations of long-term oversupply versus near-term low inventories.
Bearish institutions use long-term oversupply as their main basis. Goldman Sachs, in its mid-November 2027 outlook, predicted that LME aluminum prices could fall to 2,600 dollars/ton by year-end, a significant drop from about 3,085 dollars/ton when the report was released, with a commodity allocation favoring copper and avoiding aluminum; Huajun Futures suggested that "mainly short positions" be taken, subsequently decreasing the reference pressure level for Shanghai aluminum 2701 from 23,000 yuan/ton to around 22,500 yuan/ton, and on November 20, concluded it as a "weak rebound, overall bearish."
Most futures institutions characterize the market as driven by expectations while being tight in reality. CITIC Futures summarized with "strong reality, weak expectations," suggesting that pessimistic expectations have led to a drop in aluminum prices, resulting in mid-term fluctuations; Xinda Futures stated that this round of decline is "more about trading expectations rather than fundamentals," with adjustments in AI narratives dragging down the non-ferrous sector, but the technical outlook has turned bearish, with 22,800 yuan/ton acting as resistance; GF Futures provided a running range for Shanghai aluminum set at 21,600 to 22,600 yuan/ton, indicating risks related to the materialization of hidden inventories.
Low inventories are a point of support emphasized by cautious factions. Nanhua Futures anticipates that prices' mid-term focus will trend lower, with contradictions in the near-term regarding "whether overseas low inventories and tightness in the near months can resist the gradually weakening domestic off-season," but "even after a drop, rebounds will still be frequent"; Guolian Futures stated, "both domestic and international aluminum inventories are low, making sharp declines difficult"; Dongya Futures believes lower inventories provide support from below, while demand limits upside, with prices likely to follow changes in macro sentiment.
Regarding the rebound on November 20, institutions tend to characterize it as a shorts covering. Jinrui Futures noted in an early review that this rebound "apart from a small increase in open interest for the 02 contract, is mostly driven by short positions taking profits"; "the strength of the rebound may be insufficient." Discrepancies among overseas institutions are larger, with Citigroup predicting aluminum prices between 3,000 dollars/ton over the next 0 to 3 months, which is down from 3,300 dollars in mid-October; Deutsche Bank anticipates aluminum prices around 3,000 dollars next year and 3,100 dollars in 2028; Goldman Sachs only sees 2,600 dollars. ANZ Bank in early November anticipated that aluminum prices would remain above 3,000 dollars at the start of next year, while London aluminum is currently at 2,843 dollars, already below this assumed level.
The current contradiction in the aluminum market is that while near-term spot shortages have not dissipated, expectations of increasing supplies in the longer term have already begun to suppress prices.
免责声明:本文章仅代表作者个人观点,不代表本平台的立场和观点。本文章仅供信息分享,不构成对任何人的任何投资建议。用户与作者之间的任何争议,与本平台无关。如网页中刊载的文章或图片涉及侵权,请提供相关的权利证明和身份证明发送邮件到[email protected],本平台相关工作人员将会进行核查。


