Author: Jianwei Zhizhu
This week, the recent bloodbath in colored precious metals reminds one of the poetic sentiment of returning to Jiangling in just one day. Interest rate hikes, AI regulation clearing under the blue wave, and the deleveraging of capital make the market situation at year-end truly spectacular — coincidentally, Goldman Sachs has released its macro outlook for 2027. Let's take a look at how Goldman Sachs views precious metals.
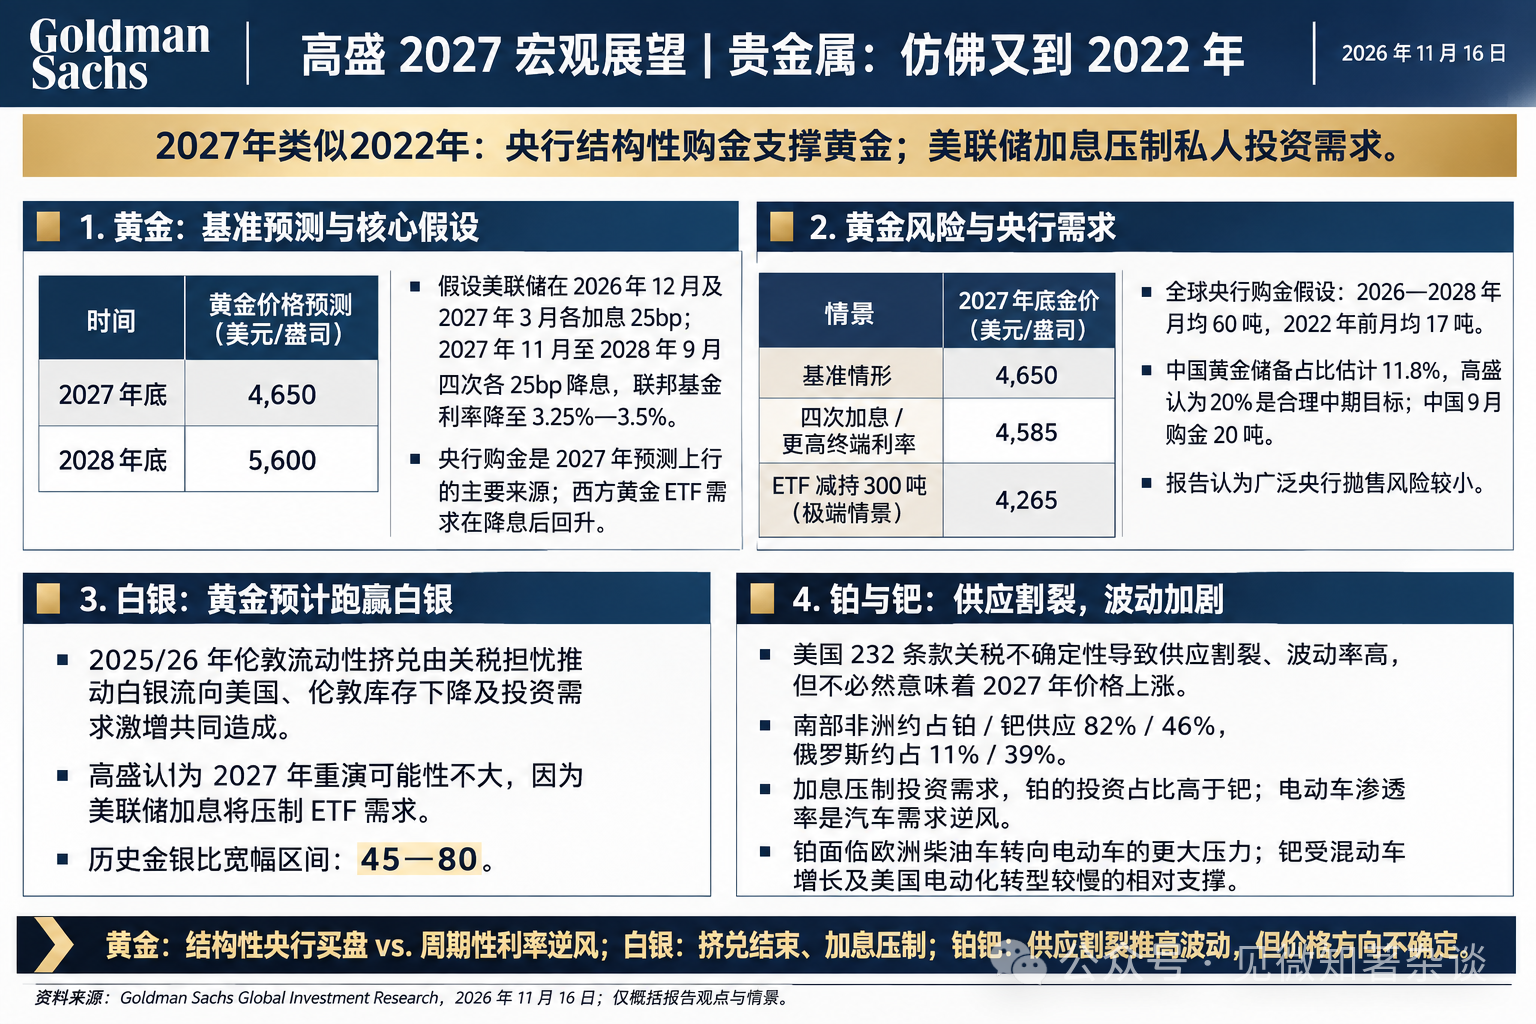
Goldman Sachs 2027 Macro Outlook: Precious Metals, It Seems Like 2022 Again
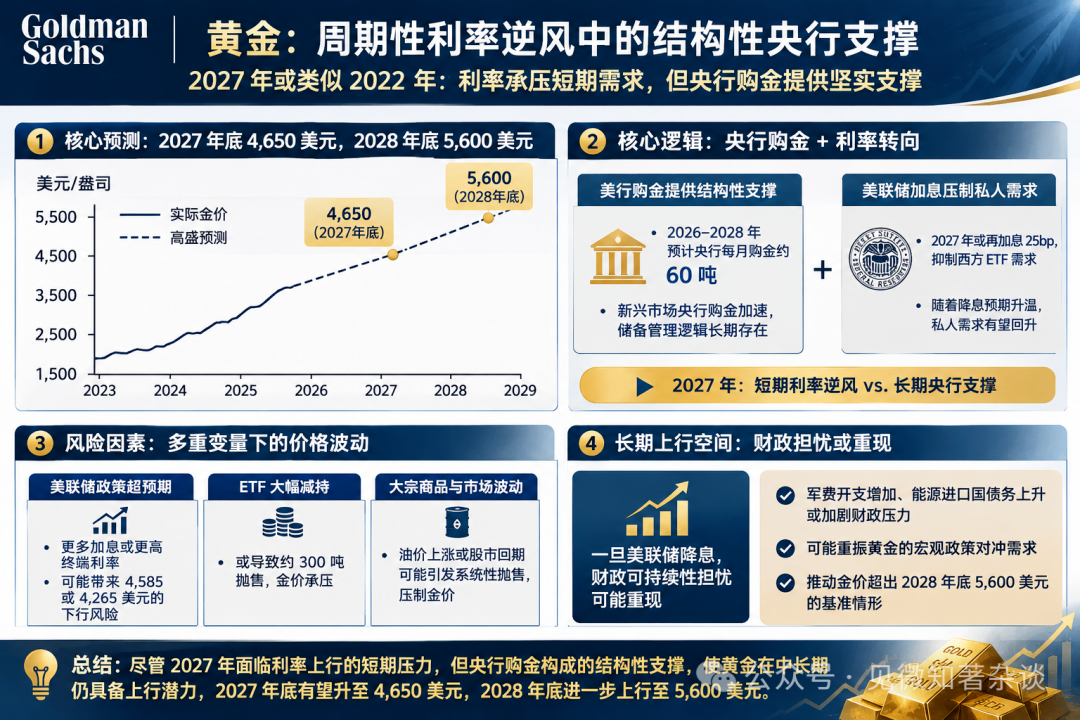
■ For precious metals, 2027 increasingly resembles 2022: The rising Federal Reserve policy rate suppresses private investor demand, but the structural gold purchases by central banks provide solid support for gold prices. Therefore, we believe there is short-term downside risk and increased volatility during the Federal Reserve's continued interest rate hikes. However, as central banks persist in purchasing gold, we still expect gold prices to slowly climb to $4,650 per ounce by the end of 2027.
Once the Federal Reserve starts to cut interest rates, we expect Western ETF demand to rebound, pushing gold prices more strongly upwards to $5,600 per ounce by the end of 2028. If macro policy hedge demand returns, the baseline scenario will have significant upside risks.
■ A similar pattern to 2022 should benefit gold rather than silver. The interest rate hikes suppress private investment demand for both metals, but only gold benefits from structural buying by central banks. Therefore, we expect gold to outperform silver in 2027, unless a liquidity squeeze in silver occurs again — we believe that during the Federal Reserve's hiking cycle and under pressure on silver ETF demand, such a squeeze will be hard to sustain.
■ For platinum and palladium, continued uncertainty regarding U.S. tariffs should keep supply fragmented and volatility high, but it may not necessarily indicate higher prices in 2027. Interest rate hikes should suppress investment demand — especially for platinum, which relies more on investment compared to palladium, while the increasing penetration of electric vehicles continues to pose structural headwinds for automotive demand.
Platinum faces greater pressure as European fleets, which have a higher proportion of diesel vehicles, shift towards electric vehicles; however, the decline in automotive catalyst demand for palladium should be more gradual, as the share of hybrid vehicles rises and the transition to electrification in the U.S. market—predominantly gasoline vehicles—is slower.
■ In this 2027 outlook, we discuss precious metals perspectives, key risks, and implications for investors in a Q&A format: We cover the upside and downside risks to gold forecasts, why gold failed to hedge against the 2026 supply shock in the Strait of Hormuz, how opportunities vary by investor time frame, why we expect central bank buying to remain structural, and the risks of China’s central bank gold purchases and potential sales by official sectors.
We then shift to why we expect gold to outperform silver during the Federal Reserve's hiking cycle, and why continued supply fragmentation could lead to platinum and palladium prices experiencing volatility but not necessarily pushing prices higher consistently.
1. Gold: Structural Central Bank Support Amid Cyclical Rate Headwinds
Question 1: What is your gold price forecast for 2027 and beyond?
We maintain a constructive long-term view on gold, based on structurally strong central bank purchases (including the People's Bank of China), but given the hawkish outlook from the Federal Reserve, we believe the short-term environment is more challenging.
Our economists expect a third 25 basis point rate hike in March 2027, following the anticipated second hike in December 2026, suppressing the interest rate-sensitive Western ETF demand.
Despite this, we expect persistent central bank buying to push gold prices up to $4,650 by the end of 2027, a 19% increase from the spot price and a 13% increase from the October average (Figures 1 and 2).
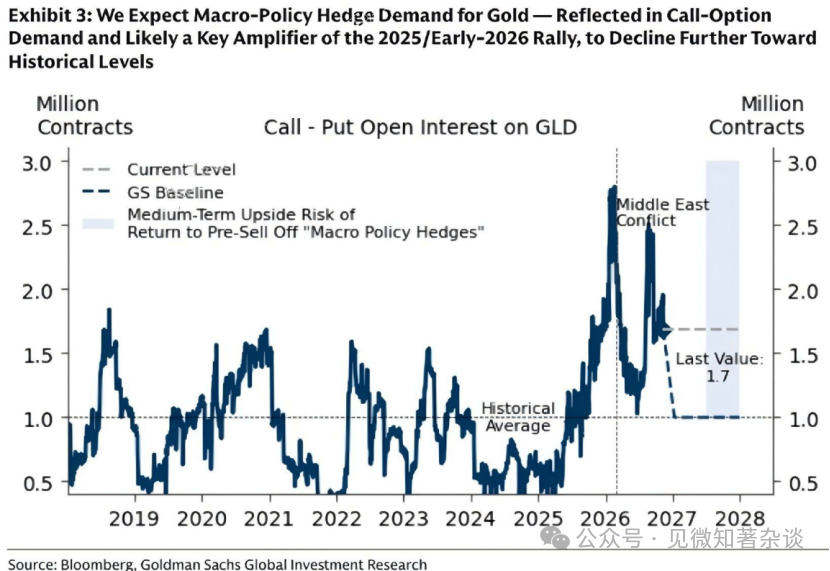
The recent hawkish shift from the Federal Reserve and rising policy interest rates should also suppress investors' "currency devaluation concerns." Thus, we assume macro policy hedge demand for gold — reflected in demand for call options — will revert towards historical averages (Figure 3).
We expect private investor demand (evidenced through interest rate-sensitive Western ETF demand) will eventually rebound between November 2027 and September 2028 after four 25 basis point rate cuts bring the federal funds rate down to a terminal rate of 3.25% — 3.5%, thus eliminating interest rate constraints on gold prices, supporting them to rise to $5,600 per ounce by the end of 2028 (Figure 1).
Figure 1: We project gold to be $4,650 per ounce by the end of 2027, and $5,600 per ounce by the end of 2028
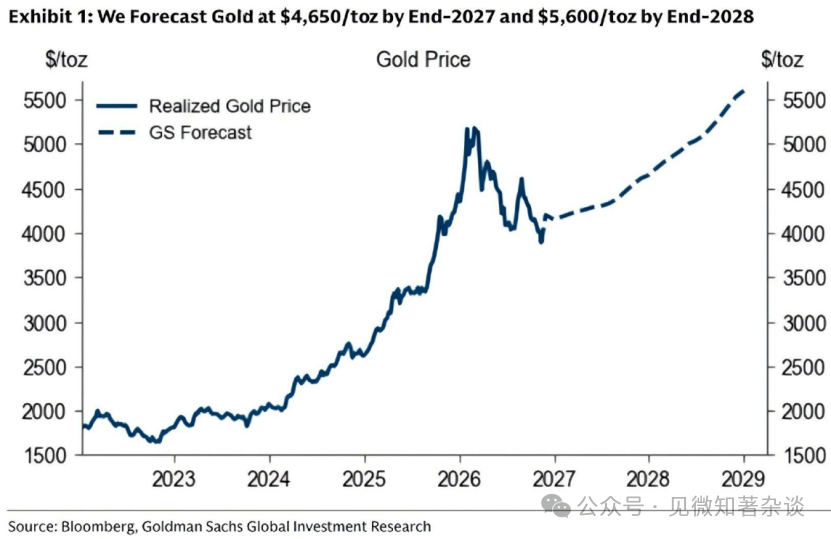
Figure 2: We maintain a long-term constructive outlook on structurally strong central bank demand — this drives much of our projected price increase by the end of 2027
Starting from an October average of $4,100 per ounce, we believe the recent price drop is mainly driven by speculative positions and may prove temporary.
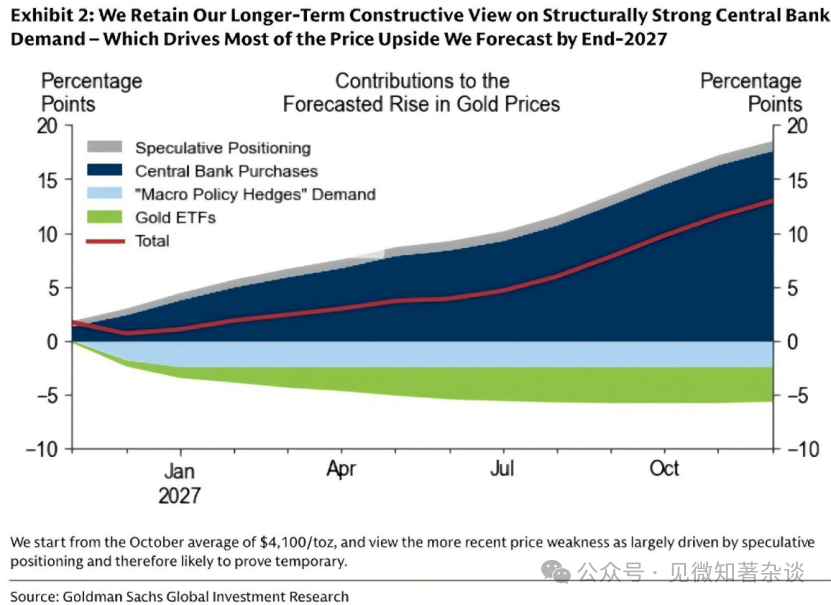
Figure 3: We expect the macro policy hedge demand for gold — reflected in demand for call options, and possibly a key amplifier for the upward trend in 2025/2026 — to further revert to historical levels
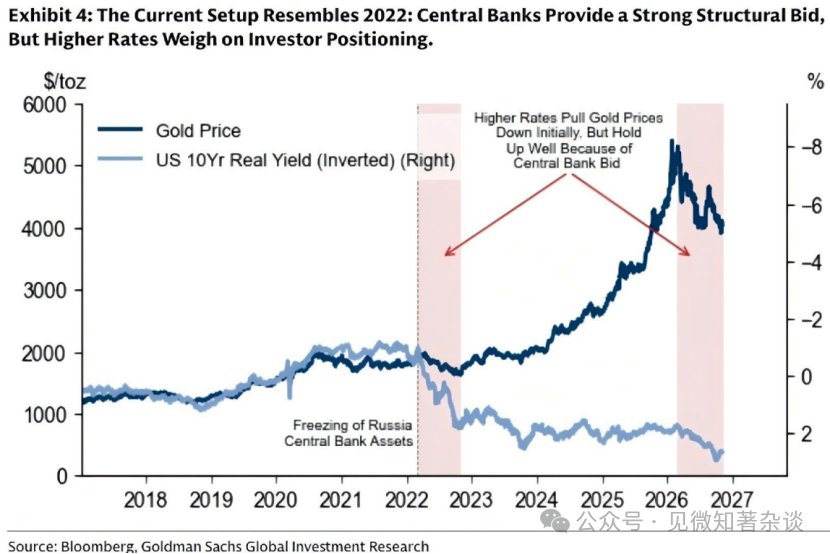
We believe the scenario for 2027 is similar to that of 2022 (Figure 4): Central banks provide strong structural buying, but higher federal funds rates suppress investor positions, leading to a more modest net increase in gold prices.
Figure 4: The current scenario is similar to 2022: Central banks provide strong structural buying, but higher rates suppress investor positions
Question 2: What risks does your gold forecast face?
We believe a more hawkish Federal Reserve brings further short-term downside risks. In the scenario of four interest rate hikes and a higher terminal rate (Figure 6), we estimate gold prices could reach $4,585 per ounce by the end of 2027 (the red dashed line in Figure 5).
A larger scaling back of ETF positions could further pressure prices. Over the past three years, gold ETF holdings have surged, reflecting normal upward trends brought about by lower rates and investor wealth growth (our rate implied self-regressing ETF model captures this), as well as a potential boost from recent devaluation trades. We expect the two additional Federal Reserve rate hikes will eliminate the latter but cannot clearly distinguish it from the structural wealth trend.
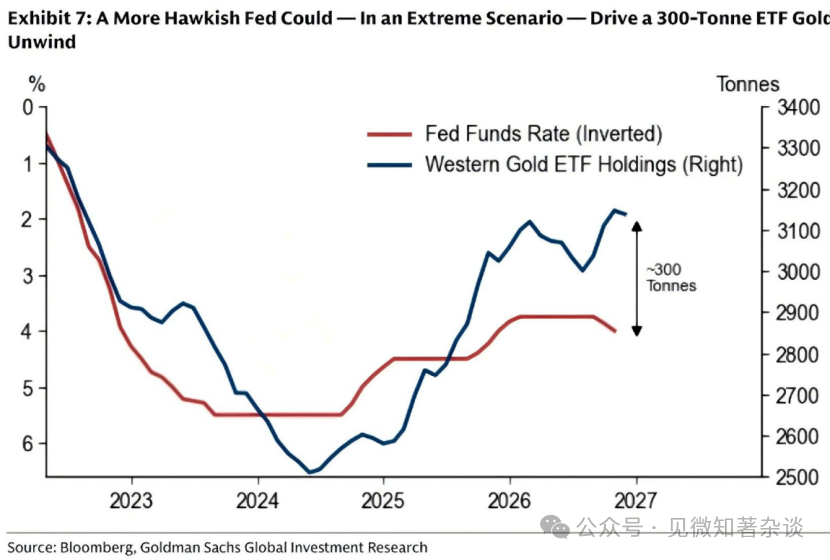
As a conservative lower bound, we therefore assume all excess ETF holdings over just the rate implied level will be reduced, meaning an additional 300 tons of selling, resulting in gold prices of $4,265 per ounce by the end of 2027 (the gray dashed line in Figure 5, Figure 7).
Figure 5: Higher terminal rates and ETF selling create downside risks to our baseline scenario (to $4,650 per ounce by the end of 2027)
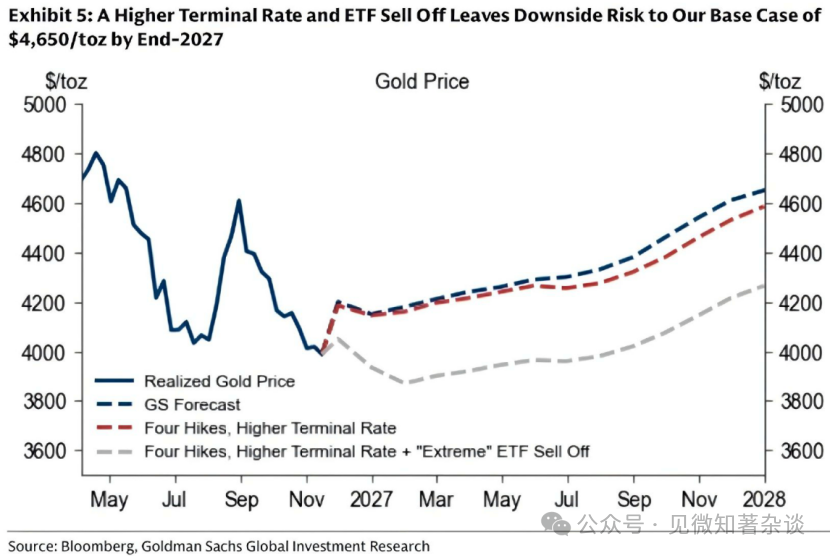
Figure 6: Our U.S. economists expect one rate hike in December 2026 and another in March 2027; additional increases and higher terminal rates pose downside risks to our gold price forecast
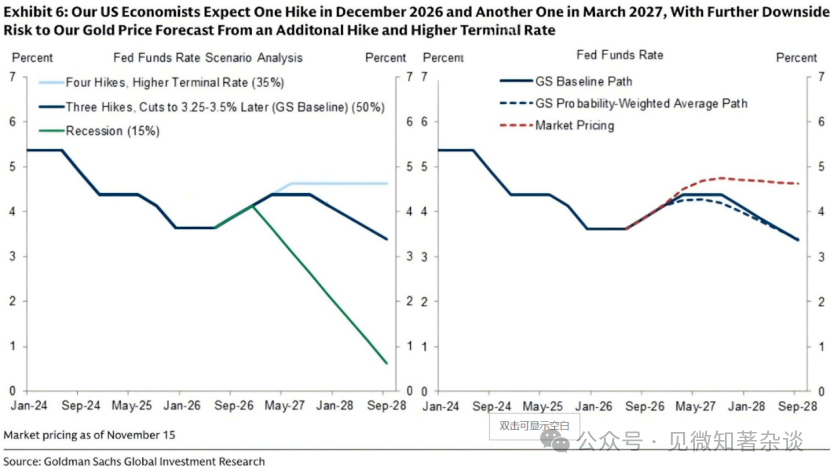
Figure 7: A more hawkish Federal Reserve could — under extreme scenarios — drive a 300-ton reduction in gold ETFs
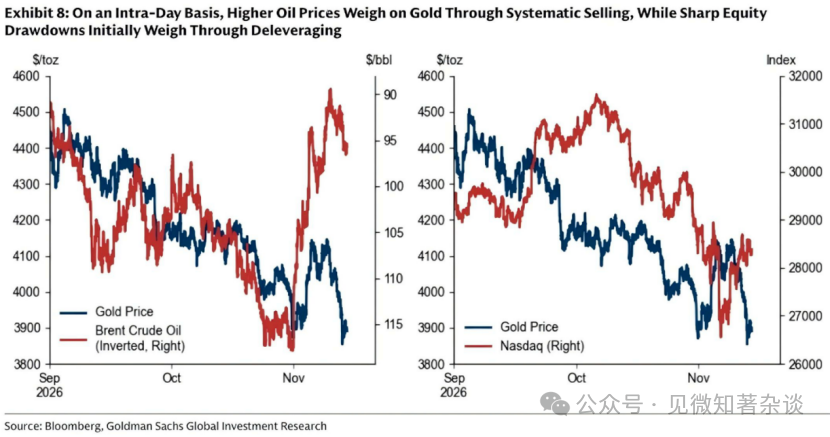
There are also tactical downside risks surrounding our fair value forecast. Our forecast captures slower-moving drivers of gold prices, namely Western ETF and central bank demand, but speculative positions could temporarily deviate prices from fair value. COMEX speculative positions are at a low in the 45th percentile, and we expect them to rebound under the baseline scenario. That said, rising oil prices could trigger additional systemic CTA selling, while a significant stock market drawdown (for example, related to AI cycle uncertainty) could initially drag gold lower, as margin calls and broader deleveraging force investors to raise cash (Figure 8).
Figure 8: In the short term, rising oil prices pressure gold through systemic selling, while significant stock market drawdowns initially suppress it through deleveraging
In the long term, if macro policy hedge demand returns after the Federal Reserve begins to cut rates, we believe there is significant upside potential outside of our baseline scenario. Concerns about fiscal sustainability perceived by Western economies may be exacerbated by increased military spending and rising debt burdens of energy-importing countries, which could revive macro policy hedge demand if investors also start worrying about how developed market central banks will respond. Once rate cuts eliminate the ceiling on gold price increases, the potential resurgence of fiscal sustainability concerns may push gold prices significantly beyond our baseline scenario of $5,600 per ounce by the end of 2028.
Question 3: Gold did not rise despite inflation increases during the 2026 Hormuz Strait shock. Has gold's role as an inflation hedge or safe-haven asset changed?
We believe it has not. We have long maintained that gold is not a universally applicable stagflation hedge because the source of inflation is crucial. There are two different stagflation patterns, in which stock-bond combinations typically perform poorly, but gold performs differently in these two patterns.
The first pattern is when market concerns about institutional credibility intensify. When the market doubts the central bank's willingness or ability to curb inflation, inflation can run high while both bonds and stocks decline. The 1970s were a typical case: U.S. fiscal expansion and the Federal Reserve's loss of independence led to runaway inflation, causing gold to soar as investors sought storage of value outside the system.
The second is supply disruptions simultaneously leading to weakened growth and rising prices, as seen with Russia reducing supply in 2022 (when it supplied 40% of Europe's gas), while commodities — as disturbed inputs — are one of the few assets with positive real returns. As with 2022, gold often initially performs poorly during supply disruption events. Supply-driven inflation increases the risk of tightening monetary policy, and rising yields raise the opportunity cost of holding gold and suppress ETF demand, while potential stock market retreats trigger margin-related liquidations.
The 2026 Hormuz Strait shock falls into the second category as the inflation shock stemmed from disrupted commodity supply.
Question 4: What advice do you have for investors?
■ For CTAs and macro hedge funds, the next 3-6 months may still be challenging: the rising federal funds rate in our baseline scenario, high uncertainty in energy prices, volatility from inflation and labor market data, and strict drawdown limits all make it difficult to maintain long positions. Rising oil prices likely add pressure through systemic selling, while significant stock market retreats may initially drag gold lower, as margin calls and broader deleveraging force investors to raise cash.
■ However, for long-term investors seeking exposure to rising central bank demand and/or macro policy tail risk protection (i.e., gold as a hedge against "devaluation"), the current pullback in gold prices may provide a more attractive entry point. Structural central bank demand remains supportive, and private wealth and other long-term investors may value gold as insurance against fiscal sustainability risks in developed markets, even if the realization of these risks is not our baseline scenario.
Question 5: Central bank demand is a key pillar of your gold outlook. Why do you believe this demand is structural and that buying will continue?
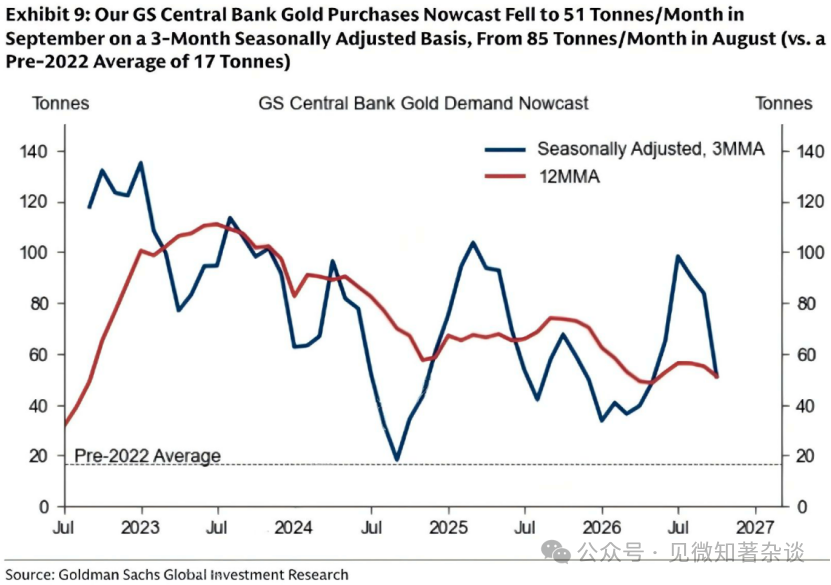
Our view of structurally strong central bank demand drives much of our projected price increase by the end of 2027 (averaging 60 tons per month from 2026 to 2028, compared to a pre-2022 average of 17 tons/month). Although the seasonally adjusted three-month moving average dropped from 85 tons/month in August to 51 tons/month in September, we expect that gold purchases have resumed with gold prices stabilizing thereafter; thus, we place more emphasis on the previously stronger months (Figure 9).
Figure 9: Our Goldman Sachs instantaneous forecast for central bank gold purchases fell to a seasonally adjusted three-month benchmark of 51 tons/month in September, down from 85 tons/month in August (compared to a pre-2022 average of 17 tons/month)
Since the freezing of Russian reserves in 2022, central banks — particularly those in emerging markets — have accelerated their pace of gold purchases by about five times. We view this as a structural shift in reserve management behavior and do not anticipate a reversal in the short term. Our baseline scenario assumes that the current accumulation trend by official sectors continues for another three years.
Our rationale is that the gold allocation by emerging market central banks remains significantly lower than that of their developed market counterparts, and the motivation to diversify allocations to escape G7 reserve currencies (including geopolitical and financial risks) may still exist.
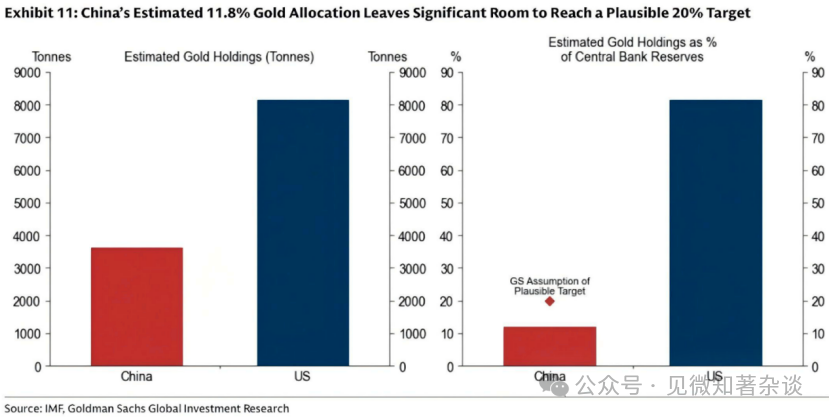
For example, we estimate that China's — the largest buyer — gold constitutes about 11.8% of its reserves, while the U.S., Germany, France, and Italy each hold about 80% (Figure 11).
The global average being over 20%, we see this as a reasonable mid-term target for large emerging market central banks, based on historical precedents, current allocations, and our discussions with reserve managers at emerging market central banks. For example, Russia increased its gold share from 8% to 20% between 2014 and 2020 and repatriated its gold reserves before sanctions.
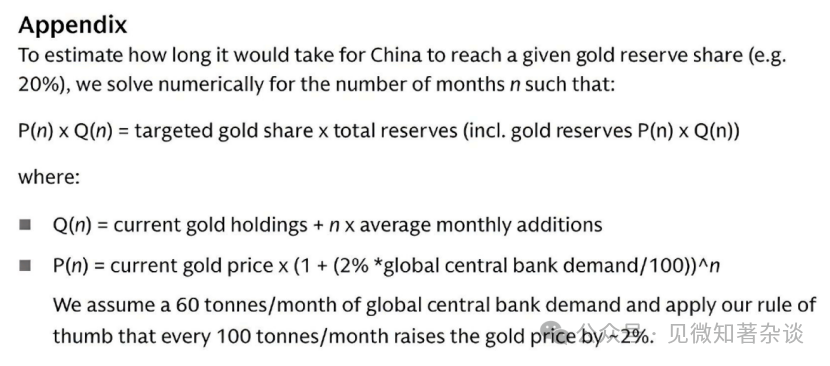
If the largest official buyer — China — aims for a 20% allocation and maintains an average purchasing pace of approximately 20 tons/month (consistent with its 12-month moving average) (Figure 10), we estimate it would take about three years to reach a 20% gold allocation. Our estimates also take into account the sustained global central bank purchases (60 tons/month), which may support higher gold prices over time — thus elevating the nominal value of existing holdings and helping to reach allocation targets more quickly (see appendix for details).
A recent World Gold Council survey supports our view: Among the 76 central banks surveyed between February and May 2026, a record 45% expect to increase their gold reserves over the next 12 months — the highest proportion since the survey began in 2018 — while approximately 90% expect global reserves to rise, with the rest expecting their holdings to remain roughly stable.
Figure 10: China was the identifiable largest buyer in September, purchasing 20 tons of gold
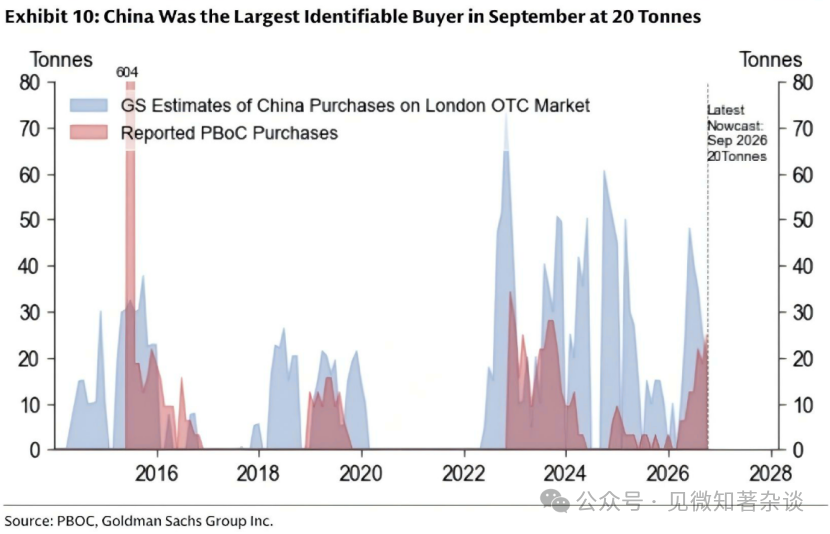
Figure 11: China's estimated 11.8% gold allocation leaves ample room to reach a reasonable 20% target
Question 6: Will China's gold allocation eventually exceed your reasonable target of 20%?
Yes. We believe there is an upside risk to China's 20% gold allocation target, as a larger gold reserve could support the internationalization of the Renminbi. The path for a currency towards becoming a more important international currency generally follows three steps: increasing use in third-party trade, enhancing its role in international bond markets, and ultimately establishing it in the reserves of other countries.
While the first two steps are in progress, the last step is typically the harvest phase for any emerging reserve currency, as reserve managers seek to diversify from the existing reserve system while also considering the asset composition that supports alternative currencies.
History shows that gold can aid in completing this transition: as a reserve asset not reliant on the credit or political stance of any issuer, gold can enhance confidence in an international currency. After World War II, significant gold holdings helped bolster confidence in the dollar surpassing the pound as the dominant reserve currency, reinforcing the notion that this currency is "as reliable as gold."
Thus, whether or not an emerging currency ultimately achieves dominant reserve status, the accumulation of gold can become part of the strategy, implying that China's desired gold allocation may ultimately exceed 20%.
Question 7: There have been reports that the Turkish central bank has sold off a significant amount of reserves since the outbreak of conflicts in the Middle East. Will this central bank gold selling widen?
We believe broader central bank gold selling is unlikely — our instantaneous forecast actually shows that central bank gold purchases have rebounded since May — and even the reported drop in Turkey may have exaggerated the actual selling.
Turkey's reserve reporting is unusual because gold swaps may show a decline in reported gold reserves even if gold is not directly sold, which could explain the initial 129 tons drop in the early Middle East conflict and its subsequent rapid rebound (Figure 12).
Figure 12: Data from the Turkish central bank shows that after a drop of 129 tons in the early Middle East conflict, gold reserves rebounded
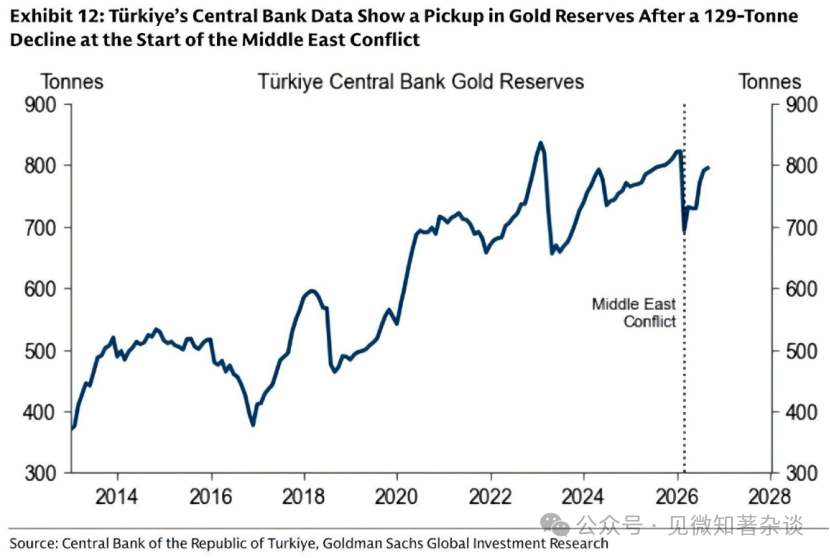
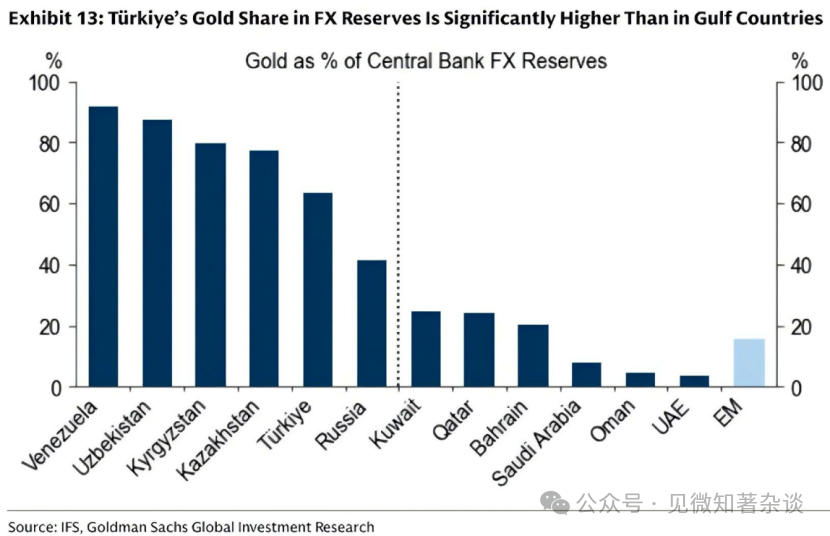
More fundamentally, Turkey is an exception: As an emerging market central bank, it faces potential demand for foreign exchange liquidity, and its exceptionally high proportion of over 60% of foreign reserves allocated to gold makes gold (swaps) more naturally a source of liquidity than in most emerging market reserve managers (who typically hold well below 20% in gold).
Only a few countries have such characteristics: Kyrgyzstan, Kazakhstan, and Uzbekistan also have exceptionally high gold allocations, while Russia and Venezuela face more specific restrictions on other reserve assets that also make gold a more natural source of liquidity. Therefore, we see these countries as likely exceptions for gold swaps or selling rather than signals of broader emerging market central bank selling.
We are skeptical about concerns that Gulf countries might also sell gold. Gulf countries have a significantly lower percentage of gold in their reserves. Gold accounts for about 4% of UAE reserves, 8% in Saudi Arabia, 5% in Oman, and about 24% in Qatar, compared to over 60% in Turkey's foreign reserves (Figure 13) — an exceptionally high proportion for emerging market economies.
The Gulf economies typically peg their currencies to the dollar, meaning that foreign exchange interventions are more likely to occur through the sale of U.S. Treasuries rather than gold. The reserve structure in the Gulf reduces the likelihood of their central banks liquidating gold for foreign exchange management purposes.
Figure 13: Turkey's gold share in its foreign reserves is significantly higher than that of Gulf countries
Question 8: Will developed market central banks holding large amounts of legacy gold reserves become sellers?
We believe that risk is currently low. If anything has changed, it is the interest in gold and reserve safety that is extending beyond emerging market central banks.
Since 2022, developed market central banks have essentially been on the sidelines of the gold buying spree, partly because they hold large amounts of gold reserves for historical reasons, often stored in domestic and foreign custodian facilities, particularly at the Bank of England and the New York Federal Reserve, to manage jurisdictional, political, and physical risks. Concerns over geopolitical instability are one of the reasons why some European central banks moved part of their gold reserves to New York during the Cold War.
However, feedback from developed market central banks indicates that discussions are increasingly shifting from whether to hold gold to where to store gold: for example, France and the Netherlands have recently undertaken repeated transfers of gold reserves away from New York.
Greater attention to reserve safety suggests that developed market reserve managers are increasingly considering the tail risks that first endow gold with strategic value, reinforcing reasons to retain rather than sell gold.
2. Silver: The Squeeze Ends, While the Fed Continues to Raise Rates
Question 9: Silver had an extraordinary start this year, peaking above $120 per ounce, with extreme price fluctuations. Do you expect a repeat in 2027?
Not in our baseline scenario. The silver rally in 2025/26 reflected an unusual combination of rising investor demand and tightening liquidity in London, which we do not expect to recur during the Federal Reserve’s interest rate hiking cycle (Figure 14).
Figure 14: Silver peaked in early 2026 due to a collision of rising investor demand and tightening liquidity in London
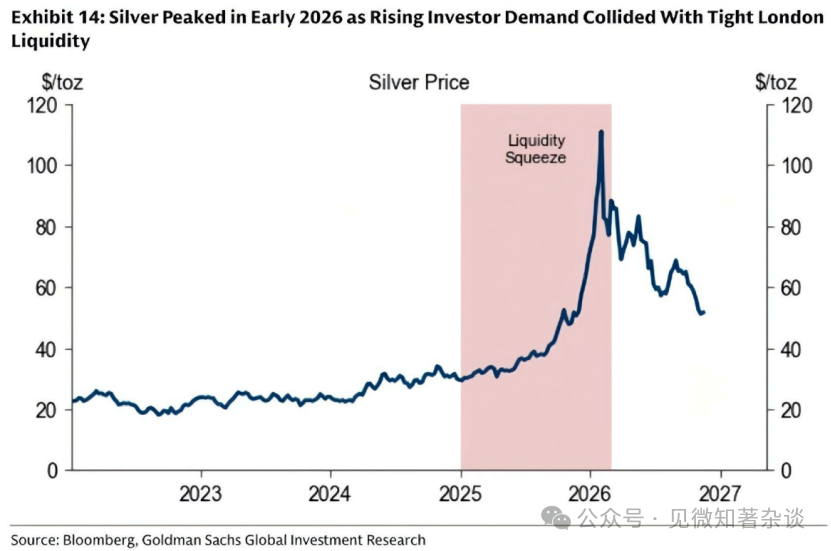
Speculation about U.S. trade policies — with silver included in the critical minerals list, implying that even if exempted in April 2025, it could still be subject to tariffs — encouraged preemptive shipments of the metal to the U.S. in 2025, pulling inventory away from London, which sets the global benchmark price.
As London inventories thinned, strong investor inflows — supported by anticipated Fed rate cuts, silver catching up with gold trades, and the spillover effects from devaluation trades — absorbed an increasing share of the remaining available metal, ultimately triggering a liquidity squeeze (Figure 15).
While typically, a weekly net silver demand of 1,000 tons would increase prices by about 2%, we estimate that during the squeeze, price sensitivity rose to approximately 7%. As investor demand subsequently weakened and tensions eased, prices fell sharply.
Figure 15: Tariff concerns drew silver to the U.S., draining London inventories; the subsequent surge in investor demand absorbed the remaining silver, disproportionately impacting prices
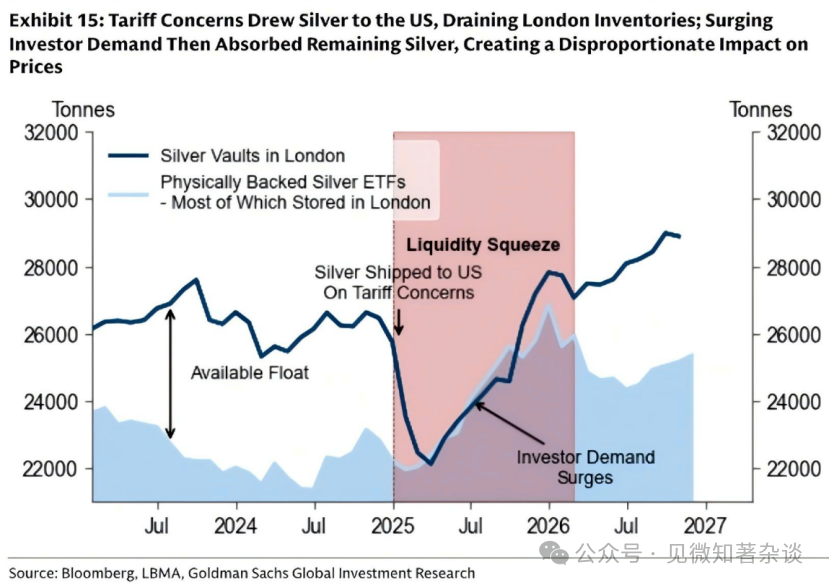
We believe the chances of a repeat of the 2025/26 squeeze in 2027 are low: even if new tariff fears again draw silver to the U.S., the Fed's interest rate hikes at the beginning of 2027 are likely to suppress ETF demand, eliminating the second leg of the squeeze seen in 2025/26.
Once the Fed restores easing, rebounding ETF demand could again push silver prices higher, but another liquidity squeeze in London will likely require new tariff concerns to simultaneously restart U.S. inventory accumulation.
Question 10: Is the gold-silver ratio still worth monitoring? With this ratio returning to the top of the historical range, will silver outperform gold again?
No, we believe gold may again outperform silver in 2027, at least during the Federal Reserve's interest rate hiking cycle.
Similar to gold — investment demand is the primary driver of silver prices. Historically, private investment flows in the gold and silver markets have moved synchronously (Figure 16), keeping the gold-silver ratio within a broad range of 45-80 (Figure 17).
Figure 16: The primary drivers of silver and gold — private investment flows — move in sync……
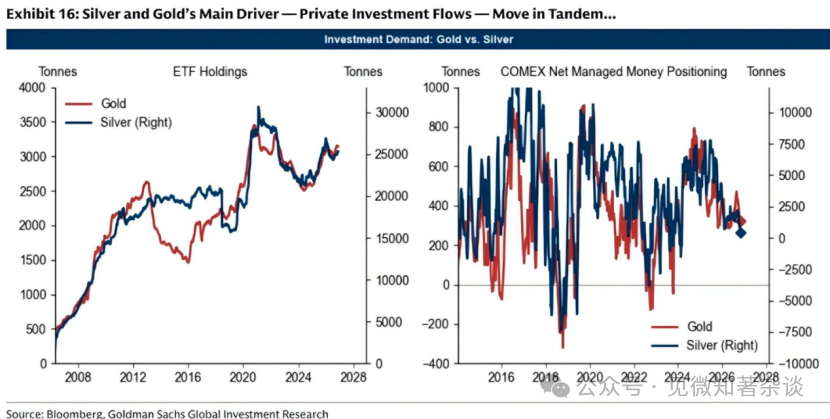
But since 2022, with surging central bank gold purchases, gold has decoupled, pushing prices higher even without private investment inflows. Silver, lacking central bank buying support, has lagged behind.
Figure 17: ……before the decoupling of gold from central bank purchases in 2022, the gold-silver price ratio remained in the 45-80 range
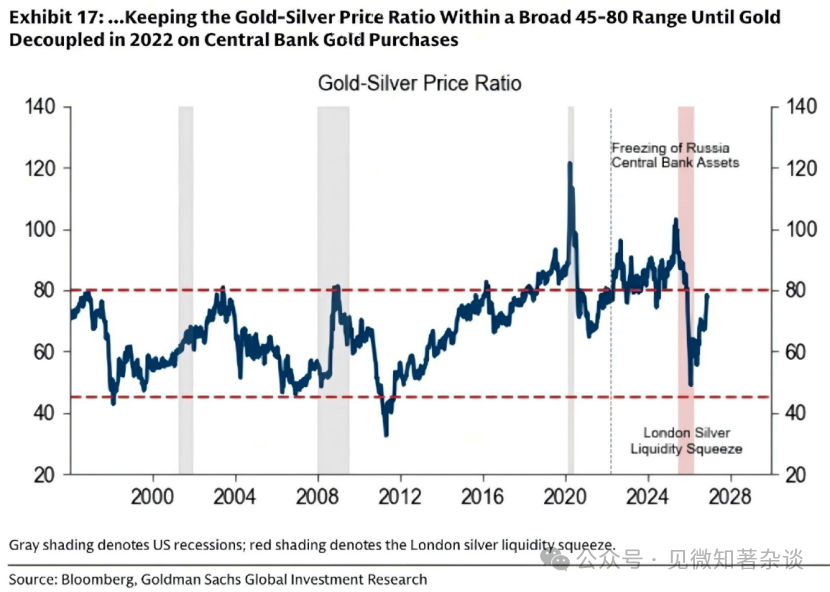
The liquidity squeeze in London in 2025/26 temporarily reversed this divergence, sharply pushing silver prices higher and driving the gold-silver ratio down to the historical range's floor. As the squeeze lifts, the gold-silver ratio is back at the top of the range, but we do not see this as a signal for silver to outperform again.
The Fed's interest rate hikes are expected to suppress private investment demand for both metals, but gold retains structural buying from central banks. Given that another liquidity squeeze for silver during the interest rate hike cycle is unlikely (see Question 9), we expect gold to again outperform silver in 2027, at least until the Fed resumes easing.
3. Platinum and Palladium: Still Fragmented
Question 11: Platinum and palladium are still under U.S. Section 232 tariff investigation. What does this mean for the outlook?
We believe the primary risk is continued supply fragmentation and the volatility brought about by ongoing uncertainty over U.S. tariffs (Figure 18), but we assess that actual tariffs on platinum and palladium are unlikely.
Figure 18: U.S. tariff risks since 2025 have driven platinum and palladium supply fragmentation, exacerbating volatility and squeeze risks
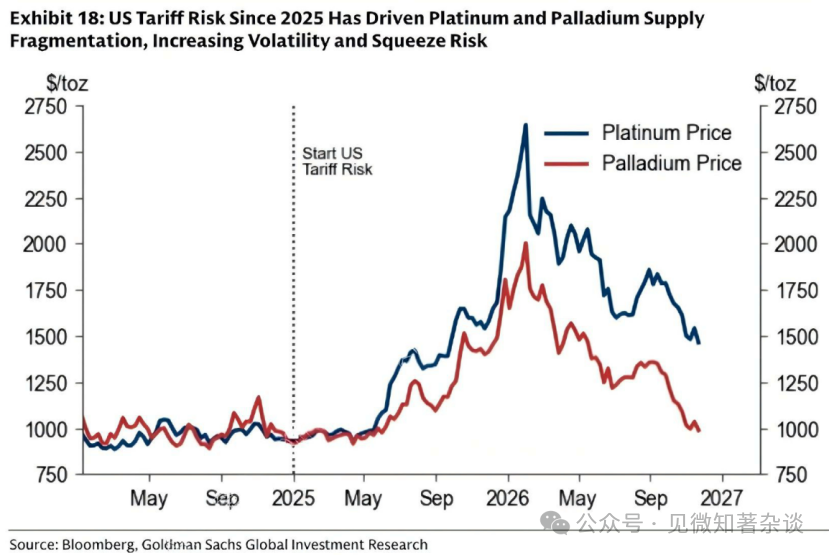
Platinum and palladium are critical inputs, especially for the automotive industry, but global supply is unusually concentrated: Southern Africa accounts for about 82% of platinum/palladium supply, with Russia accounting for another 11%/39% — resulting in significant disruption risks. Reducing dependence on foreign critical mineral supplies and rebuilding domestic capacity has become an increasingly important policy goal in the U.S.
Theoretically, tariffs are one way to achieve this policy goal: making imported minerals more expensive, protecting domestic producers, and ultimately incentivizing investment in U.S. mines, recycling plants, and refineries.
In practice, the supply response for platinum group metals is limited. Domestic production in the U.S. is limited, and expanding output is technologically and geologically challenging; new mines and refining plants require years to get approved, constructed, and operational. Given that tariff changes occur much faster than capacity building, the resulting policy uncertainty could disrupt the long-term investment that the tariffs aim to encourage.
However, the tariff risks can still achieve national security objectives by attracting metal inventories to the U.S. without requiring large government purchases or immediately raising costs for downstream consumers. The result is reduced liquidity outside the U.S. — thus resulting in price volatility — even though global inventories appear ample on paper.
Question 12: Does continued supply fragmentation mean higher platinum and palladium prices in 2027?
Not necessarily. Supply fragmentation keeps volatility risks high, but the demand landscape in 2027 is more complex. Interest rate hikes by the Federal Reserve should suppress investment demand, especially for platinum, which has a higher investment share than palladium. The transition to electric vehicles should also continue to reduce demand for platinum group metals, although the impacts for the two metals may differ.
Platinum faces greater headwinds from the shift to electric vehicles in Europe but also gains more upside room due to increased defense spending. European fleets historically have a higher proportion of diesel vehicles, making them relatively more dependent on platinum. Therefore, the rising penetration of electric vehicles will have a particularly evident impact on platinum demand. Our automotive analysts report that pure electric vehicle sales in Europe surged 66% year-over-year in August 2026, while implied internal combustion engine sales declined 10%. However, military vehicles still heavily rely on diesel, making increased defense spending a potential offset.
Palladium, on the other hand, is relatively supported by hybrids and slower electrification in the U.S. Gasoline vehicles are more reliant on palladium, and as hybrids are primarily gasoline engine vehicles, the growth of hybrids supports palladium demand. In the U.S., pure electric vehicle sales fell 45% year-over-year in Q3 2026, while hybrid vehicle sales increased 27% year-over-year. This indicates that with the rising share of hybrids and slowing adoption of pure electric vehicles, gasoline-related catalyst demand could persist for longer.
免责声明:本文章仅代表作者个人观点,不代表本平台的立场和观点。本文章仅供信息分享,不构成对任何人的任何投资建议。用户与作者之间的任何争议,与本平台无关。如网页中刊载的文章或图片涉及侵权,请提供相关的权利证明和身份证明发送邮件到[email protected],本平台相关工作人员将会进行核查。


