Bitcoin traded around $62,640 Thursday, down 0.6% on the day, as Anthropic's record-breaking stock market debut failed to reverse a broader selloff in risk assets.
The cryptocurrency has lost roughly 28% from its late-September peak near $87,000, and doesn’t seem on its way to stop anytime soon.
Anthropic began trading on Nasdaq under ANT after pricing 980 million shares at $83, raising $81.34 billion. Its stock opened at $111.50, up 34%, and briefly pushed the Claude maker's market value past $2 trillion, as Decrypt reported.
The enthusiasm stopped at Anthropic's ticker.
You can now act on the news you read: Go long or short Anthropic with perpetual futures, all from your Decrypt Money Account.
By 12:18 p.m. ET, the Nasdaq Composite was down 1.55%, the S&P 500 had lost 1.59%, and the Dow was off 2.03%. Investors remain concerned about expensive AI infrastructure and whether the spending will deliver adequate returns. The weak reaction beyond Anthropic undercut hopes that a blockbuster IPO could revive appetite for beaten-down technology stocks.
Crypto's weakness predates Thursday's listing. U.S. spot Bitcoin ETFs have shed roughly $2.9 billion this month, including $306.4 million Wednesday, amid rising Treasury yields and expectations of further Federal Reserve rate hikes.
Some traders argue the IPO has diverted capital from crypto, but that remains unproven. As Decrypt previously noted, Bitcoin and AI stocks have declined together, suggesting a wider retreat from risk rather than a simple rotation into Anthropic shares.
Bitcoin price analysis: EMAs, RSI, and the levels to watch
Bitcoin's daily chart remains decisively bearish. At around $62,640, BTC trades below both its 50-day and 200-day exponential moving averages (EMAs), with the shorter average beneath the longer one.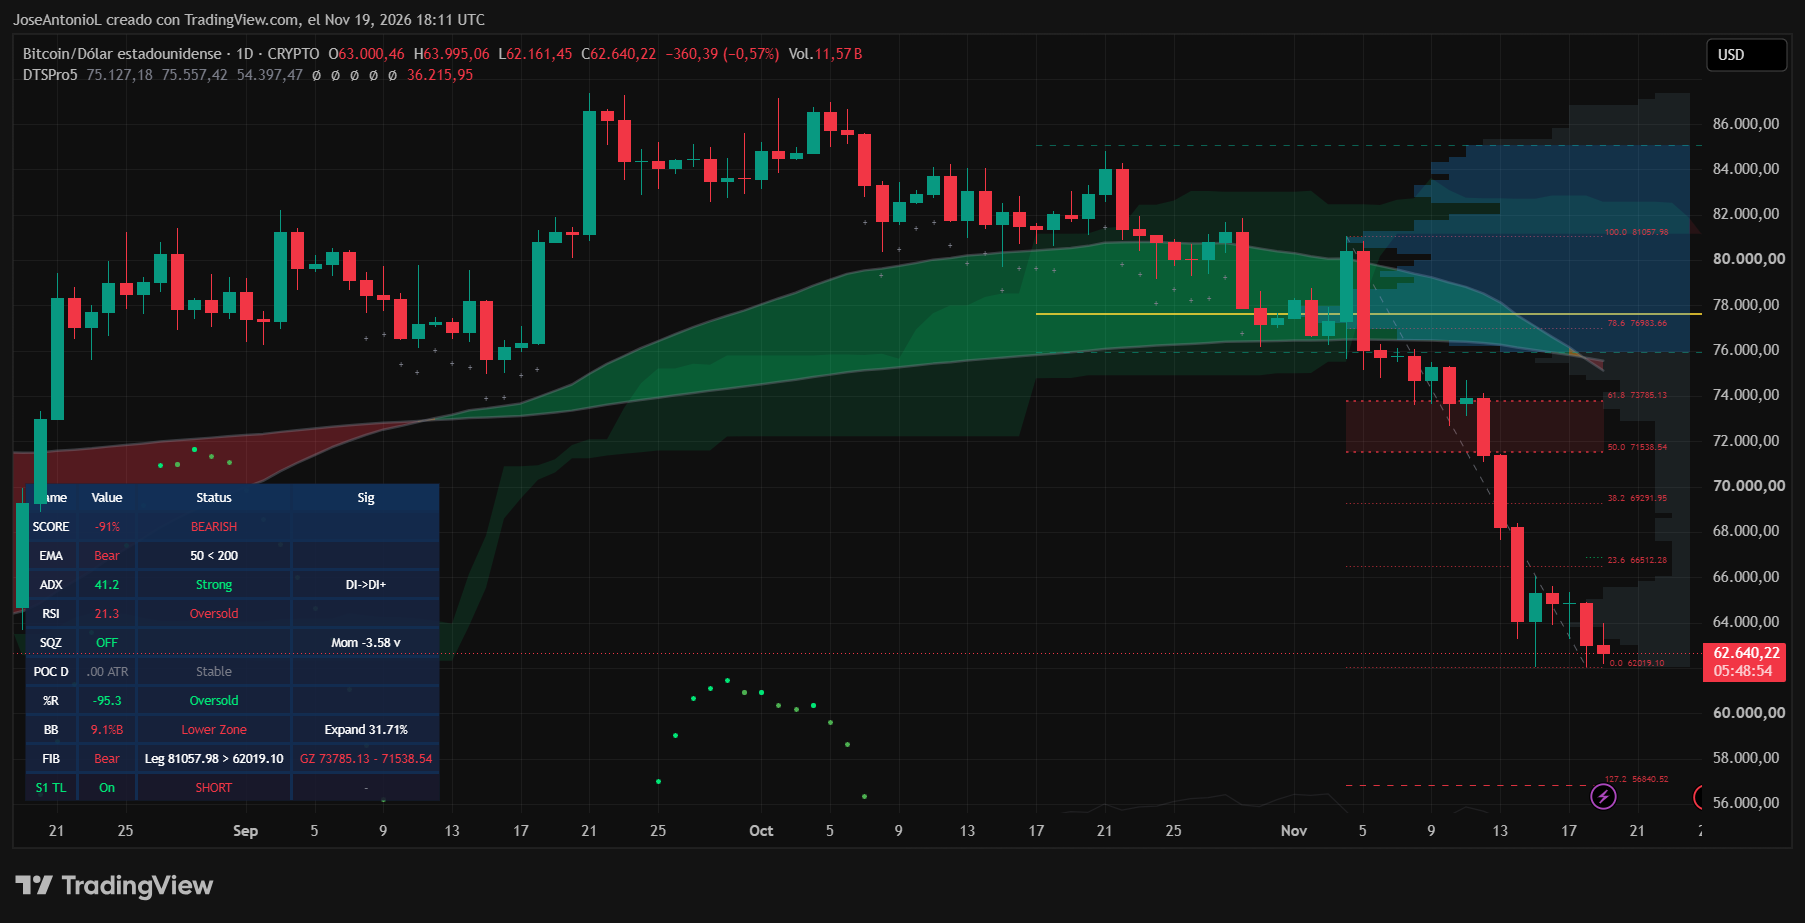
This is a bearish alignment commonly associated with an EMA-based death cross. Traditionally, a death cross occurs when the 50-day simple moving average crosses below the 200-day average, signaling deteriorating shorter-term momentum. The EMA variation responds more quickly to recent prices. The crossover was confirmed today.
Momentum reinforces the picture. The relative strength index, or RSI, reads 21.3, well below the 30 threshold traders associate with oversold conditions. That can precede a relief rally, but oversold assets can keep falling.
The average directional index, or ADX, stands at 41.2. ADX measures the strength of a trend, not its direction, with readings above 25 generally indicating a strong trend. Here, the negative directional indicator exceeds its positive counterpart, confirming sellers have the advantage. A high ADX reading alone does not mean a reversal is imminent, even with RSI already deep in oversold territory.
Bitcoin has also been making lower highs and lower lows since September, with November's sharp drop slicing through several support levels. A bullish recovery would first need to reclaim $66,512, followed by resistance around $69,292 and $71,539. Above those levels, $73,785 and then $76,984 would present tougher tests of the prevailing bearish structure.
On the downside, the chart marks immediate support near $62,019, almost directly beneath the current price. A decisive daily close below that level could expose the psychological $60,000 threshold, followed by the chart's next Fibonacci extension around $56,841.
The RSI leaves room for a bounce, but the EMAs and ADX show how much work buyers still face. A move through $66,512 would open a test of $69,292; a close under $62,019 would instead put $60,000 back in focus.
The views and opinions expressed by the author are for informational purposes only and do not constitute financial, investment, or other advice.
免责声明:本文章仅代表作者个人观点,不代表本平台的立场和观点。本文章仅供信息分享,不构成对任何人的任何投资建议。用户与作者之间的任何争议,与本平台无关。如网页中刊载的文章或图片涉及侵权,请提供相关的权利证明和身份证明发送邮件到[email protected],本平台相关工作人员将会进行核查。


