Cryptocurrency Academy: On November 20, Ethereum (ETH) fell below the average line pressure zone, and the second largest is accumulating energy for the next directional choice.
Many want to buy at the bottom, but few can stick to their discipline. Low position opportunities come with risks; before signals are confirmed, one can only test with light positions, not gamble with full positions on reversals. One must accept the possibility of being wrong in trading. Stop-loss is prepared for being wrong; don't let small losses turn into big losses by being reluctant to cut losses. There are opportunities every day in the market; preserving the principal is necessary for the next entry qualification. Just like yesterday, when the price at 1755 reduced some holdings at 1800, setting a buy order at 1730, and it's okay to have a small stop-loss if it's wrong.
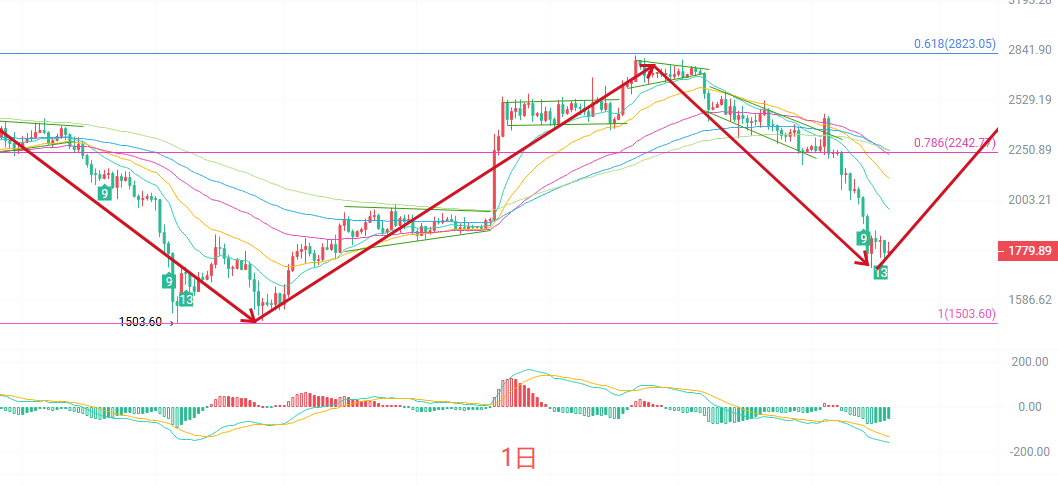
The daily candlestick chart shows a slight overall decline. Structurally, since the price fell from the high of 2806, the moving average system has formed a bearish arrangement. The EMA15 is at 1959, and the EMA30 is at 2106, with the price clearly below all short to medium-term moving averages, creating layered rebound pressure. The lower Bollinger Band runs to 1657, and the current price is hovering just above the lower band, indicating that the daily chart is still in a weak range; in terms of MACD, the green bars are still being released, and bearish momentum has not been completely exhausted. Although there is a demand for short-term low-level consolidation, the daily trend has not yet reversed; rebounds should be viewed as a repair, and it is necessary to regain the key moving averages to discuss stabilization.
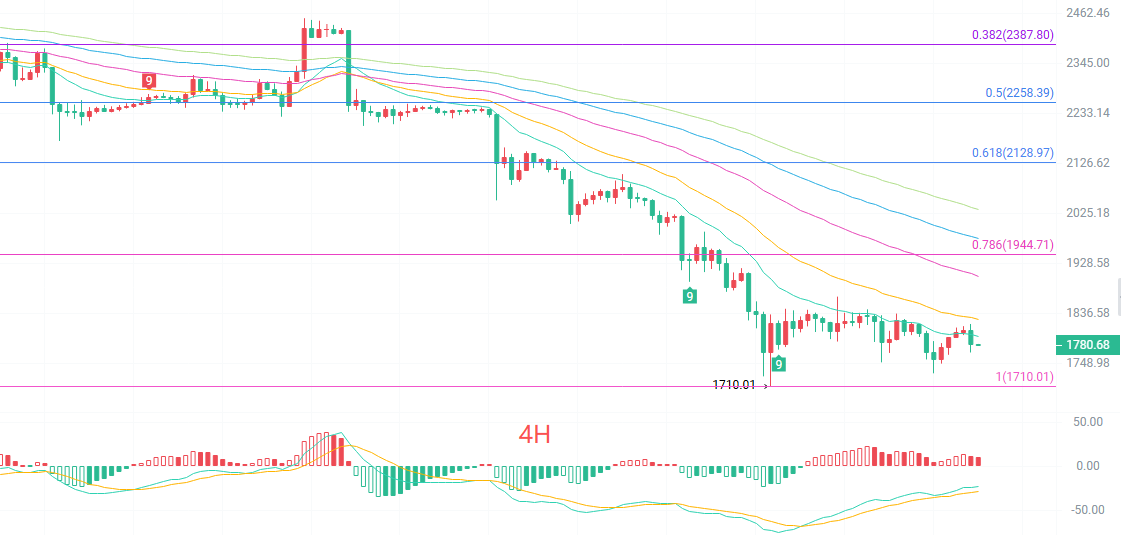
The four-hour candlestick chart rebounded from a low of 1710, returning to report under the EMA15 at 1798, with the EMA30 at 1828, and the short to medium-term moving averages still pressuring downward. The lower Bollinger Band is at 1760, the middle band at 1845, and the upper band at 1802, with the current price closely adhering to the lower band, showing a typical low-level weak oscillation pattern. The MACD shows a slight change from green to red, indicating a certain sign of short-term bottoming and repair, but the strength is relatively weak, still not forming a clear bullish reversal structure. The four-hour chart now resembles a breathing consolidation after a drop; whether the rebound continues will depend on whether it can rise above the moving average pressure around 1798—1828.
Short-term reference:
Southbound from 1800 to 1830 is sluggish, stop-loss 30 points, target 1770 to 1750.
Northbound from 1760 to stop drop at 1730, stop-loss 30 points, target 1800 to 1830.
Specific operations are mainly based on real-time market data. For more details, you can consult the author. The release of this article has a delay and is suggested for reference only; risk is borne by the individual.
Warm reminder: The above content, from the Cryptocurrency Academy, is synchronously updated on major trading platforms such as Binance, Ouyi, Huobi, etc. For more content, you can add me as a friend in Binance Ouyi and join my fan group.
免责声明:本文章仅代表作者个人观点,不代表本平台的立场和观点。本文章仅供信息分享,不构成对任何人的任何投资建议。用户与作者之间的任何争议,与本平台无关。如网页中刊载的文章或图片涉及侵权,请提供相关的权利证明和身份证明发送邮件到[email protected],本平台相关工作人员将会进行核查。