Liying Chat Currency: 11.20 Bitcoin (BTC) and Ethereum (ETH) Latest Market Analysis
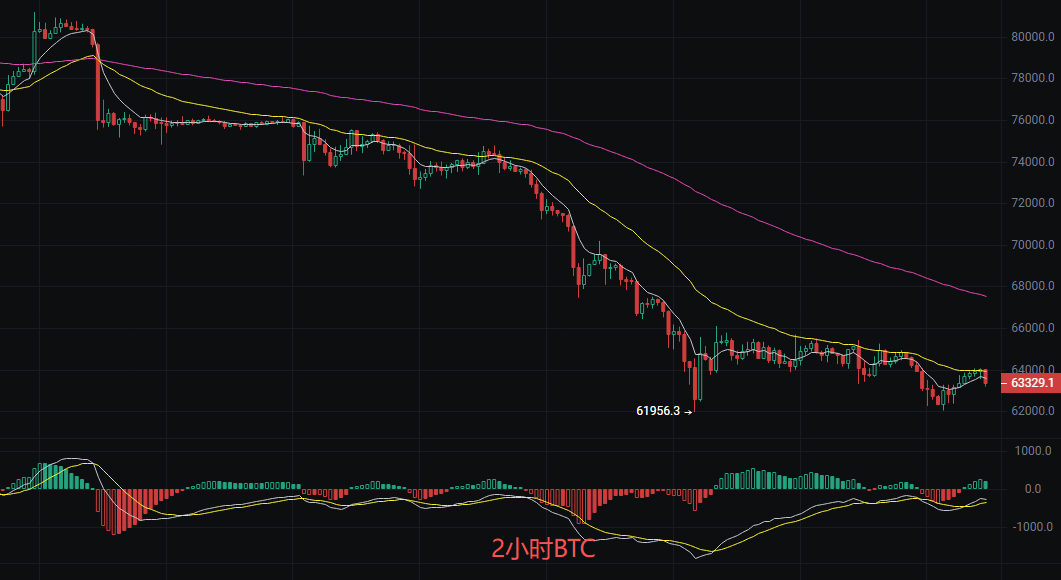
Family! The current price of Bitcoin is 63300, and it feels like it has been halved in just a few days. Many friends who entered at high levels must be panicking now. However, let's look at it from a different angle. As the saying goes, opportunities come from declines. This rapid sell-off is actually giving us money. Look at this candlestick chart; it previously tested a bottom near 62000 at 61956, and now the price has just returned to that position and has clearly paused. This is a typical double bottom confirmation. After a big bearish candle, several small doji and bullish candles followed, indicating that the bears can’t push down anymore, and the bulls are desperately defending this position. Do not cut losses in panic; it’s always darkest before dawn. As long as the defense line of 62000 remains unbroken, this is an excellent golden pit; get ready for a rebound! Additionally, the candlestick body has returned to within the lower range, which typically means that a rebound from overselling is about to occur.
Long and Short Strategy:
Long position current price 63200, light long, increase position on pullback to 62500. Stop loss: 61700 Take profit: 65500 / 67500
Short position strategy: Short on a breakdown, effective drop below 61800 to enter short. Stop loss: 62500 Take profit: 60000 / 58000
Ethereum
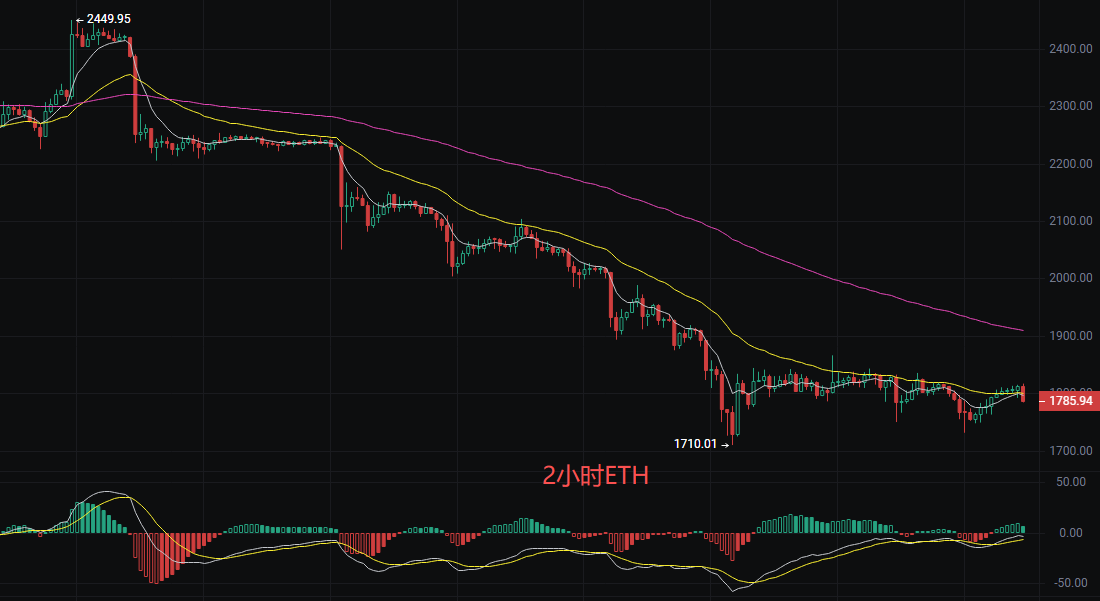
Family, the current price of Ethereum is 1785. If we look at a longer cycle, this is just a normal wash in the bull market cycle. The current drop is more due to the suppression of the macro environment and the diversion of funds. At this position, the market is undergoing a thorough exchange of chips, washing out the uncertain retail investors and allowing the main institutions to acquire cheaper chips. For long-term believers, the current price of 1785 may be a historically significant golden pit. However, in the short term, we still need to respect the market trend and not go against it. Wait patiently; opportunities are reserved for those who are prepared. The MACD has formed a clear bottom divergence structure. The price is testing the lower support level, and the Bollinger Bands are starting to flatten, which is a precursor to a trend change. Once the price breaks through the middle line at 1792 with volume, it will confirm the short-term bottom structure.
Long and Short Operations and Risk Control
Bull strategy: Current price 1785 light long trial, stop loss 1750, target 1820
Stable long: Wait for a breakout and stable above 1800 to go long, stop loss 1780, target 1850-1880
Bear strategy: Try short in the range of 1820-1830 for stagnation, stop loss 1850, target 1780
The above content is exclusive original work by Liying; please indicate the source if reprinted! There may be delays in article publication review, and market conditions change rapidly; the above suggestions are for reference only and risk is borne by yourself.
The above content is only associated with the Liying official account: Crypto Training Camp, created by the author. Advertisements at the end of the article and in the comment area are unrelated to the author. Please exercise caution in distinguishing, and thank you for reading.
免责声明:本文章仅代表作者个人观点,不代表本平台的立场和观点。本文章仅供信息分享,不构成对任何人的任何投资建议。用户与作者之间的任何争议,与本平台无关。如网页中刊载的文章或图片涉及侵权,请提供相关的权利证明和身份证明发送邮件到[email protected],本平台相关工作人员将会进行核查。