Crypto Circle Academician: Is the Ethereum (ETH) bounce on November 18 imminent or a pullback trap? Is the golden cross below the zero axis trustworthy?
Revisiting the record, a few notes: First, under a bearish daily background, the golden cross and pullback on the four-hour level need to be viewed with caution; a bounce does not equal a reversal. Second, prices near the lower Bollinger band may experience a technical pullback or may continue to decline along the lower band; the position of the channel itself does not constitute a directional judgment. Third, the TD count at a high level only indicates to pay attention to a potential dulling but does not equate to a definite bottom. Trading plans should first list two sets of bullish and bearish scenarios with corresponding stop losses and then wait for prices to reach verification positions.
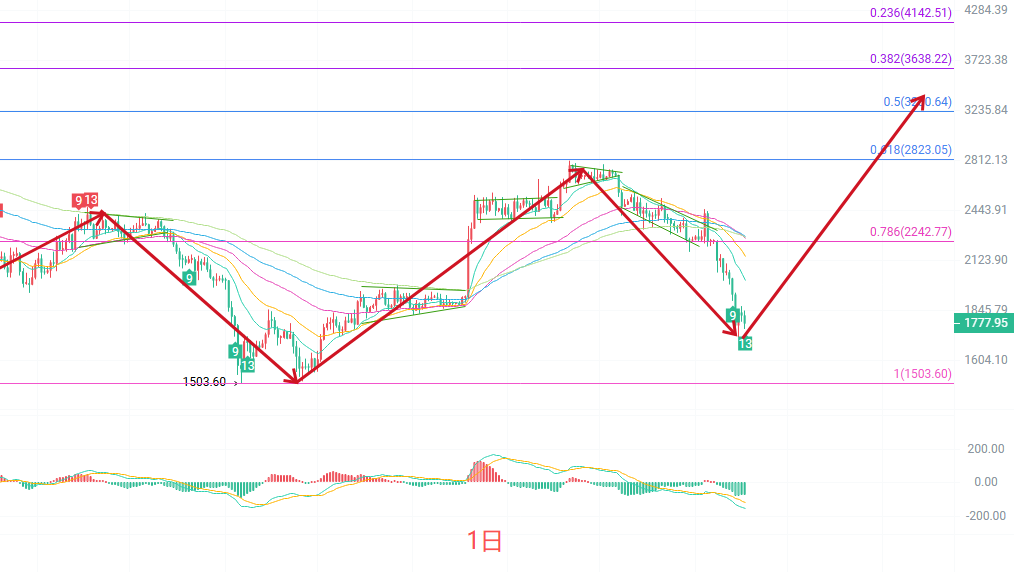
In terms of daily K-line moving averages, all are operating below these five moving averages, and the medium to long-term moving averages show a clear bearish arrangement. During price rebounds, these moving averages will sequentially apply downward pressure. The MACD dual lines are below the zero axis, and the green bars are still being released, indicating that the bearish momentum at the daily level has not yet fully exhausted. The Bollinger channel's middle track is at 2111, the upper track is at 2485, and the lower track is at 1737, with prices approaching the lower track area. The TD sequence count has reached 13; short-term downward movements have somewhat continued but have also entered a position that needs to be monitored for whether there is an occurrence of an oversold dulling. Overall daily qualitative: Weak downward structure remains unchanged; one negative candlestick alone cannot judge a bottom.
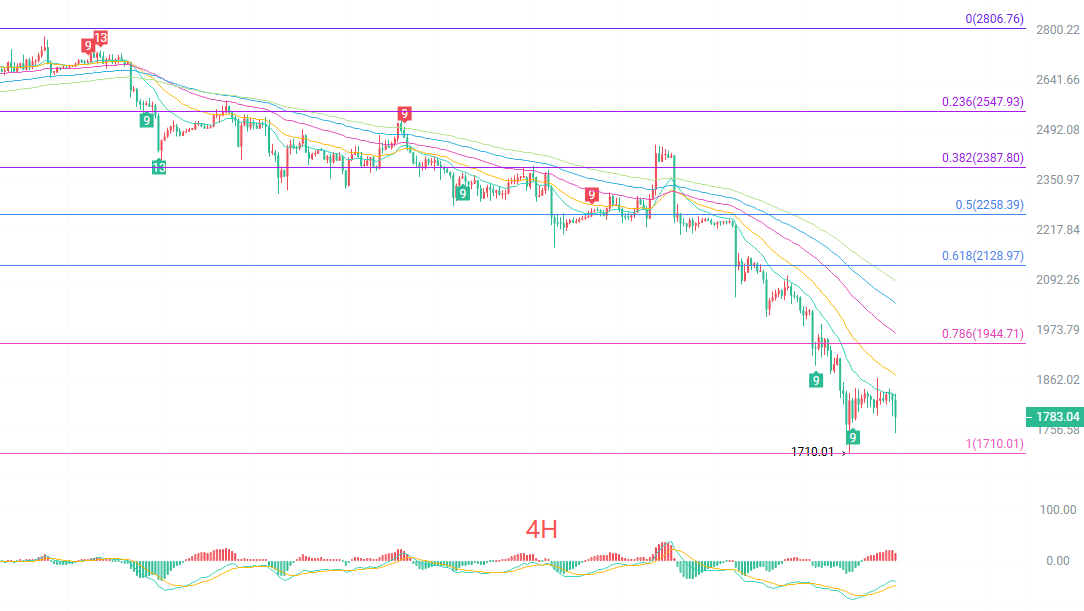
The four-hour K-line price is also below all short and medium-term moving averages, with the most recent resistance near EMA15 at around 1830. A positive aspect appears when the MACD dual lines below the zero axis show signs of a confluence and upward crossover; the red bars are initially released, indicating that there is a demand for recovery after overselling at the four-hour level, and the short-term rate of decline has slowed down. The Bollinger channel's middle track is at 1822, the upper track is at 1874, and the lower track is at 1769, with prices operating below the middle track; the previous low of 1710 serves as an important reference for this round of decline. Four-hour qualitative: The broader direction still leans weak, but there are signs of stabilization and attempts at a rebound in the short term; whether the rebound can continue will focus on whether it can rise above 1830 and approach the 1874 area.
Short-term reference:
Down from 1840 to 1880 facing stagnation, stop loss 30 points, target 1800 to 1750.
Up from 1770 to 1730 stopping the decline, stop loss 30 points, target 1820 to 1860.
Specific operations should be based on real-time market data. For more detailed information, you can consult the author; the article release may have delays, so it is recommended for reference only, and risks are borne by yourself.
Warm reminder: The above content by the Crypto Circle Academician is simultaneously updated on major trading platforms such as Binance, OKEx, Huobi, etc. More content can be found by adding me as a friend in Binance OKEx and joining my fan group.
免责声明:本文章仅代表作者个人观点,不代表本平台的立场和观点。本文章仅供信息分享,不构成对任何人的任何投资建议。用户与作者之间的任何争议,与本平台无关。如网页中刊载的文章或图片涉及侵权,请提供相关的权利证明和身份证明发送邮件到[email protected],本平台相关工作人员将会进行核查。