Cryptocurrency Scholar: On November 18, Bitcoin (BTC) daily chart shows bearish signals, and a weak rebound on the four-hour chart: Behind the divergence in various time frames, how is capital being allocated?
Market volatility is the norm; rises and falls will not last forever. The most common mistake that beginners make is trading based on emotions: panicking when prices drop and getting excited when they rise. It is advised to first calculate the losses you can tolerate, keep positions light, and leave some room. It's safer to avoid trading in markets you don't understand than to forcefully enter. Reviewing past performance focuses on position and rules, not the wealth stories told by others. Take your time; first learn how not to lose big money, and then think about how to make money.
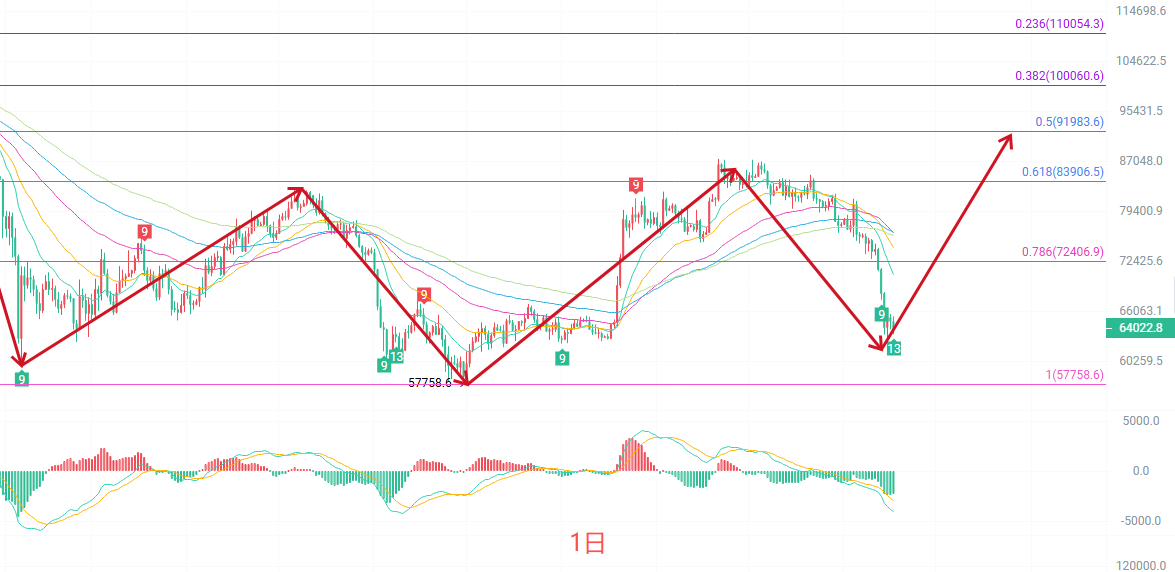
The daily K-line faced resistance and fell back from a high around 87385, continuously forming bearish candles, with a minimum drop to the 61956 line before slightly recovering, currently oscillating around 65000. The price has already fallen below the short and medium-term EMA moving averages cluster, with the 15-day, 30-day, and 60-day moving averages all in a bearish arrangement downward, and the daily K-line is overall in a downward channel. The MACD fast and slow lines are opening downward below the zero axis, and green bars are continuously being released, indicating that the mid-term selling pressure has not yet been completely released; the lower Bollinger Band has been touched downward by the price, and the channel's opening is expanding downwards, with a short-term bearish trend still dominating. At present, the daily level has not shown a clear bottom reversal signal, and can only be seen as a weak rebound repair after a sharp decline, with a rebound into the moving average pressure zone still having the possibility of another decline.
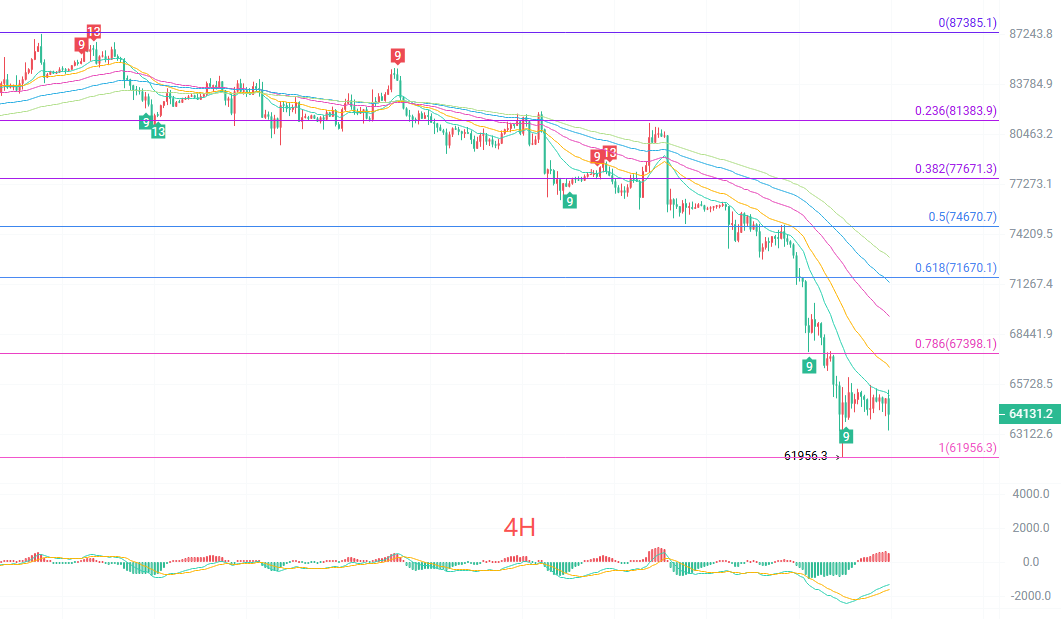
The four-hour K-line slightly rebounded after probing the bottom at 61956, forming a few small bullish candles and currently operating in the 64900—65400 range. The short-term EMA15 and EMA30 are still suppressing the price from above, while EMA70, EMA90, and EMA120 are diverging downwards, showing no change in the bearish pattern of mid to short-term moving averages. The four-hour MACD shows a slight uptick at low levels, with red bars beginning to try to expand, indicating weak rebound momentum in the short term, but the fast and slow lines remain below the zero axis, meaning this rebound is merely a corrective movement and not a trend reversal. The lower Bollinger Band is flattening downwards, with the price running below the middle band, with the upper range of 66700—67000 as the first short-term resistance zone, and the lower range of 63600—62000 as the key support zone; the range should be viewed with oscillation until a breakout occurs.
Short-term reference:
Sell down from 67200 to 67700 with a stop loss of 500 points, target 66000 to 65000.
Buy up from 64000 to 63500 to stop the decline, with a stop loss of 500 points, target 65000 to 86500.
Specific operations should be based on real-time market data. For more details and information, you can consult the author. The publication of the article may have some delay; it is advised as a reference, and risk is to be borne by yourself.
Warm reminder: The above content is synchronously updated by the cryptocurrency scholar on major trading platforms such as Binance, OKEx, Huobi, etc. For more content, you can add me as a friend in Binance OKEx and join my fan group.
免责声明:本文章仅代表作者个人观点,不代表本平台的立场和观点。本文章仅供信息分享,不构成对任何人的任何投资建议。用户与作者之间的任何争议,与本平台无关。如网页中刊载的文章或图片涉及侵权,请提供相关的权利证明和身份证明发送邮件到[email protected],本平台相关工作人员将会进行核查。