Who is pricing tokenized stocks? The answer is not in Kraken.
Written by: stein
Translated by: Chopper, Foresight News
On Wednesday, October 28, buyers on Kraken were a bit anxious: all day long, they were trying to buy up tokenized NVIDIA stocks, ending the day with $224,000 more in active buying than selling. As a result, the closing price that day fell by 1.85%. (Note: Times referenced in this article are in local US time)
Thus, the question arose: why did a group of anxious buyers end up losing?
Stock prices are determined in places where actual shares are traded, such as exchanges like Nasdaq and the New York Stock Exchange. They provide price references for on-chain stock tokens. However, once the stock market closes, these tokens must continue to trade without any reference, leading to potentially absurd price deviations.
With this question in mind, I reviewed 60 trading days of six tokenized stocks on Kraken to see when buying pressure really drove prices and when it was just noise.
What I was looking at
I examined every transaction of six tokenized stocks on Kraken between September 14 and November 13, 2026: 159,002 transactions, totaling $102 million.
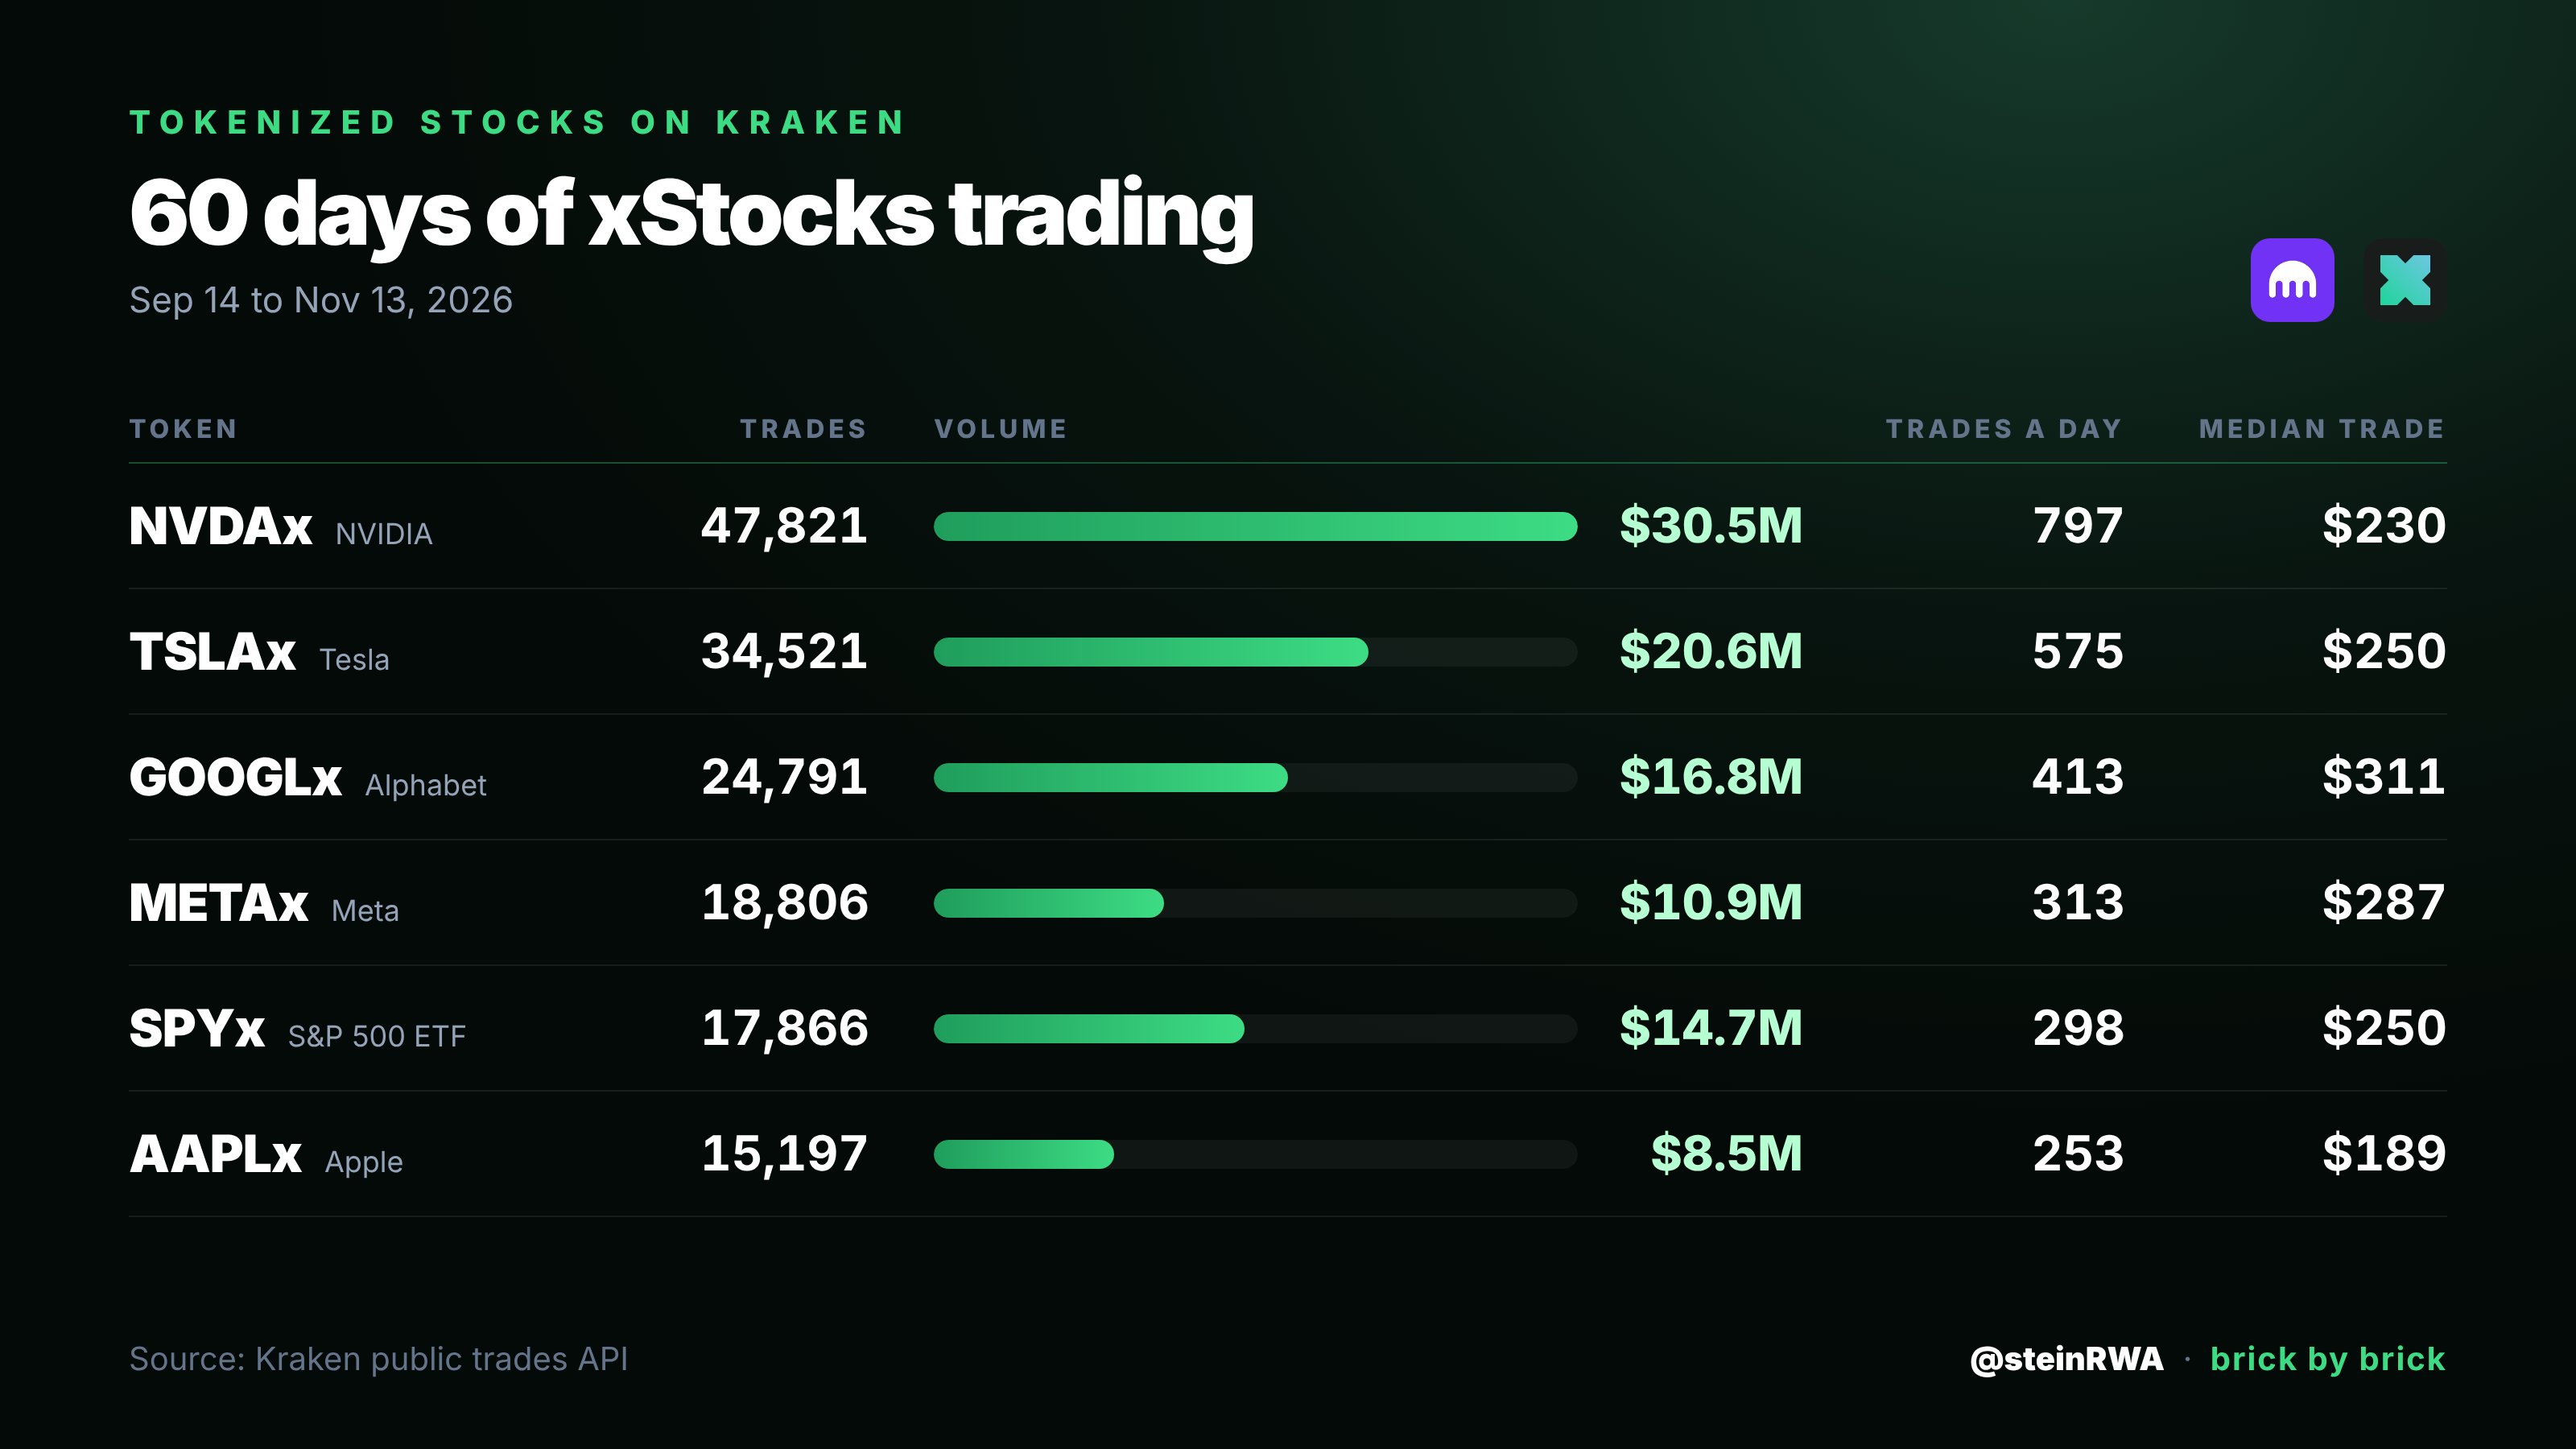
Each transaction has a label indicating who was eager to price. "Buy" means the buyer could not wait and took the seller's listed price directly; "Sell" means the seller couldn't wait and accepted the buyer's offer. This eagerness is referred to as active transactions by traders.
First, we need to clarify a few concepts:
- Net Pressure: The dollar amount of active buying minus the dollar amount of active selling.
- CVD (Cumulative Volume Delta): Think of it this way. In the market, there are buyers and sellers. Every time someone clicks "Buy Now," the buyer gets 1 point; every time someone clicks "Sell Now," the seller gets 1 point. CVD is the difference in points. If buys were clicked 10 times and sells 4 times, CVD would be +6.
- Price Reaction: How much the price moved, measured in basis points. 1 basis point = 0.01%, 100 basis points = 1%.
- Clock: US stock trading hours (New York time 9:30–16:00), pre-market, after-hours, overnight, weekends.
Additionally, each token has varying levels of activity, so a $3,000 buy has different implications for them. To compare fairly, I set each token's "normal level." The method was to break the 60 days into one-minute intervals (10:00–10:01, 10:01–10:02, etc.), measure the "eager buy minus eager sell" amount in each interval, and then find the typical value for each token. For AAPLx it was about $190, for METAx about $360. This means that a net pressure of $1,900 represents 10 times the normal level for AAPLx and only about 5 times for METAx. Therefore, when I say "10 times the normal level," it refers to the norm for that token within a one-minute window.
An unexpected finding was that in each transaction, both the buyer and seller agreed on the same price, with the key being who initiated the transaction. An eager buyer goes for the seller's higher ask, while an eager seller accepts the buyer's lower offer. Thus, in most exchanges, transactions initiated by buyers are typically slightly higher than the immediately preceding transactions initiated by sellers. However, on Kraken, they are often lower, as prices drifted between the two transactions. Kraken's prices also continue to drift when no one is pushing them. This is the first clue that something outside of Kraken is driving prices, like Nasdaq.
Score Results
Below is a comparison between October 28 and another Wednesday, October 14. On both days, NVDAx dropped about 1.8%. On October 14, the scoreboard matched the prices, with sellers engaging in more active transactions than buyers by $183,000, resulting in a price drop; on October 28, buyers engaged in more active transactions, yet the price still dropped.
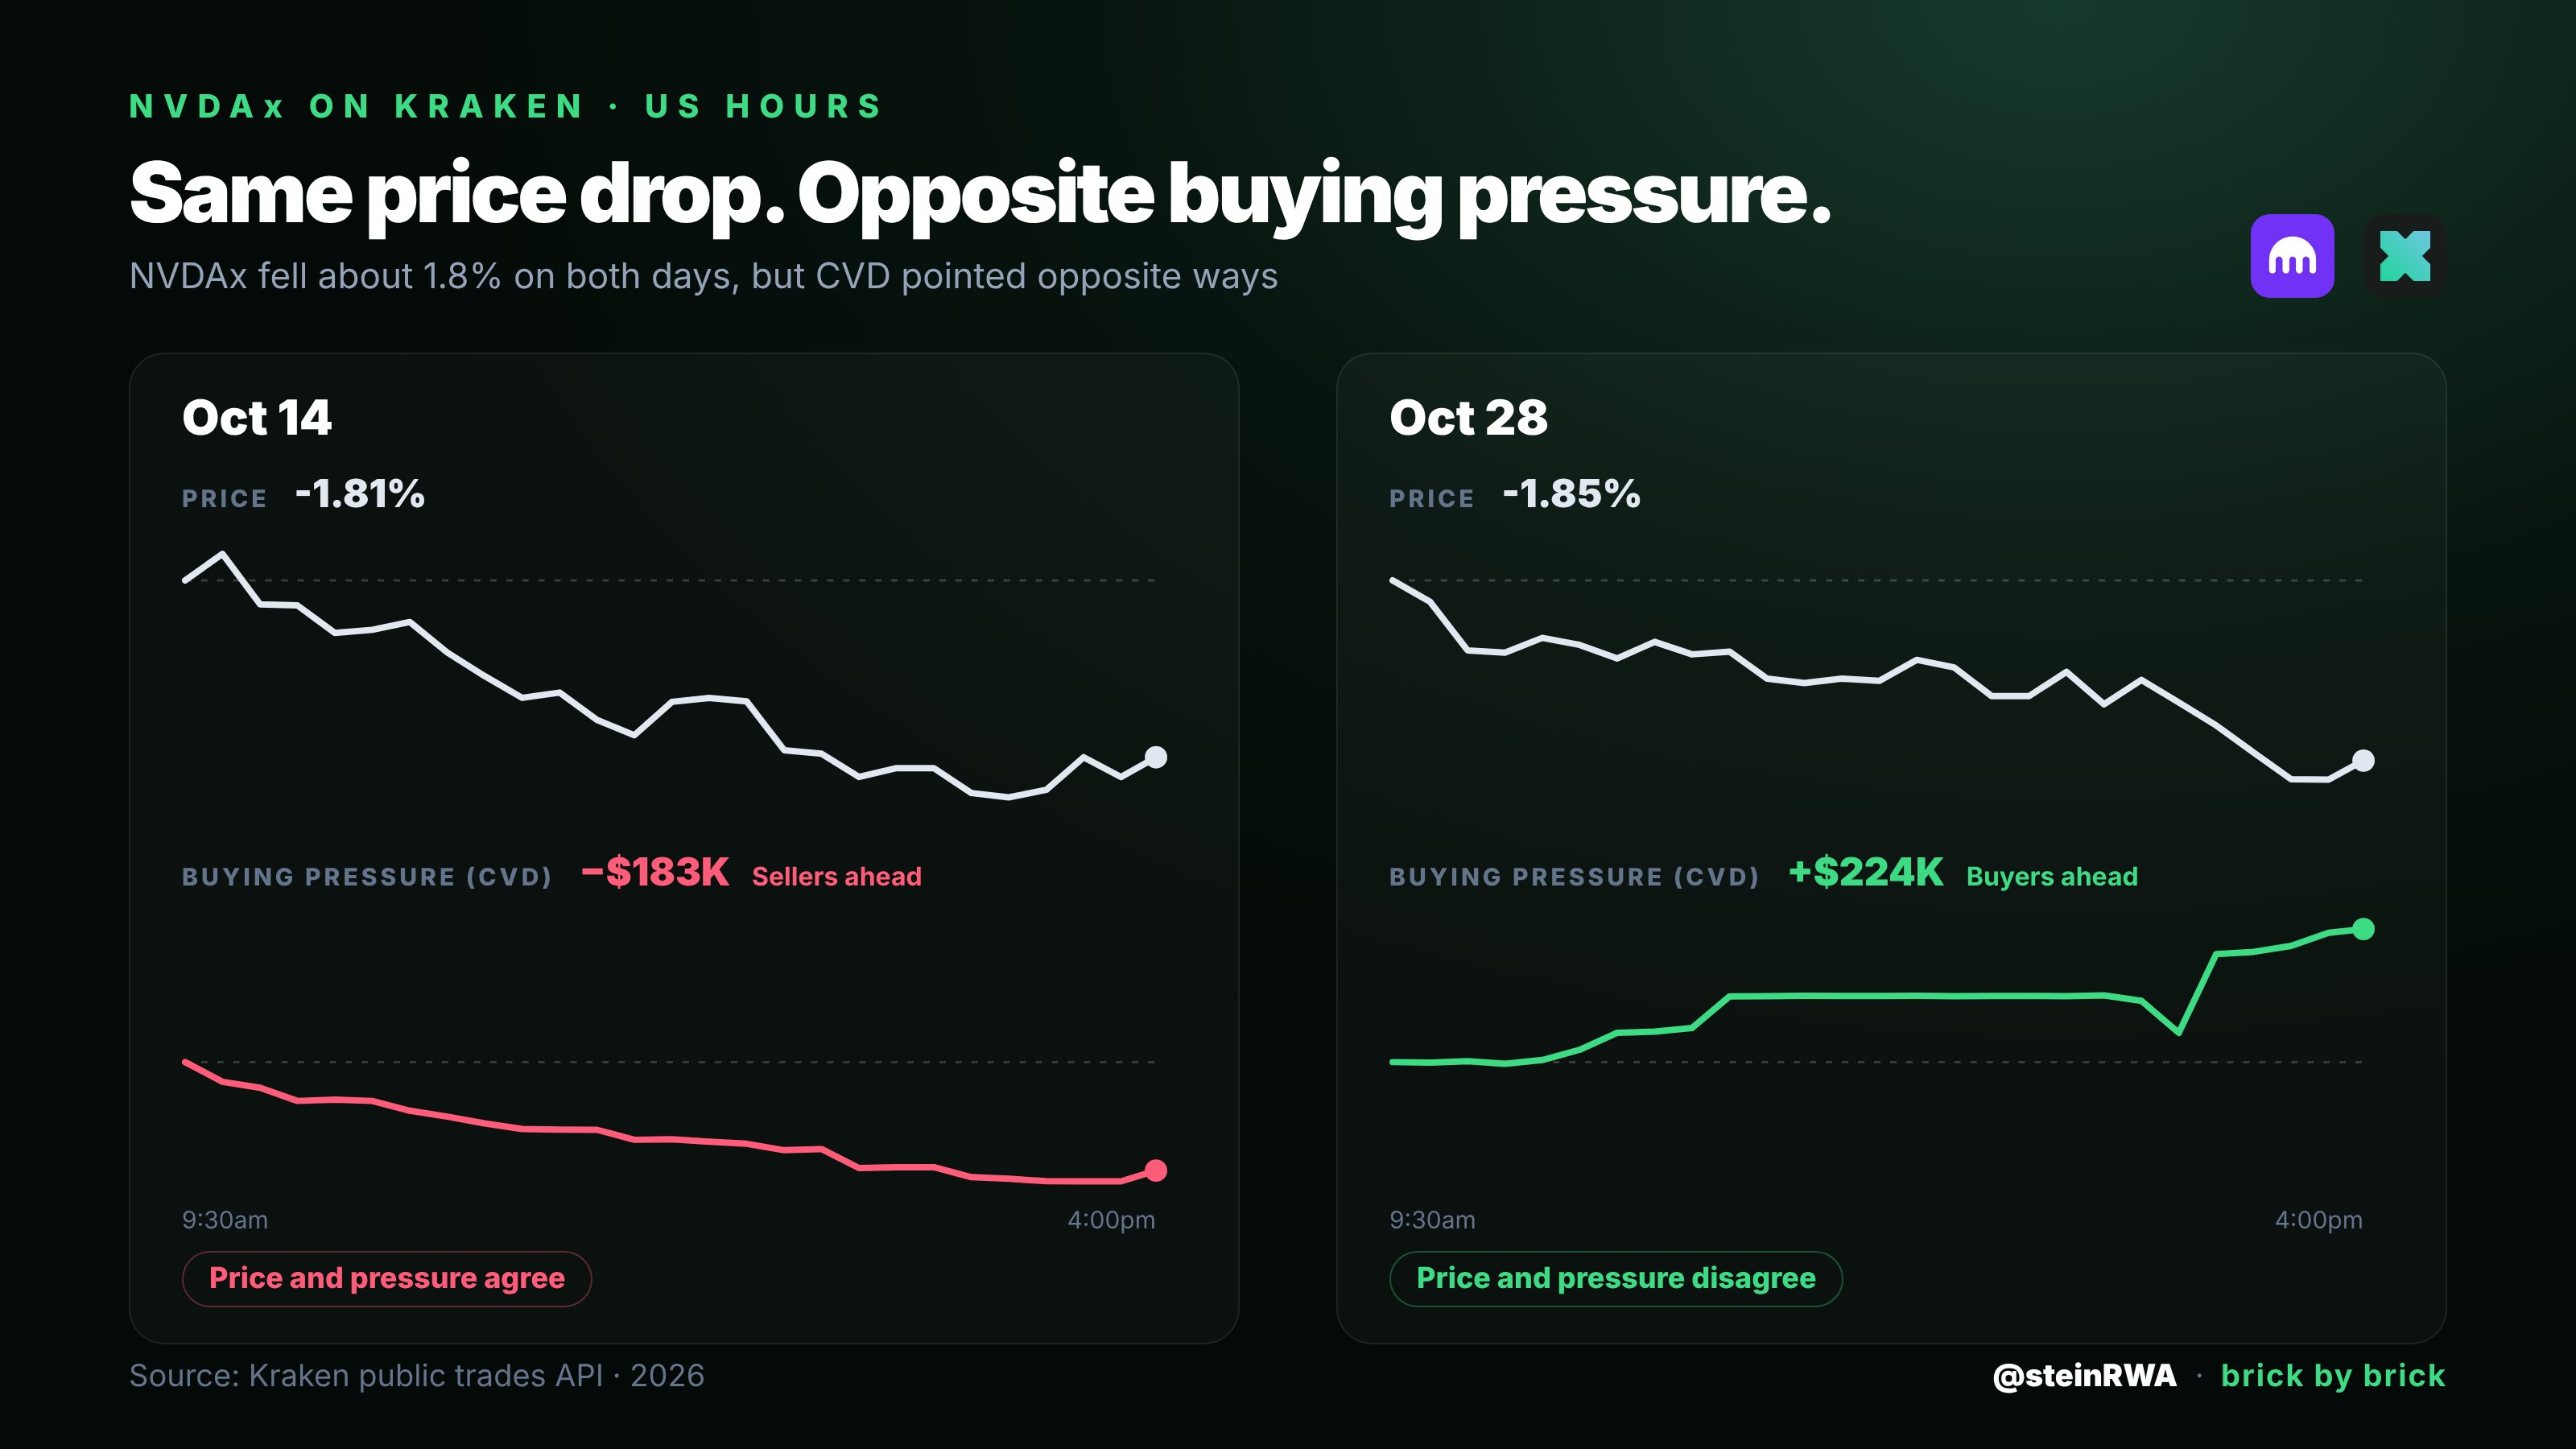
October 28 was not an isolated occurrence. I checked all 45 US trading days for six tokens (a total of 265 token days): of these, on 128 trading days, or about 48%, CVD and price were in opposite directions at the closing.
But weekends are different. When Nasdaq closes, the times where CVD moves in the same direction as prices are more frequent. In terms of a correlation measure from 0 to 1, weekends scored 0.24, while US trading hours scored 0.04.
Echo or Amplifier?
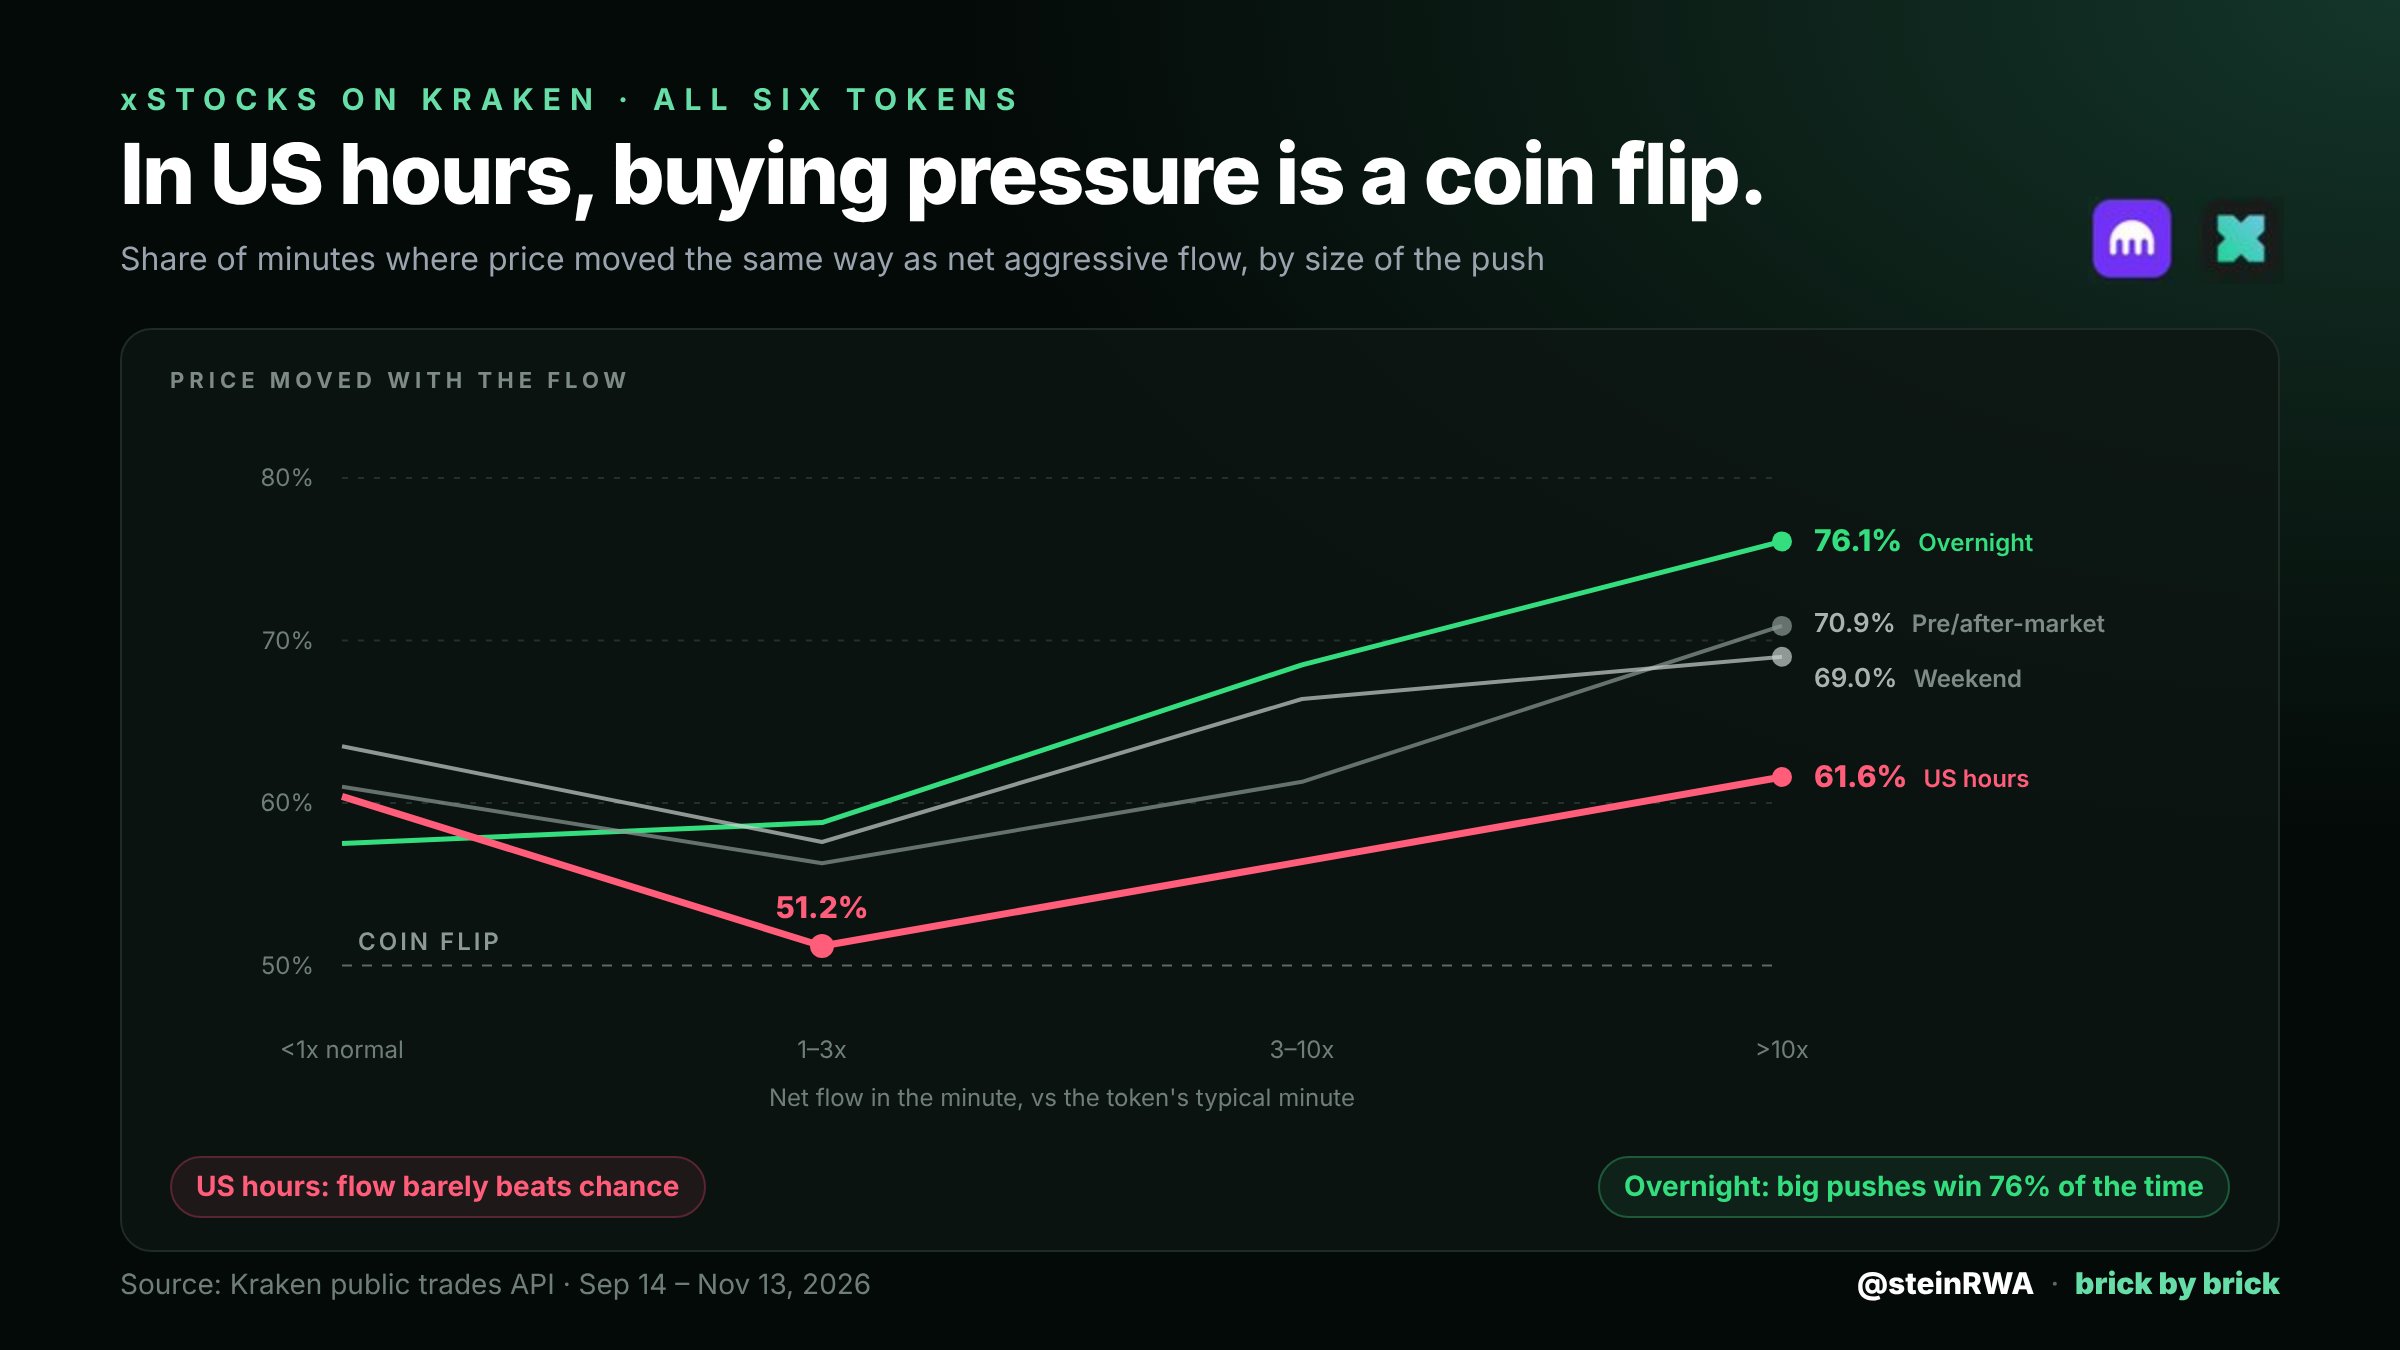
This is the core test. In every minute where buying pressure outweighed selling pressure (or vice versa), did the price move in that direction?
During US trading hours, under moderate pressure (1-3 times the normal level), prices only moved in the direction of the push 51.2% of the time, nearly the same as the probability of flipping a coin. During overnight periods, with strong pushes, prices moved in the direction of the push 76% of the time.
Buy Pressure Signals are only Effective in their Minute
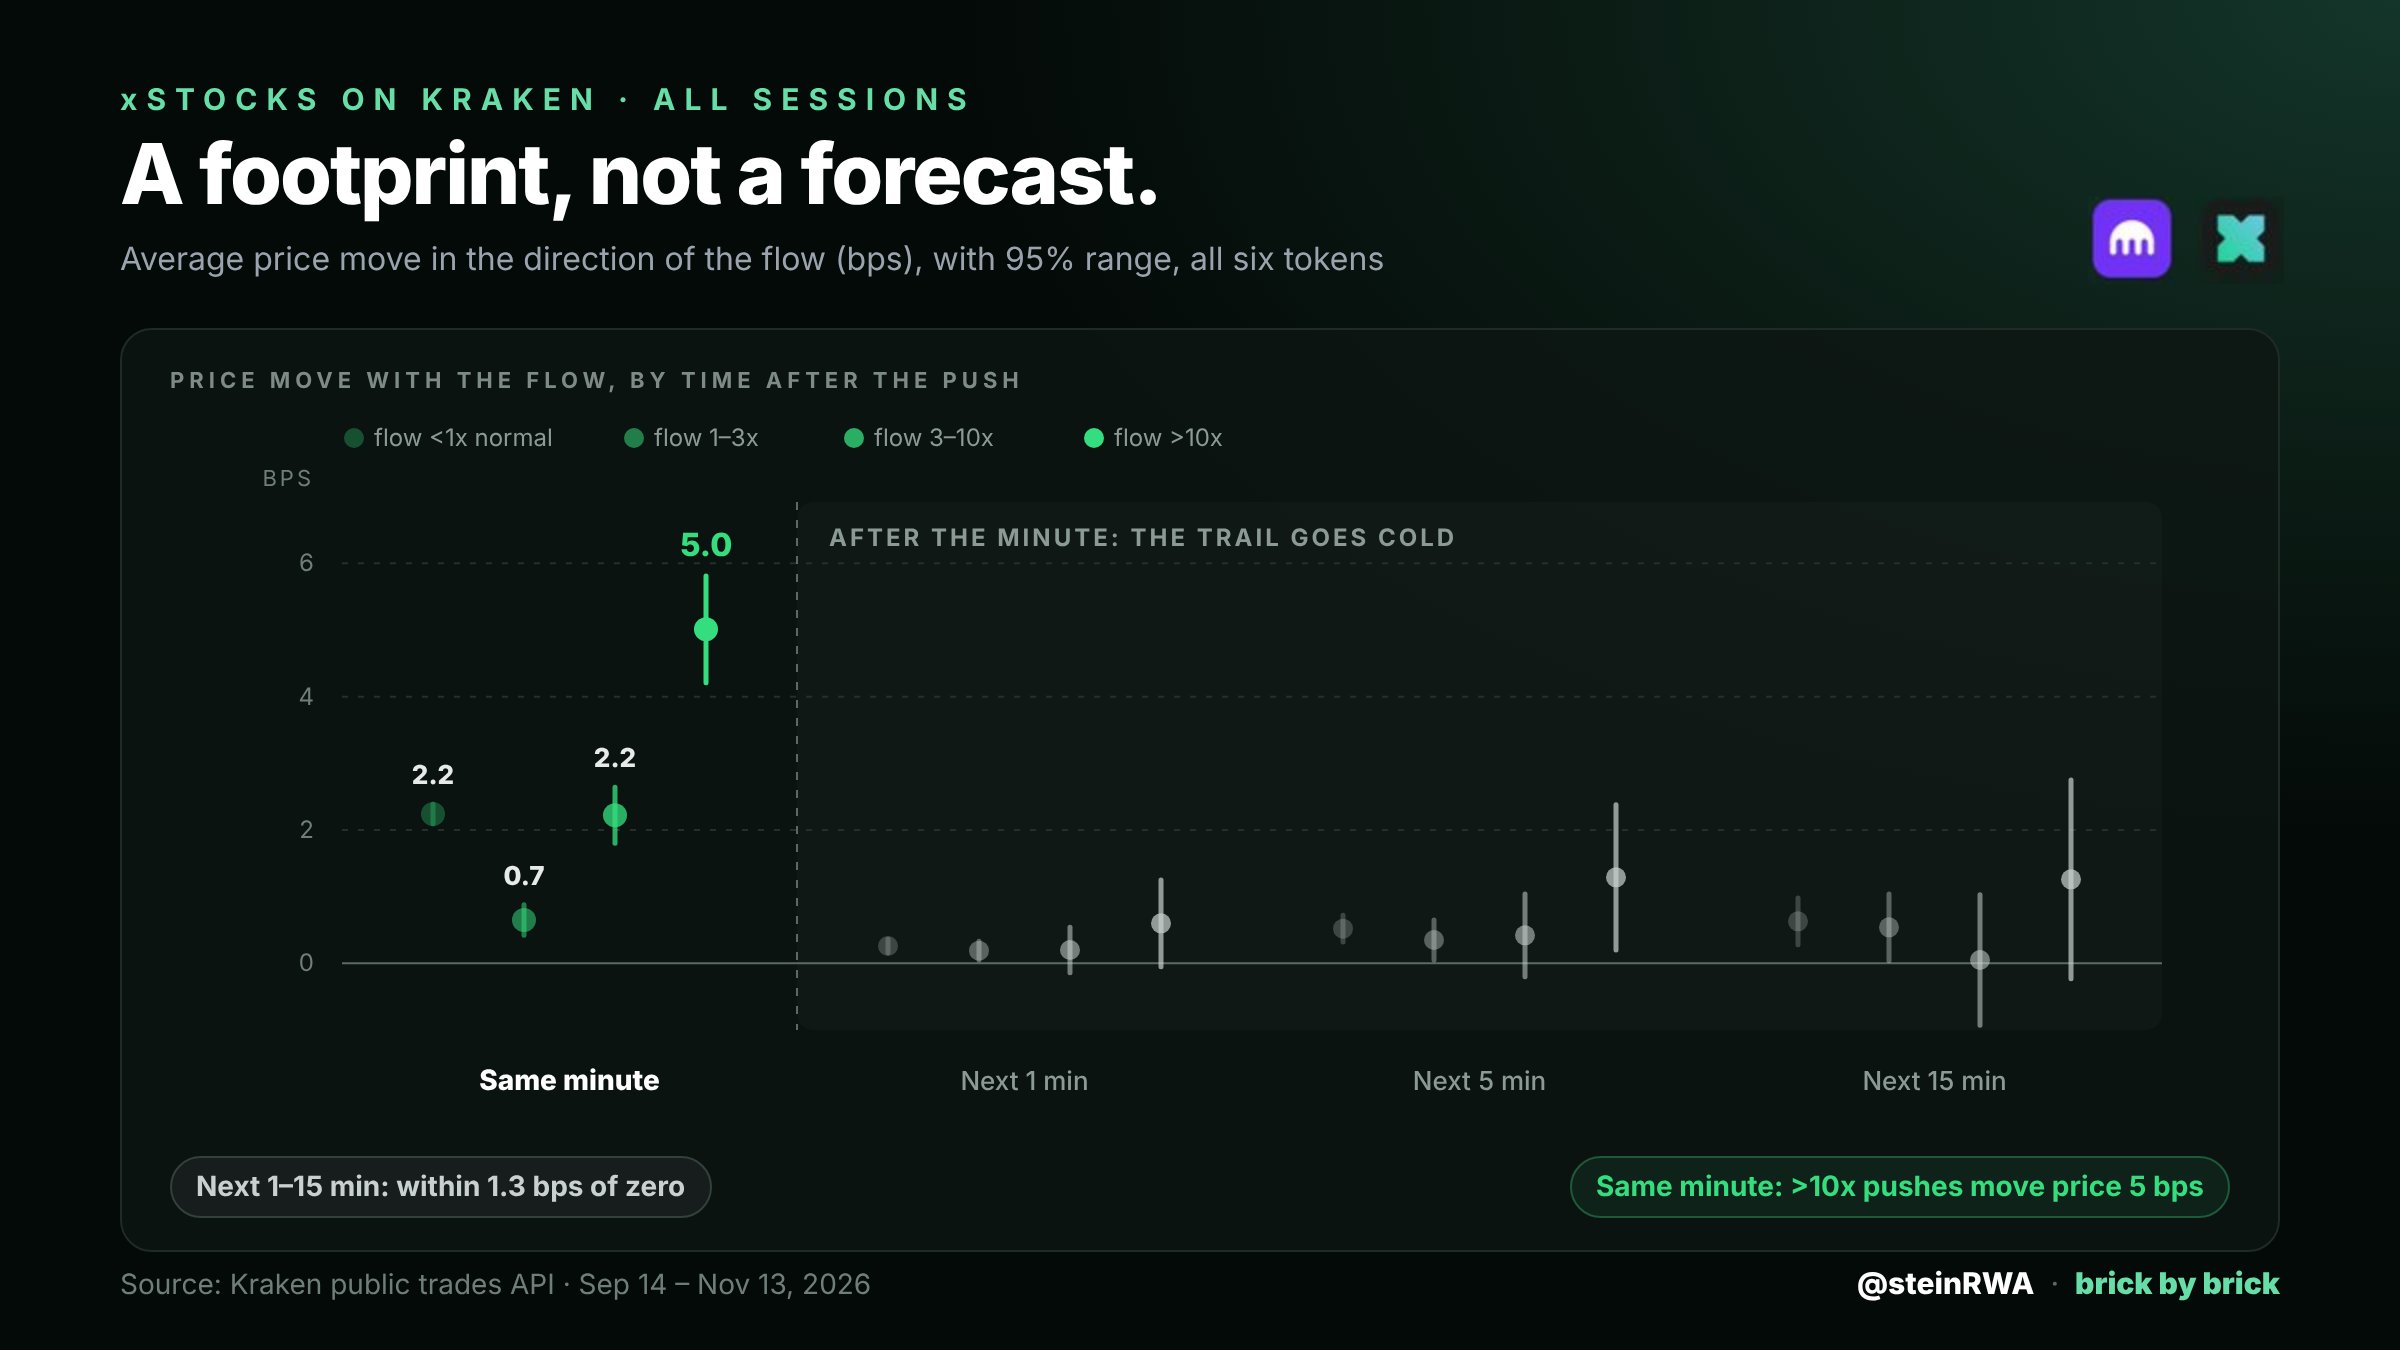
Buy pressure is like footprints on sand: it clearly tells you someone just walked here, but it does not tell you where they went next.
The strongest pushes (over 10 times the normal level) moved prices in their direction by 5 basis points in that minute. After that, the momentum from the buy side dissipated. In the next 1 minute, 5 minutes, and 15 minutes, the price only moved between 0.6 to 1.3 basis points.
During US trading hours, the duration has no effect. Observing for 1 minute, prices barely follow the buy pressure; extending to 1 hour, this connection almost disappears.
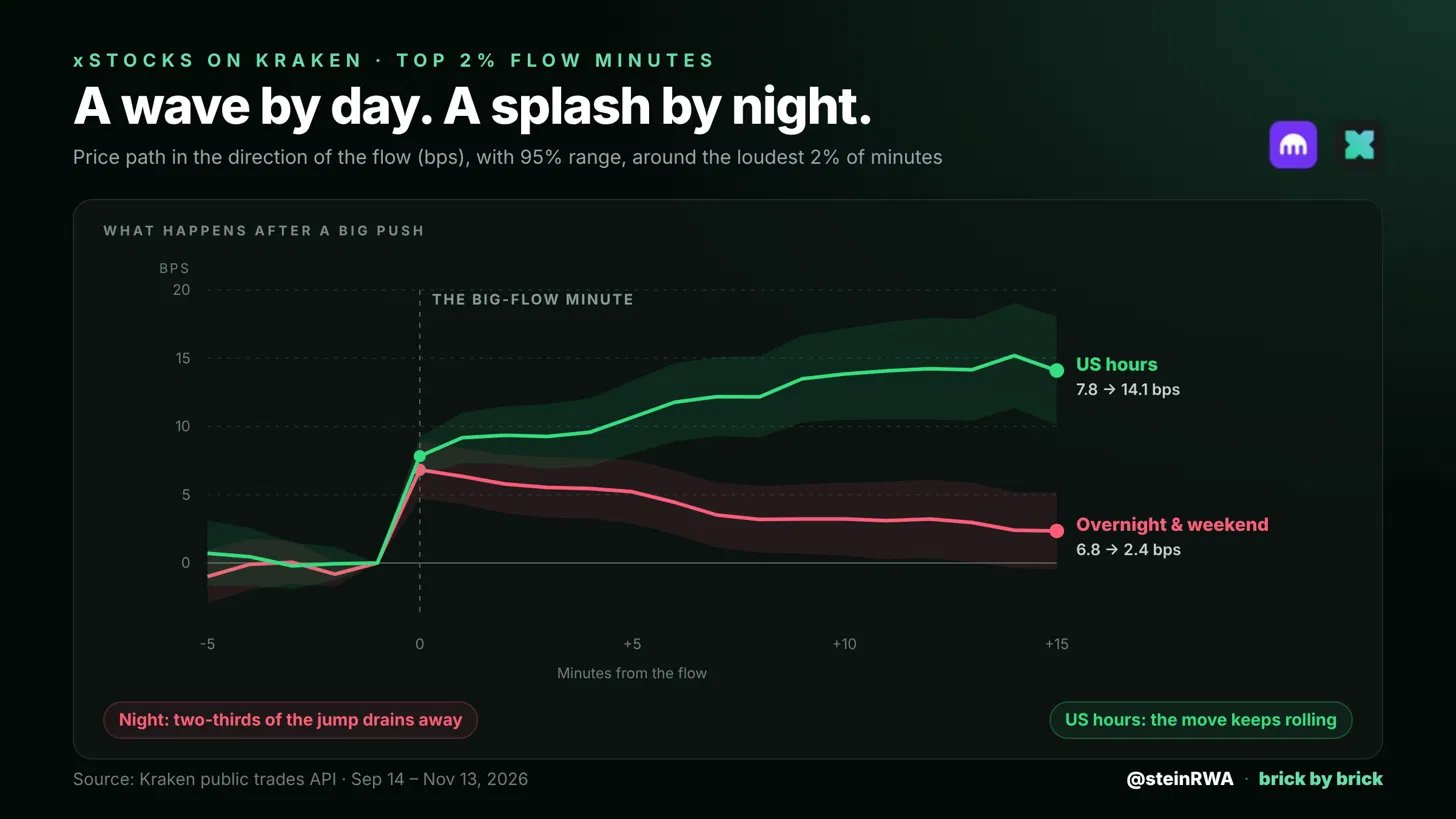
If you isolate the most extreme minutes for single-direction buying and selling (the top 2%), and then track prices for 15 minutes afterwards:
- During US trading hours: When price jumps by 7.8 basis points in 1 minute, it then continues in the same direction to 14.1 basis points. Because Kraken's flow is following the last real market movement from Nasdaq.
- During overnight/weekend: When the price jumps by 6.8 basis points in 1 minute, it then retracts to 2.4 basis points. Without Nasdaq to follow, a large order can push a thin market; afterwards, prices gradually retreat.
This shows that significant peaks occurring during the day are signals worth paying attention to, while significant peaks at night mostly tend to retrace.
The Same Buy Pressure, Why Sometimes Goes Up, Sometimes Goes Down?
Two traders applying similar buy and sell pressures can lead to completely different results. It's like pushing two doors with the same effort: one opens, while the other is locked, which is not apparent from the outside.
I filtered all minutes where pressure from one side was about the same, resulting in about $1,720 more in buy side. In these 100 minutes, prices moved in the direction of the push about 64 times and reversed about 36 times. Moreover, in a typical 1 minute, the price moved very little, about 0.01%. Therefore, the magnitude of the push itself tells you very little.
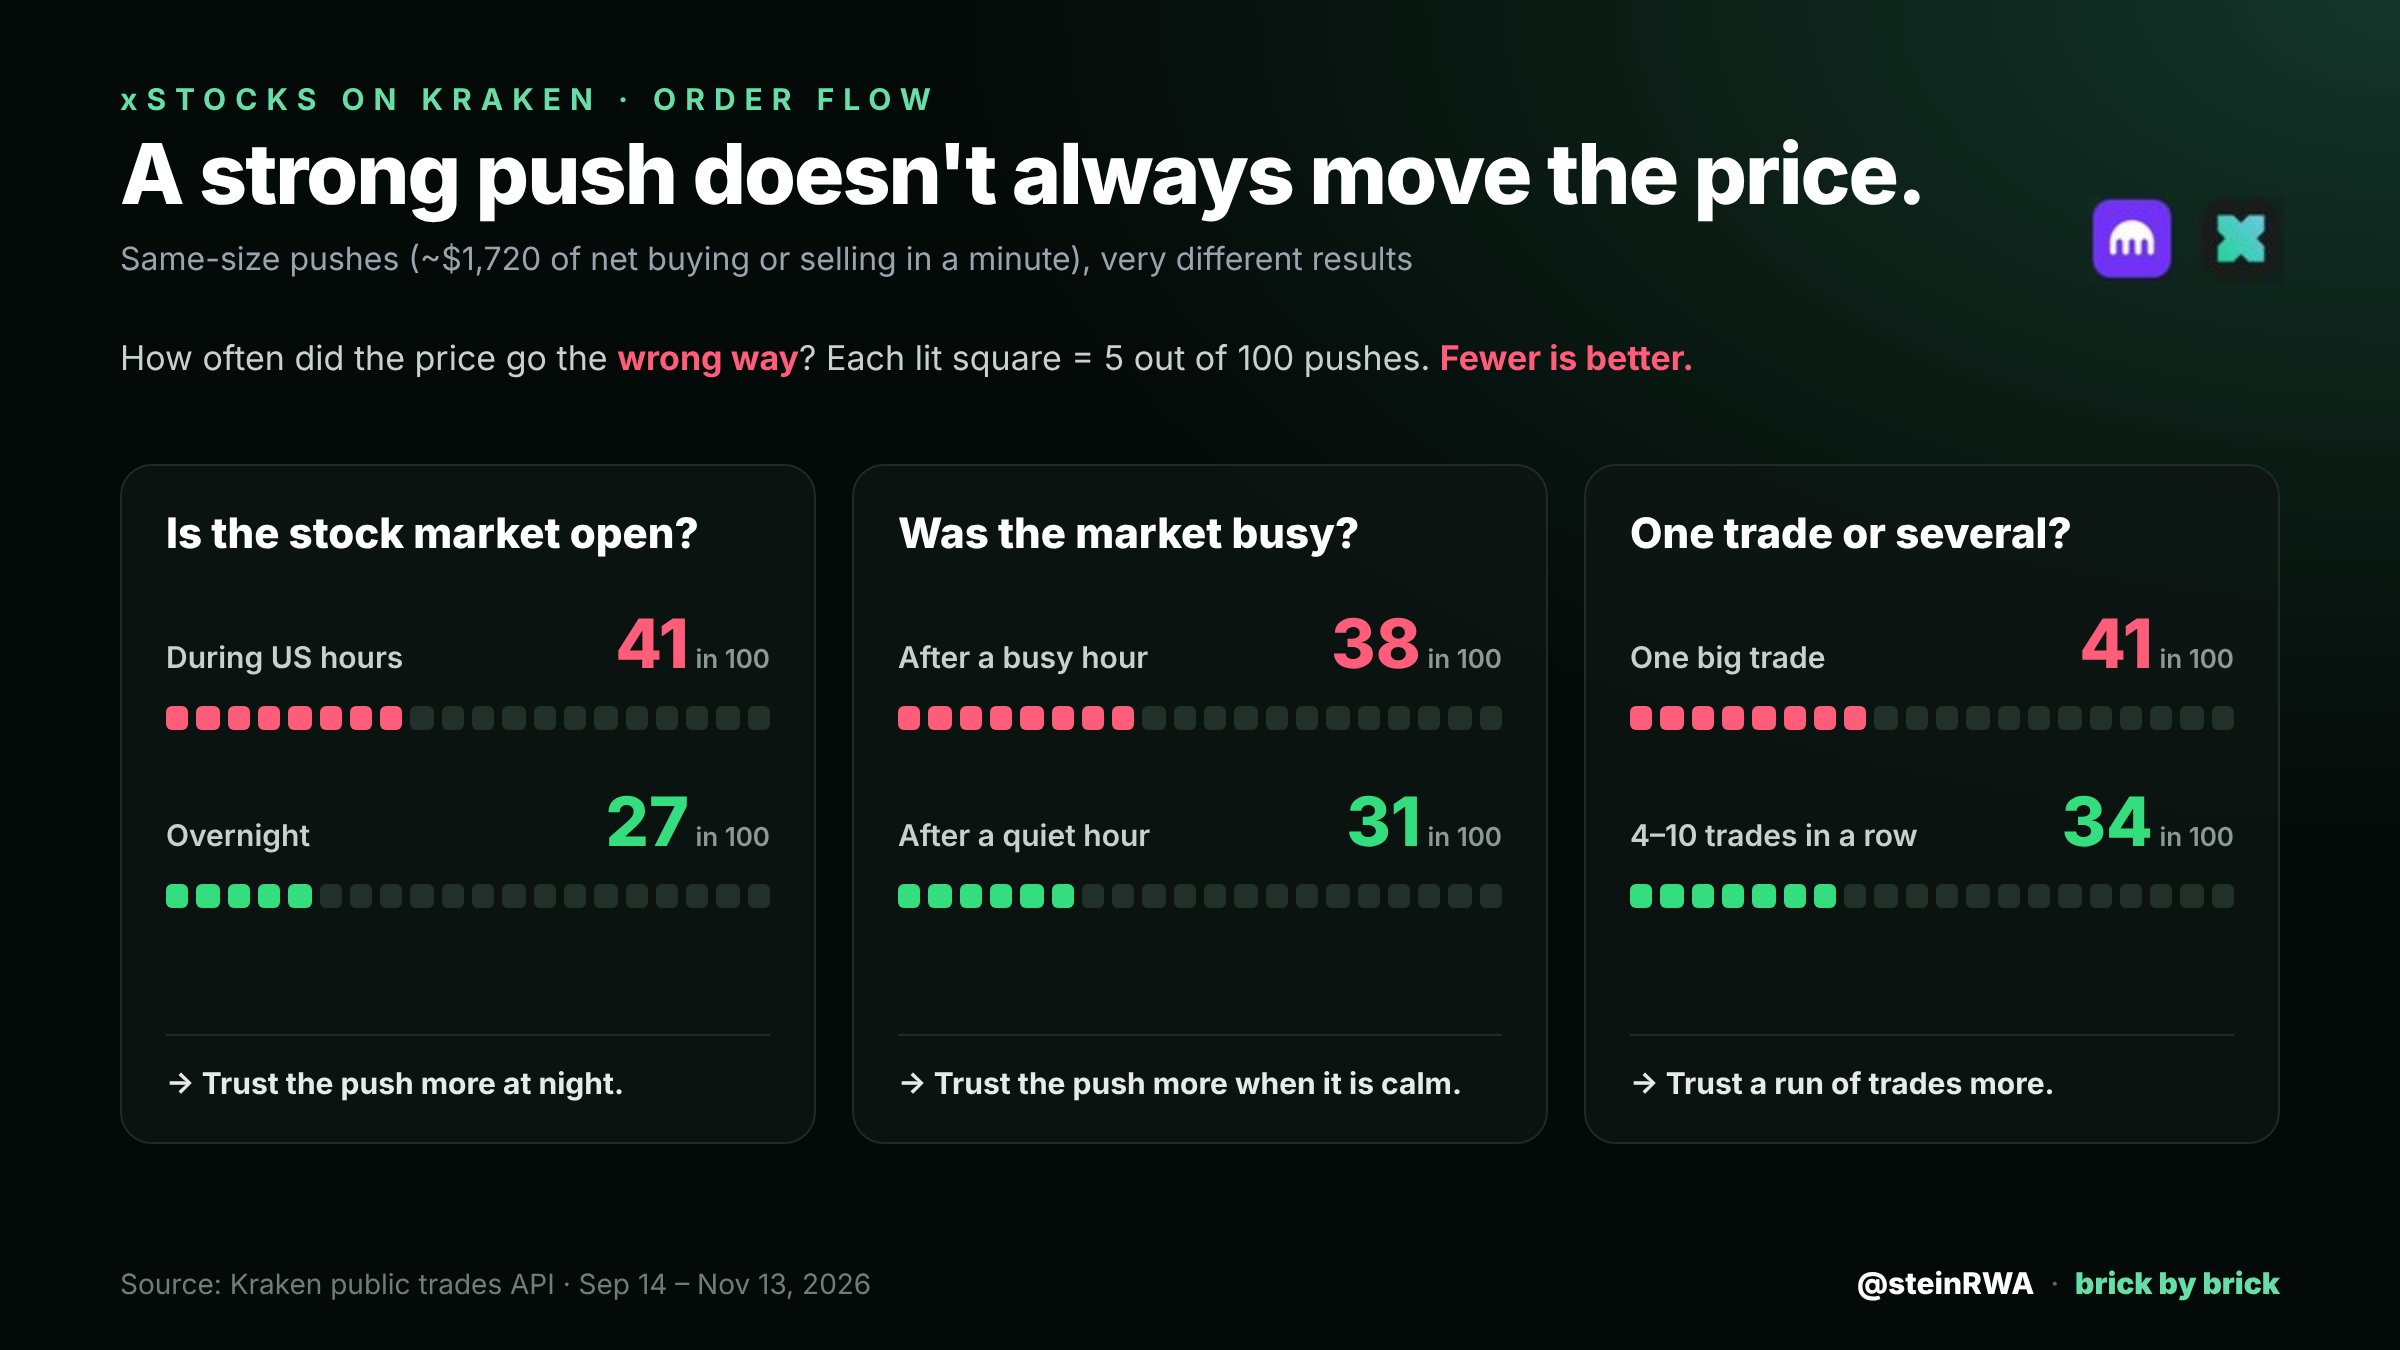
Three things can tell you which door is being pushed:
- Is Nasdaq open? During US trading hours, 41% of pushes go against the price direction; overnight only 27%.
- Is this 1 minute busy? After a quiet hour, 31% of pushes go against the price direction; after a busy hour, it’s 38%, because when busy, the price tags change more frequently.
- Is it one transaction or several transactions? A single transaction moves the median price by 0.5 basis points; consecutive transactions involving 4 to 10 orders across various price levels move the median price by 2.1 basis points.
These are clues about what lies behind the door, not visibility. To see behind the door directly, you need an order book, and Kraken does not retain order book history.
In these scenarios, buy pressure is worth considering as a signal:
- When the US stock market closes, especially overnight and on weekends, Kraken's own traders have a greater influence on pricing.
- Single-direction pushes exceeding 10 times the normal level have a 66% chance of the price moving in that direction, while moderate intensity pushes only have a 55% chance.
- Connections of multiple transactions sweeping away various price levels
- An unexpected large order
The conclusion is: during US trading hours, Kraken's order flow is an echo of the last market situation from Nasdaq; during the overnight and weekends, it acts as an amplifier, but part of the sound it produces may dissipate.
免责声明:本文章仅代表作者个人观点,不代表本平台的立场和观点。本文章仅供信息分享,不构成对任何人的任何投资建议。用户与作者之间的任何争议,与本平台无关。如网页中刊载的文章或图片涉及侵权,请提供相关的权利证明和身份证明发送邮件到[email protected],本平台相关工作人员将会进行核查。


