Liying Chat Coin: 11.17 Bitcoin (BTC) and Ethereum (ETH) Latest Market Analysis
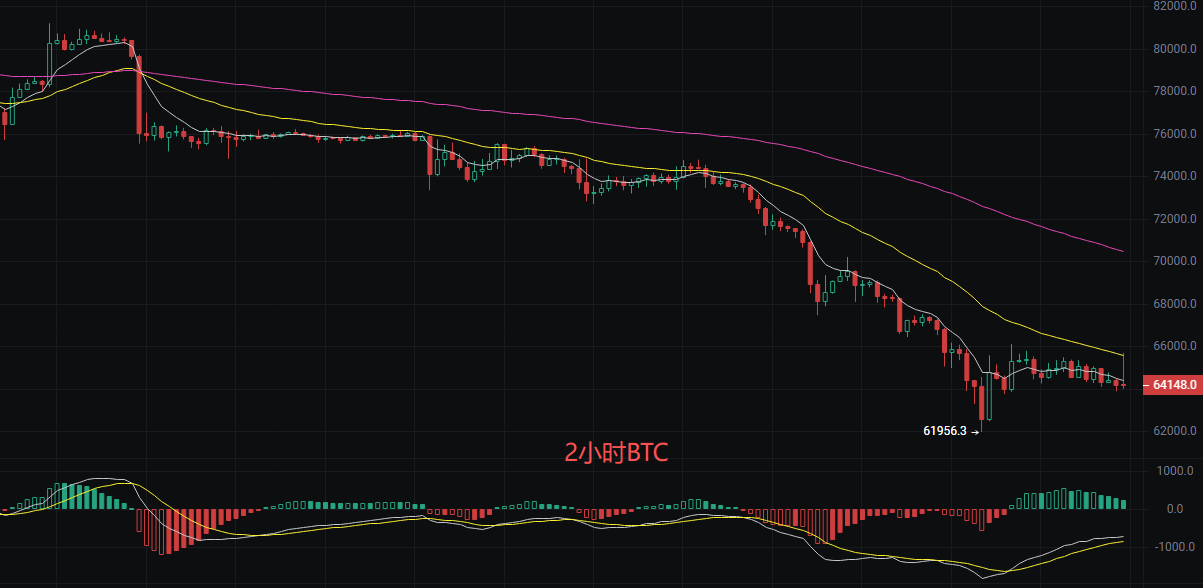
Family! The current price of Bitcoin is 64150, now the price is 64238, exactly stuck at the crossroads after the drop. The overall direction is indeed going bad, and although there is a small rebound in the short term, do not rush to call a reversal. In the market situation after such a big drop, it is most taboo to chase up and down; we must keep our nerve and wait for the market to digest the sentiment. Only then can we follow the intentions of the main capital to make trades; preserving the principal is the kingly way. From the 2-hour K-line perspective, we are currently in a period of oscillation and recovery after a sharp drop. The height of the short-term rebound of the moving average is extremely limited, and the overall trend is still constrained by the long-term moving average's bearish pressure. The MACD indicator shows signs of a bottom divergence, but the two lines are about to dead cross, indicating weak momentum, suggesting that the rebound may fail at any time. After touching the lower rail at 63382, the price has recovered, and is currently struggling below the middle rail at 64625. The Bollinger Bands are opening downwards, and the bearish trend remains unchanged; 64625 is a strong resistance level in the short term.
Long and Short Strategy
Short: Open a short position near 64800-65000 during the rebound, stop-loss above 65600, target 62000.
Long: Light long position when it stabilizes at 63500 during the pullback, stop-loss at 61800, target 64500.
Ethereum
Family, the current price of Ethereum is 1805. In the chart, the K-line has formed a very standard flat bottom oscillation with several long lower shadow lines. What does this indicate? It indicates that in the range of 1700-1750, there is a very strong buying force holding firm; the bearish bullets have been almost exhausted. The current market situation is like a spring that has been pulled to its limit, gathering strength, ready to rebound at any time. The moving average system shows a typical bearish arrangement, while the MACD bullish indicator holds the strongest confidence. The MACD below the zero axis has already formed a clear bottom divergence pattern. The Bollinger Bands are in a state of extreme contraction, and after touching the lower rail at 1765, the K-line strongly recovered, currently struggling near the middle rail at 1809. The middle rail is the watershed between long and short; once it breaks through the middle rail 1852 with volume, the Bollinger Bands will open, and a one-sided bullish trend is imminent.
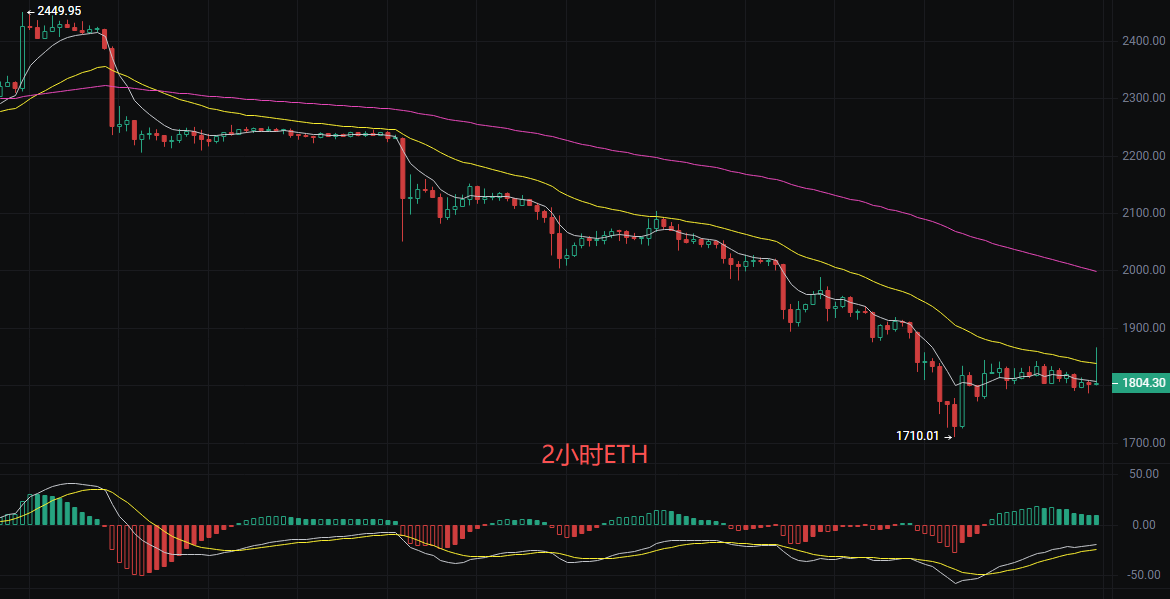
Entry Point: Buy in batches if it pulls back without breaking 1780-1790. Stop-loss: Stop-loss if it breaks today's low of 1760.
Target: 1852, 2000.
Entry Point: Enter short positions when it rebounds to 1950-1980. Stop-loss: Exit if it strongly breaks through 2020. Target: Look back at the 1850-1800 level.
The above content is exclusively original from Liying, please indicate the source when reprinting! There may be delays in article publication review, and market conditions change rapidly; the above suggestions are for reference only, risk is borne by the reader.
Warm reminder: The above content is solely from Liying's WeChat official account: Crypto Training Camp, created by Liying. The advertisements at the end of the article and in the comments section are unrelated to the author; please discern carefully, thank you for reading.
免责声明:本文章仅代表作者个人观点,不代表本平台的立场和观点。本文章仅供信息分享,不构成对任何人的任何投资建议。用户与作者之间的任何争议,与本平台无关。如网页中刊载的文章或图片涉及侵权,请提供相关的权利证明和身份证明发送邮件到[email protected],本平台相关工作人员将会进行核查。