Author: Saylor, Depth Wave TechFlow
Depth Wave Introduction:
On November 16, Michael Saylor, founder of MicroStrategy, publicly recommended the official Bitcoin data dashboard and highlighted four key indicators for evaluating the current market situation. The data shows that the current price of Bitcoin has fallen below the 200-week moving average, a position only held 5.6% of the time in history; over the past 30 days, the spot ETF has seen a cumulative net outflow of $2.919 billion, and the fear and greed index has simultaneously dropped to an extreme fear zone of 10. Meanwhile, Bitcoin's market cap share has risen to 66.9%. This indicates that defensive withdrawals by off-exchange institutions have sent short-term market sentiment to a freezing point, while long-term quantitative valuation indicators have also entered a historically low range.

In the midst of intense market long and short battles, Bitcoin's biggest bulls choose to measure the cycle using the most basic on-chain and macro data.
On November 16, Michael Saylor, founder of MicroStrategy, posted on social platform X stating that to see clearly what is happening with Bitcoin, one must first look at the data. He also published the latest screenshot of the MicroStrategy official Bitcoin dashboard and deliberately circled four core data points with an orange border, covering long-term cost averages, institutional fund inflows and outflows, sentiment preferences, and ecological market cap structure.
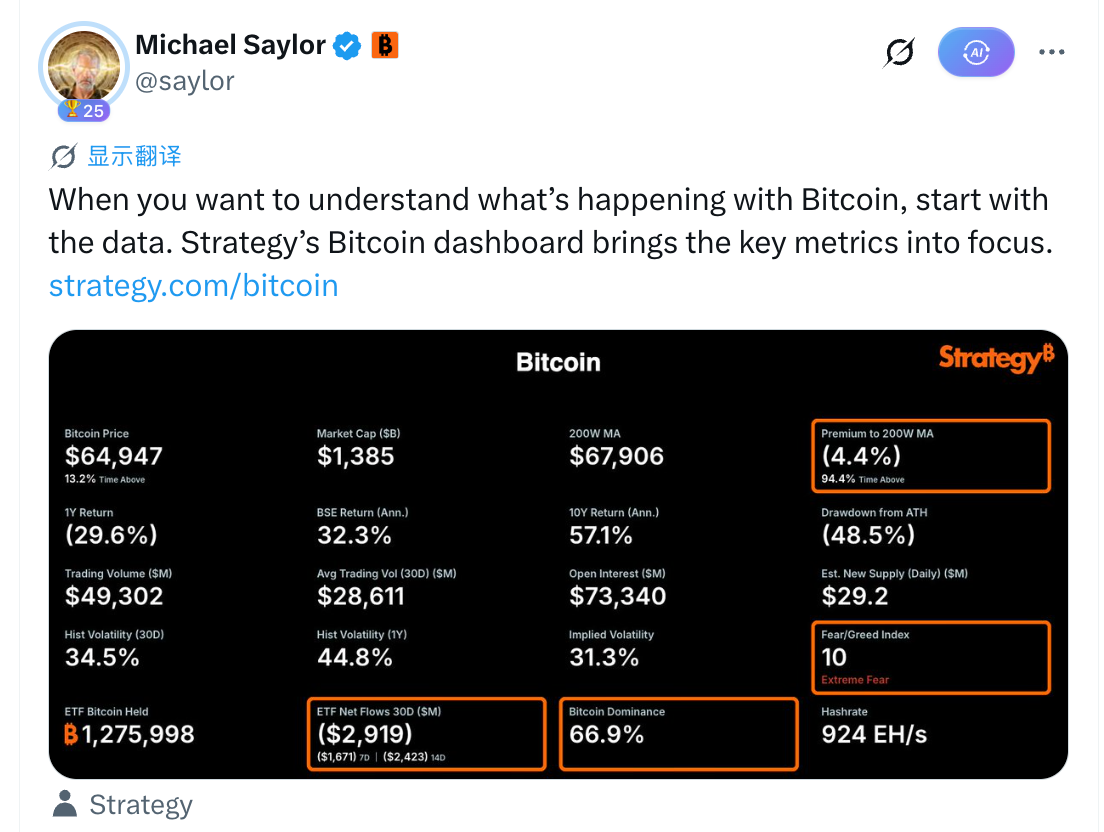
Current price falls below the 200-week moving average, only 5.6% of historical time spent at this level
The first marked item on the dashboard is the price deviation over a long cycle.
According to the MicroStrategy dashboard data, the current Bitcoin price is $64,947, while its 200-week moving average (200W MA) is at $67,906, with a price premium rate of -4.4% against the 200-week moving average.
The data also shows that throughout Bitcoin's historical trading time, 94.4% of the time the price has been above the 200-week moving average. In crypto quantitative models, the 200-week moving average is often seen as a long-term valuation watershed in cycles of alternating bull and bear markets. Falling below this average often indicates that the secondary market price has deeply retraced short to medium-term speculative bubbles, returning near the underlying holders' long-term average cost line.
ETF $2.91 billion outflow in 30 days, fear index drops to 10
Corresponding to the breaking of the long-term average line is the continuous withdrawal of funds from off-exchange institutions.
According to the fund flow statistics of ETFs from MicroStrategy, in the past 30 days, the cumulative net outflow from Bitcoin spot ETFs has reached $2.919 billion. Looking at a shorter time frame, in the last 14 days, the outflow has been $2.423 billion, and in the last 7 days, it has been $1.671 billion, indicating that institutional fund reductions have been concentrated recently.
The significant pressure on the funds has directly transmitted to market sentiment. The latest reading of the Fear and Greed Index on the dashboard is only 10, classified as "Extreme Fear." This indicator integrates volatility, trading volume, social media heat, and Google Trends, and a drop to 10 indicates that the market's selling and risk-averse sentiment has cleared to a stage extreme.
However, the derivatives market has not completely ceased operations. Dashboard data shows that the current open interest of Bitcoin futures contracts across the network remains as high as $73.34 billion, reflecting that funds from both bulls and bears are still heavily concentrated around the $64,000 mark.
Market share rises to 66.9% against the trend, funds accelerate to cluster during withdrawal
The fourth dimension specifically marked is the internal fund structure differentiation within the crypto ecosystem.
The data shows that the current Bitcoin dominance rate has risen to 66.9%. In terms of overall market performance, Bitcoin's current price has retreated 48.5% compared to its historical all-time high (ATH), with a cumulative return rate of -29.6% over the past year.
This contrast indicates that against the backdrop of a significant pullback across the entire crypto asset space, funds are comprehensively retracting from altcoins and retreating to Bitcoin in search of liquidity refuge. Bitcoin's market share approaching 67% is not due to its absolute increase, but rather as a passive result of the more severe liquidity squeeze faced by altcoins.
The indicators that Saylor pointed out are actually the kind of well-known yet often disregarded metrics that most people do not discipline themselves to monitor daily. However, when viewed together, they indeed combine long-term valuation averages, institutional fund flows, market sentiment, and funding preferences.
Understanding these four sets of data also clarifies the true position of the current market in the long cycle. With AI monitoring not being a difficult task today, for traders still in the market, reviewing this data through an AI daily report makes it easier to gauge the market's temperature.
免责声明:本文章仅代表作者个人观点,不代表本平台的立场和观点。本文章仅供信息分享,不构成对任何人的任何投资建议。用户与作者之间的任何争议,与本平台无关。如网页中刊载的文章或图片涉及侵权,请提供相关的权利证明和身份证明发送邮件到[email protected],本平台相关工作人员将会进行核查。


