Author: matteo
Translation: Shenchao TechFlow
Introduction by Shenchao: With the deep liquidity of long-tail assets, Hyperliquid built a core moat in its early days. However, data from the complete order book over the past 18 months indicates that this advantage is clearly fading, as its dollar depth within 5 bp has shrunk by 84.6% in the past year.
The author matteo compares samples of common altcoins from Binance and OKX, focusing on quote costs, depth index, and account structure, revealing how the rebate advantages of large market makers and the L1 congestion quota mechanism continue to squeeze small market makers, further threatening the long-term liquidity of HIP-4 prediction markets.

In recent months, due to the launch of an undisclosed product, we have spent a significant amount of time analyzing the liquidity of various trading tools across all DEXs. Based on over a year and a half of complete order book data accumulated from 0d Labs, we discovered an unexpected phenomenon.
Looking at the entire crypto long-tail asset market, liquidity is becoming increasingly thin. We initially anticipated this volatility to appear around October 10, but it now seems that the entire crypto market has yet to truly recover from it.
Furthermore, we have recently heard numerous complaints from trader friends closely related to us, stating that competition on Hyperliquid is becoming increasingly difficult, with a clearer trend of centralization where winners take all: from Wintermute monopolizing reading priority fees to trading fees and L1 network congestion creating nightmares for small market makers.
Thus, I decided to analyze the changes in Hyperliquid's liquidity in depth, to see if there is a causal relationship between the worsening situation of small market-making teams and the decline in platform liquidity. After all, in the early days, the introduction of long-tail assets with deep liquidity was the core of Hyperliquid's moat.
Establishing a Control Benchmark
First, we need to establish a benchmark against the entire crypto market. Liquidity may indeed be thinning overall, but if this is a universal phenomenon across the industry, we must distinguish between what is a market-wide issue and what is specific to a single platform.
A valid benchmark for measuring the liquidity of global altcoins is Binance. To this end, we selected 86 assets that were trading on both platforms from November 1, 2025, to November 1, 2026, and provided leverage of less than 10 times, as our long-tail asset sample.
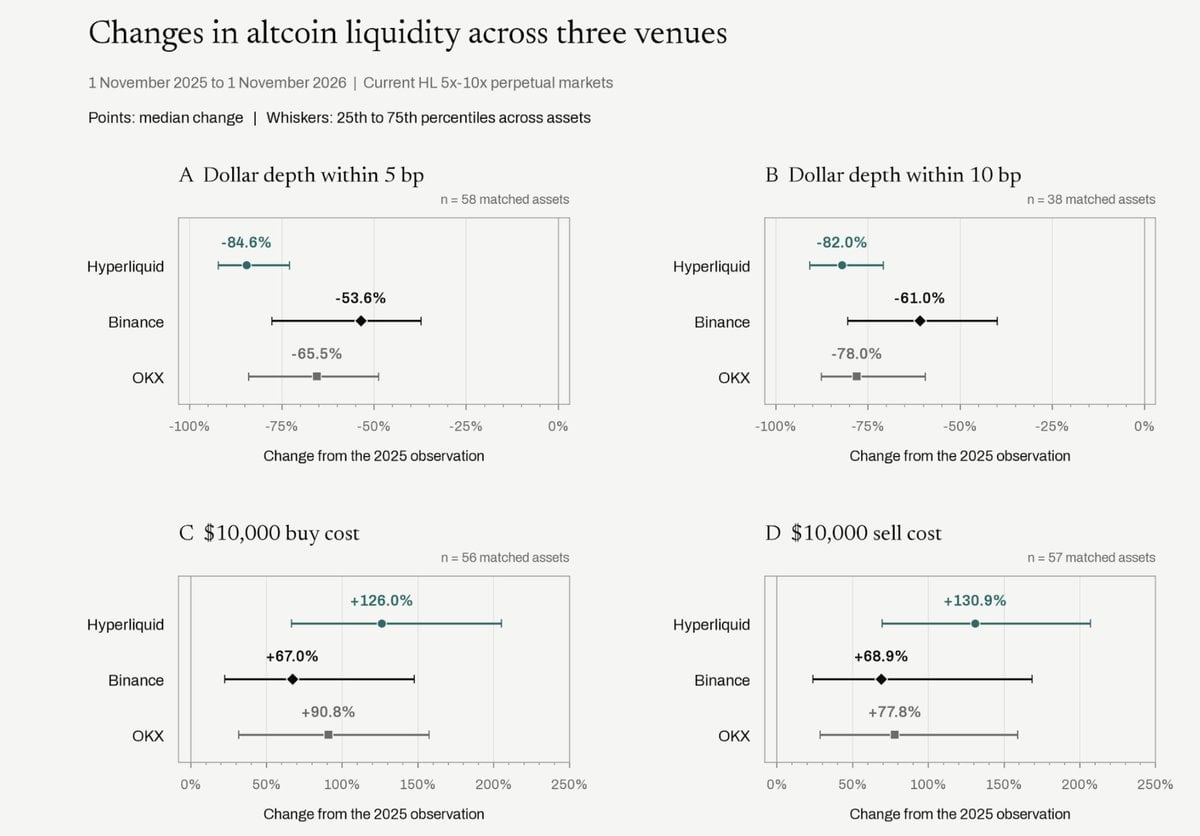
Figure: Comparison of liquidity changes in altcoins across three major platforms from November 1, 2025, to November 1, 2026, covering 5 bp and 10 bp dollar depth and $10,000 buying and selling costs (median and interquartile range)
Among the 38 markets compared in the 10 bp range, the median dollar depth of Hyperliquid has decreased by 82%, while Binance and OKX decreased by 61% and 78%, respectively, showing a significant difference in the rate of decline.
Of course, the drop in token prices can explain part of the shrinkage in dollar depth, but we also need to further confirm whether the number of tokens listed at these price levels has declined simultaneously.
To isolate the influence of the market cap and clarify the unique changes within Hyperliquid itself, I divided the depth of each asset on Hyperliquid by the corresponding depth on Binance, comparing the value before and after a year. At 5 bp depth, the median of this ratio has decreased by 57.5%.
In other words, even when comparing the same tokens, Hyperliquid has lost a significant amount of liquidity relative to Binance. It should be noted that this ratio is calculated for each market individually before taking the median, rather than simply dividing the medians of the two platforms directly.
In the later sample, if one wanted to buy $10,000, the estimated impact cost median measured on the order book before deducting fees is 5.21 bp on Hyperliquid, while it is only 2.95 bp on Binance. For an order of this size, the corresponding costs would be $5.21 compared to $2.95.
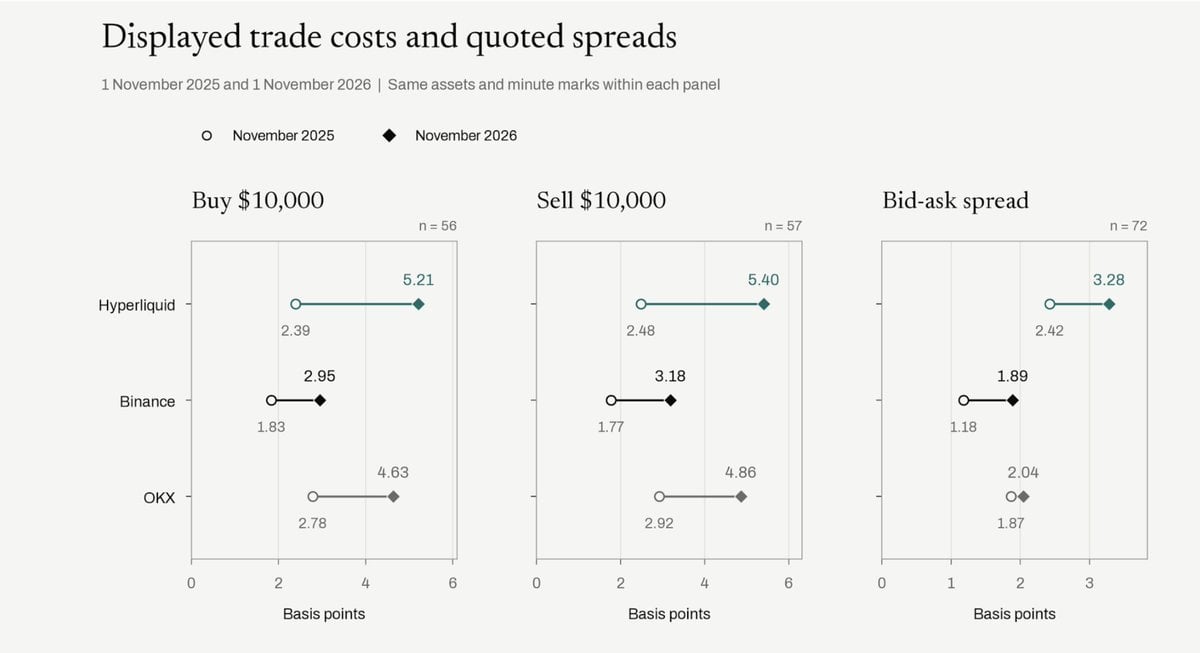
Figure: Comparison of transaction costs and median bid/ask spreads for buying/selling $10,000 on three major platforms from November 1, 2025, to November 1, 2026 (unit: basis points)
The bid/ask spread is, interestingly, a somewhat telling counterexample. When calculated proportionally, the widening of Binance's spread is actually somewhat greater, yet Binance not only starts with a narrower spread but also ultimately converges to a narrower spread level than Hyperliquid.
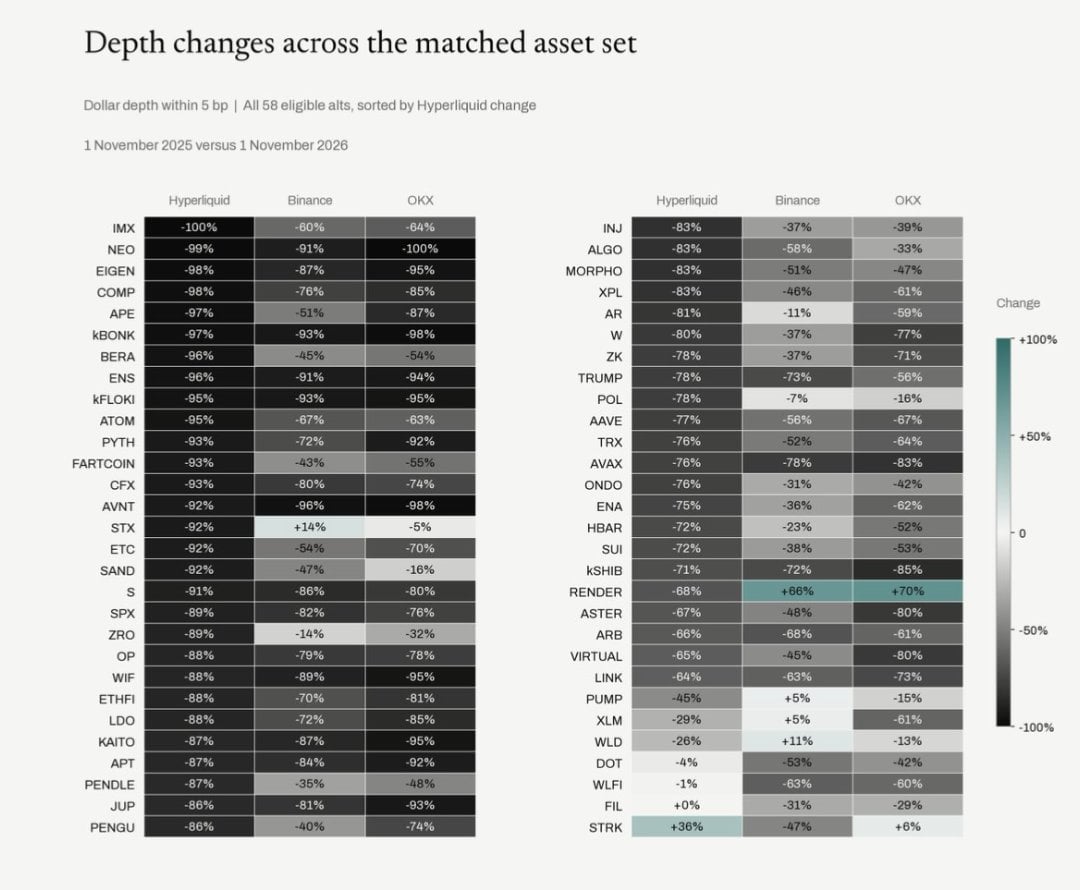
Figure: Heatmap of changes in dollar depth within 5 bp of 58 matched altcoins across three major platforms (comparison of November 1, 2025, to November 1, 2026, sorted by the shrinkage of Hyperliquid)
Issues Near Market Midpoints Are Most Prominent
The most direct criticism of this calculation method might be that even if the quantity of tokens listed remains intact, a price crash will still make the order book appear to shrink in dollar terms. To isolate the impact of price fluctuations, we simultaneously tracked the dollar depth of bid/ask on the order book and the number of tokens listed.
The following Hyperliquid trend chart holds the same asset set and observation periods fixed across all 13 sampled dates. The 5 bp panel contains 63 markets, while the more broadly covered top 20 bid/ask panel includes 80 markets.
It should be noted that the sample selection criteria here are stricter than those for the previous two timestamps, so the values at the end of the chart cannot be directly substituted into the previous comparisons with CEX data.
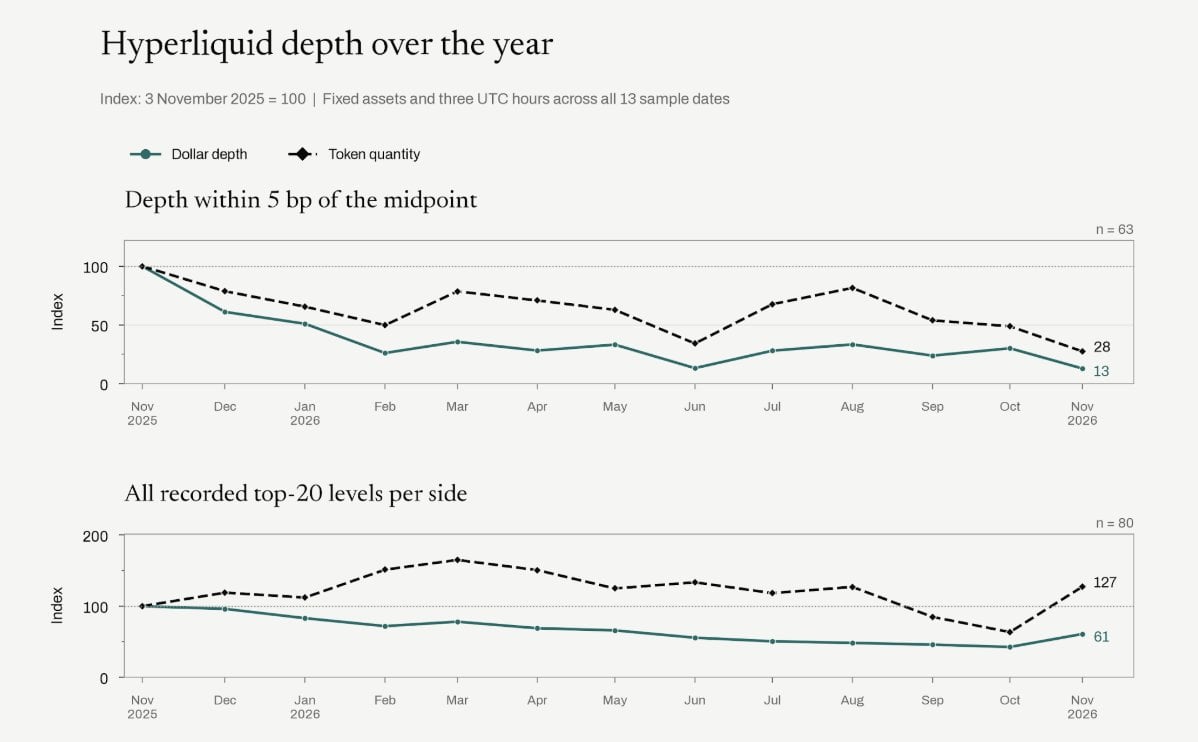
Figure: The depth index trend of Hyperliquid over the past year (November 3, 2025, set to 100) compared with dollar depth and token count in the midpoint 5 bp (63 markets) and bilateral top 20 levels (80 markets)
For ease of tracking, we set the starting point for each market in November 2025 at 100. A year later, the median dollar index within the 5 bp range has dropped to about 13, while the token count index has also fallen to 28. This indicates that even excluding the factor of falling token prices, most of the quantities in the core positions of the order book have still diminished.
However, if we broaden the scope of observation, accounting for all top 20 levels recorded, the median index for each market settled at a dollar index of 61 and a token count of 127. This presents a starkly different picture: in this broader range, the number of tokens listed in typical markets is even greater than a year ago, while the quantity near the 5 bp pricing area has dramatically decreased.
In other words, there is not a lack of volume on the order book, but the number of orders at the positions where traders truly want to transact near the market has significantly fallen.
Depth and Spread Changes at Finer Granularity
It is also necessary to supplement the snapshot of the past six months: during this period, market depth has improved, but this improvement has not occurred near the bid and ask, rather, it has concentrated on the more peripheral wider depths.
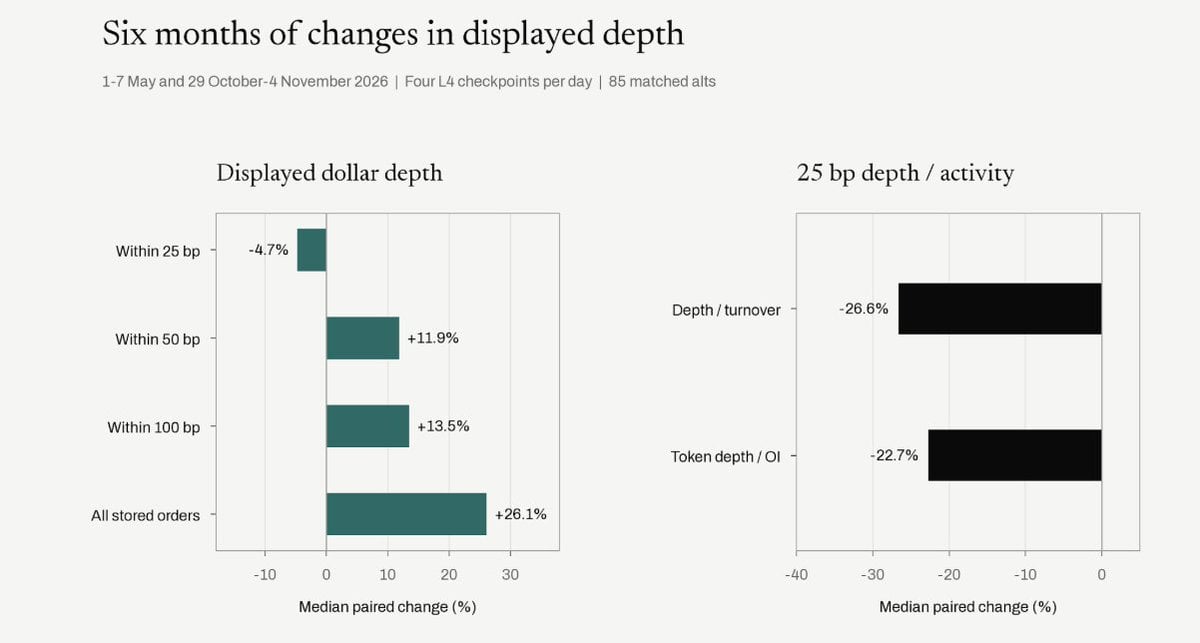
Figure: Changes in dollar depth and the ratio of depth to trading volume for 85 matched altcoins on Hyperliquid from early May 2026 to the end of October and early November
If we increase granularity further, we can observe the curves of bid/ask spreads over the past year. Surprisingly, Hyperliquid's spreads had been steadily catching up with those of Binance and OKX until recently when a sudden divergence appeared.
Of course, we still need to observe for a while longer to confirm whether this is a turning point for a long-term trend or a short-term anomaly. However, this phenomenon we observed on the order book aligns closely with the recent centralization problems in market structure mentioned earlier.
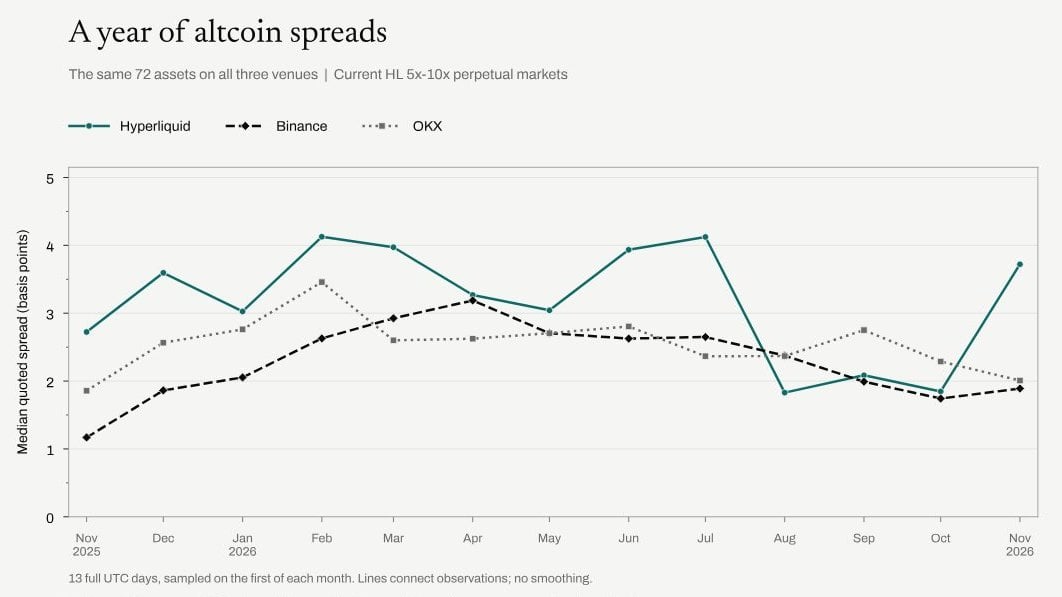
Figure: Trend of the median bid/ask spread for 72 common altcoin perpetual contracts across three platforms from November 2025 to November 2026 (unit: basis points)
Is Market Making Competition Weakening?
To investigate this, I traced the underlying account structure, classifying the main accounts and their explicitly associated sub-accounts as one category to avoid double counting within the same "account family." Even without knowing their specific affiliations, we can effectively identify related account groups.
Initially, I thought a small number of large market makers swallowed the majority of the trading volume, but year-on-year trading data does not support this hypothesis. Comparing data from the same set of 80 markets for a specific week a year ago with data from a recent week, we found that the median share of the maximum account family in trading volume has actually decreased from 25.2% to 14.6%.
Therefore, we cannot explain the decline in depth over the past year by saying "a certain market maker monopolized the whole situation." However, we are also concerned about what changes have occurred in the recent bid/ask pricing.
Now let's zoom in on the past month, using the same 72 common assets from the previous spread benchmark. This timeline is particularly intriguing: starting around October 30, liquidity closer to the transaction price was increasingly concentrated, and the bid/ask spread began to visibly widen.
Comparing the period from October 8 to 14 with the period from October 31 to November 6, the median share of the maximum account group occupying depth within 25 bp increased from 34.5% to 38.6%, and the median bid/ask spread also widened from 2.13 bp to 3.55 bp. This is highly consistent with recent complaints from market makers.
However, this time window coincides with Binance's security incident on October 29, so I would not attribute this round of volatility solely to priority fees or network congestion based on these few curves.
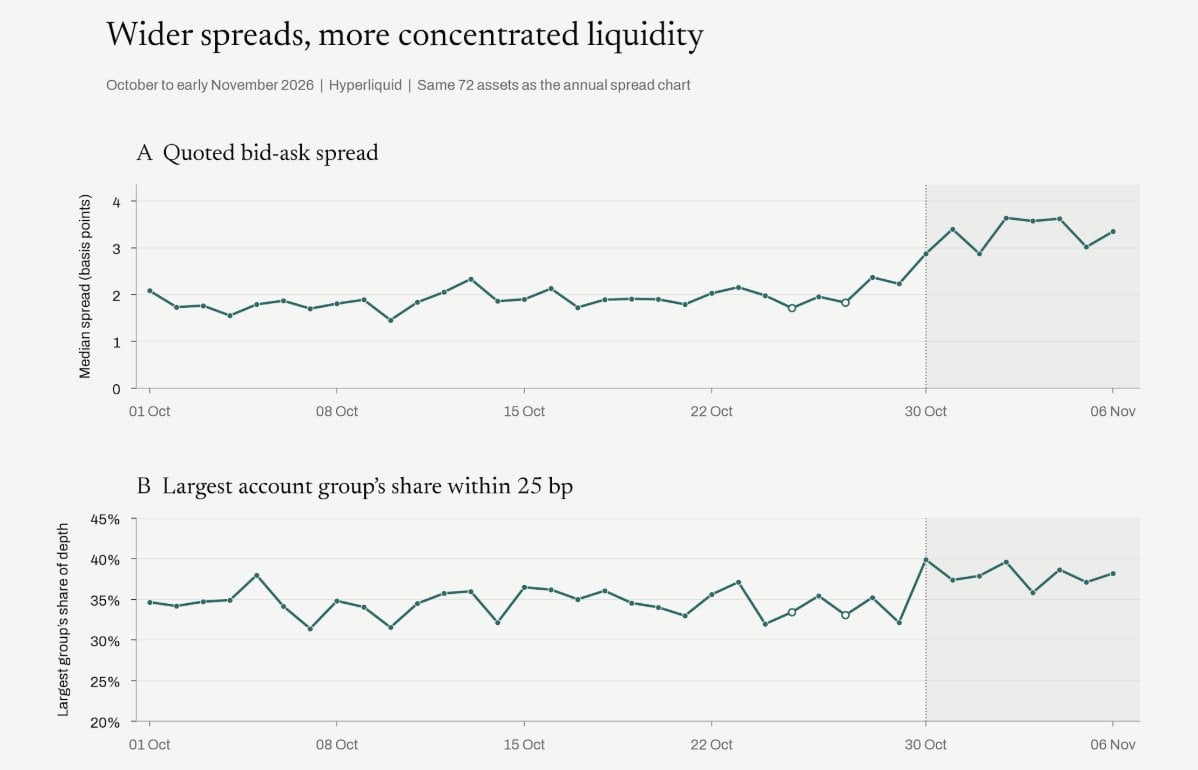
Figure: Median bid/ask spread for 72 altcoins on Hyperliquid from October 1 to November 6, 2026 (above) and the maximum account group's share of depth within 25 bp (below), significantly rising after the dashed line on October 30
Upon observing individual accounts, we also found that a large liquidity provider significantly reduced their quotes around November 3, after which several other account families took over this share. This could also be another reason triggering changes recently, yet it remains to be validated over time.
Institutional Disadvantage Due to Fee Structure
Furthermore, there is a very fundamental problem regarding fees themselves. We analyzed the historical order fees of 54 account families, calculated based on volume-weighted rates. The lowest quartile of trading volume groups needs to pay 0.961 bp in fees, while the highest quartile can actually receive a rebate of 0.236 bp.
For small market makers, even without accounting for hedging costs and unfavorable transaction losses, they are already burdened with an additional 1.20 bp disadvantage from the start line. In a price spread space of merely a few basis points, this constitutes an extremely heavy loss, creating a structural shortcoming for small market makers.
The order data itself also confirms the shrinking participation in the market. In the same batch of 72 markets, comparing the periods from October 8 to 14 and from October 31 to November 6, the median average number of account families making at least $1,000 in both bid and ask within 25 bp dropped from 7.64 to 6.39.
Even when expressed in fixed token prices, the number of active market-making accounts declined in 58 of the 72 markets. This indicates that even excluding the price drop due to token sell-offs, there are indeed fewer market makers providing effective quotes near critical price levels on the order book.
HIP-4 Also Depends on Small Market Makers
Network congestion is another significant challenge. Hyperliquid's congestion limit rules currently allocate quotas based on the weighted share of orders placed by an address in the previous UTC day, allowing for the use of double the quota's block space during high congestion periods.
This leads to a cycle of "you need transaction volume to receive quotas, and you need quotas to make transaction volume." This is also the most common feedback we hear from the HIP-4 trading community: once congestion occurs on Hyperliquid, they are unable to quote normally.
However, it is these small market makers that are currently supporting a significant amount of liquidity. In our sample of 256 HIP-4 contracts on November 10, only 4 professional market maker wallets provided 47% of the depth within 25 bp of the mid price.
Although these markets are currently not large in scale, most binary options are inherently like this. If Hyperliquid aims to have a liquidity-rich ecosystem of long-tail prediction markets, it must enable these market makers to continuously participate in quoting under favorable conditions.
The core point this article wants to convey is that the deep liquidity of long-tail assets was originally one of the primary reasons traders chose Hyperliquid; however, in the markets we compared, it has clearly begun to lose its advantage in competition with Binance. To maintain the competitiveness of the order book, a sufficient number of market-making teams must be able to afford quoting costs.
Letting teams other than leading market makers struggle is tantamount to voluntarily abandoning existing advantages. To allow HIP-4 to succeed, small market makers need a stable and reliable quoting environment from the very beginning, and Hyperliquid's rule design should leave space for this.
免责声明:本文章仅代表作者个人观点,不代表本平台的立场和观点。本文章仅供信息分享,不构成对任何人的任何投资建议。用户与作者之间的任何争议,与本平台无关。如网页中刊载的文章或图片涉及侵权,请提供相关的权利证明和身份证明发送邮件到[email protected],本平台相关工作人员将会进行核查。


