Author: Cooper Duschang, Coin Metrics (Talos)
Translation: Deep Tide TechFlow
Deep Tide Guide: The total market value of tokenized US stocks has surpassed $3 billion, becoming a new channel for on-chain capital allocation to traditional equity assets. However, Coin Metrics' latest research shows that compared to the $12.3 billion trading volume of stock perpetual contracts on Hyperliquid in the previous week, the scale of spot trading remains in its early stages.
Further data shows that while tokenized stocks support round-the-clock quoting, they are highly dependent on the liquidity of the underlying stocks. Once entering the market closure and weekend periods, the core platform's 1% market depth shrinks significantly by 19% to 33%, and the apparent price differences across exchanges, after deducting buy/sell spreads and slippage, have also become unprofitable.
Key Points
- The total market value of tokenized stocks has grown to over $3 billion. Investors can directly obtain US stock price exposure on-chain through issuers such as xStocks, Ondo Tokenized Stocks, and bStocks.
- During regular US market hours, NVDAx is higher than the NVDA underlying stock price 58.6% of the time, with an average premium of 3.1 basis points; while NVDAon is trading at a premium 88.9% of the time, with an average premium of 14.1 basis points.
- The execution prices of tokenized stocks vary significantly due to different trading platforms and order sizes. A specific tokenized stock might achieve minimum slippage for a $10,000 order on a particular platform, but it may not be the best choice for a $100,000 order, so it is necessary to assess slippage depth and asset coverage while considering cross-platform data.
Introduction
During the period from October 27 to November 2, various trading platforms generated over $2 billion in trading volume in the tokenized stock spot market. As on-chain allocation demand continues to grow, custodial institutions are increasing their holdings in underlying stocks and issuing more tokens, driving the total market value of tokenized stocks above $3 billion.
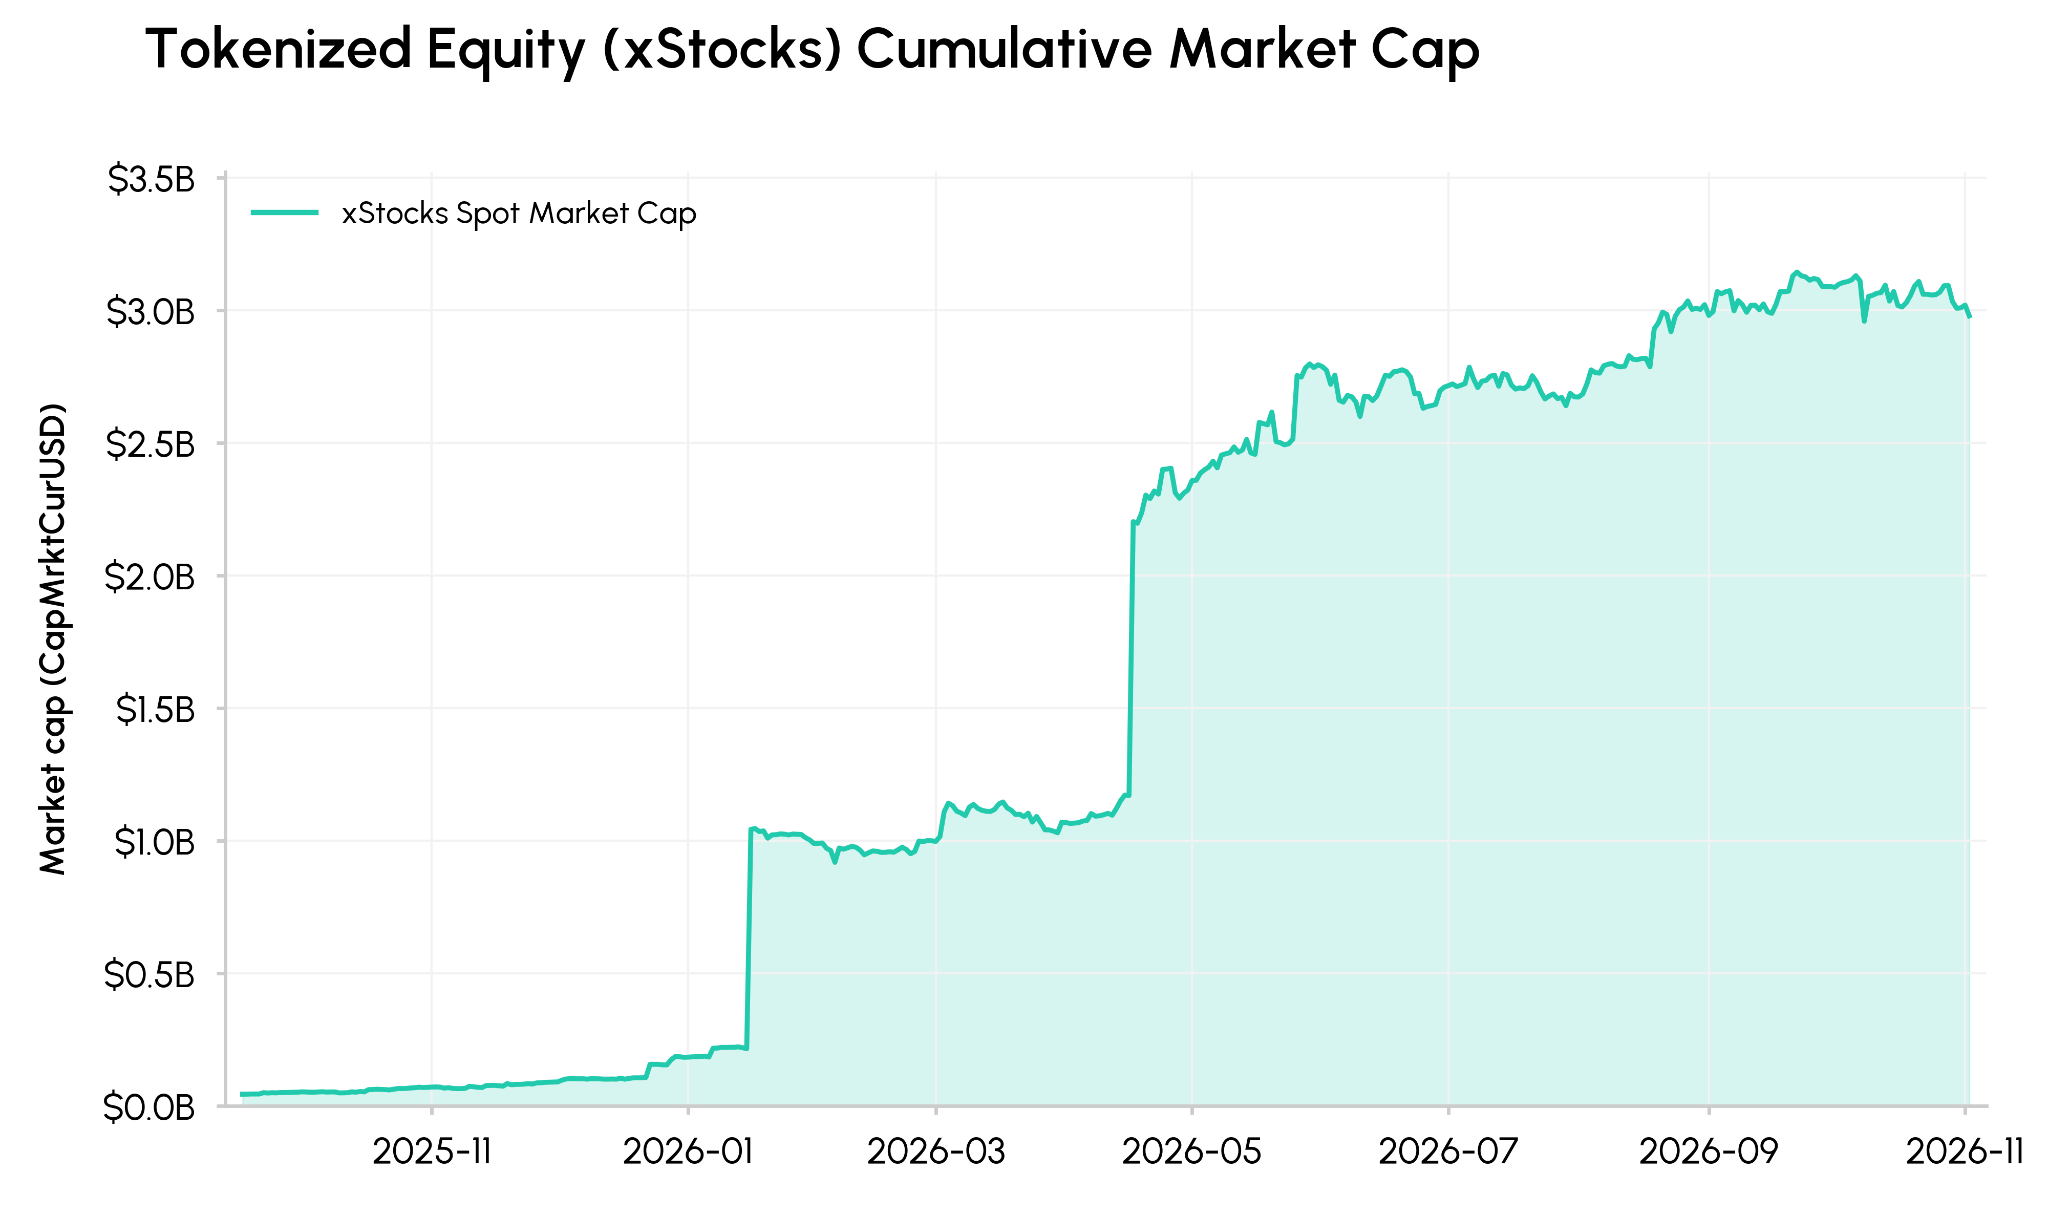
Figure: Trend of cumulative spot market value of tokenized stocks (xStocks), data source: Talos CM Network Data Pro
Although the market value of tokenized stocks has steadily risen to about $3 billion, their spot trading volume remains relatively small compared to corresponding stock perpetual contracts. In the past week, the trading volume of stock perpetual contracts on Hyperliquid was approximately $12.3 billion, equivalent to 6 times the total trading volume of the tokenized stock spot market ($2 billion).
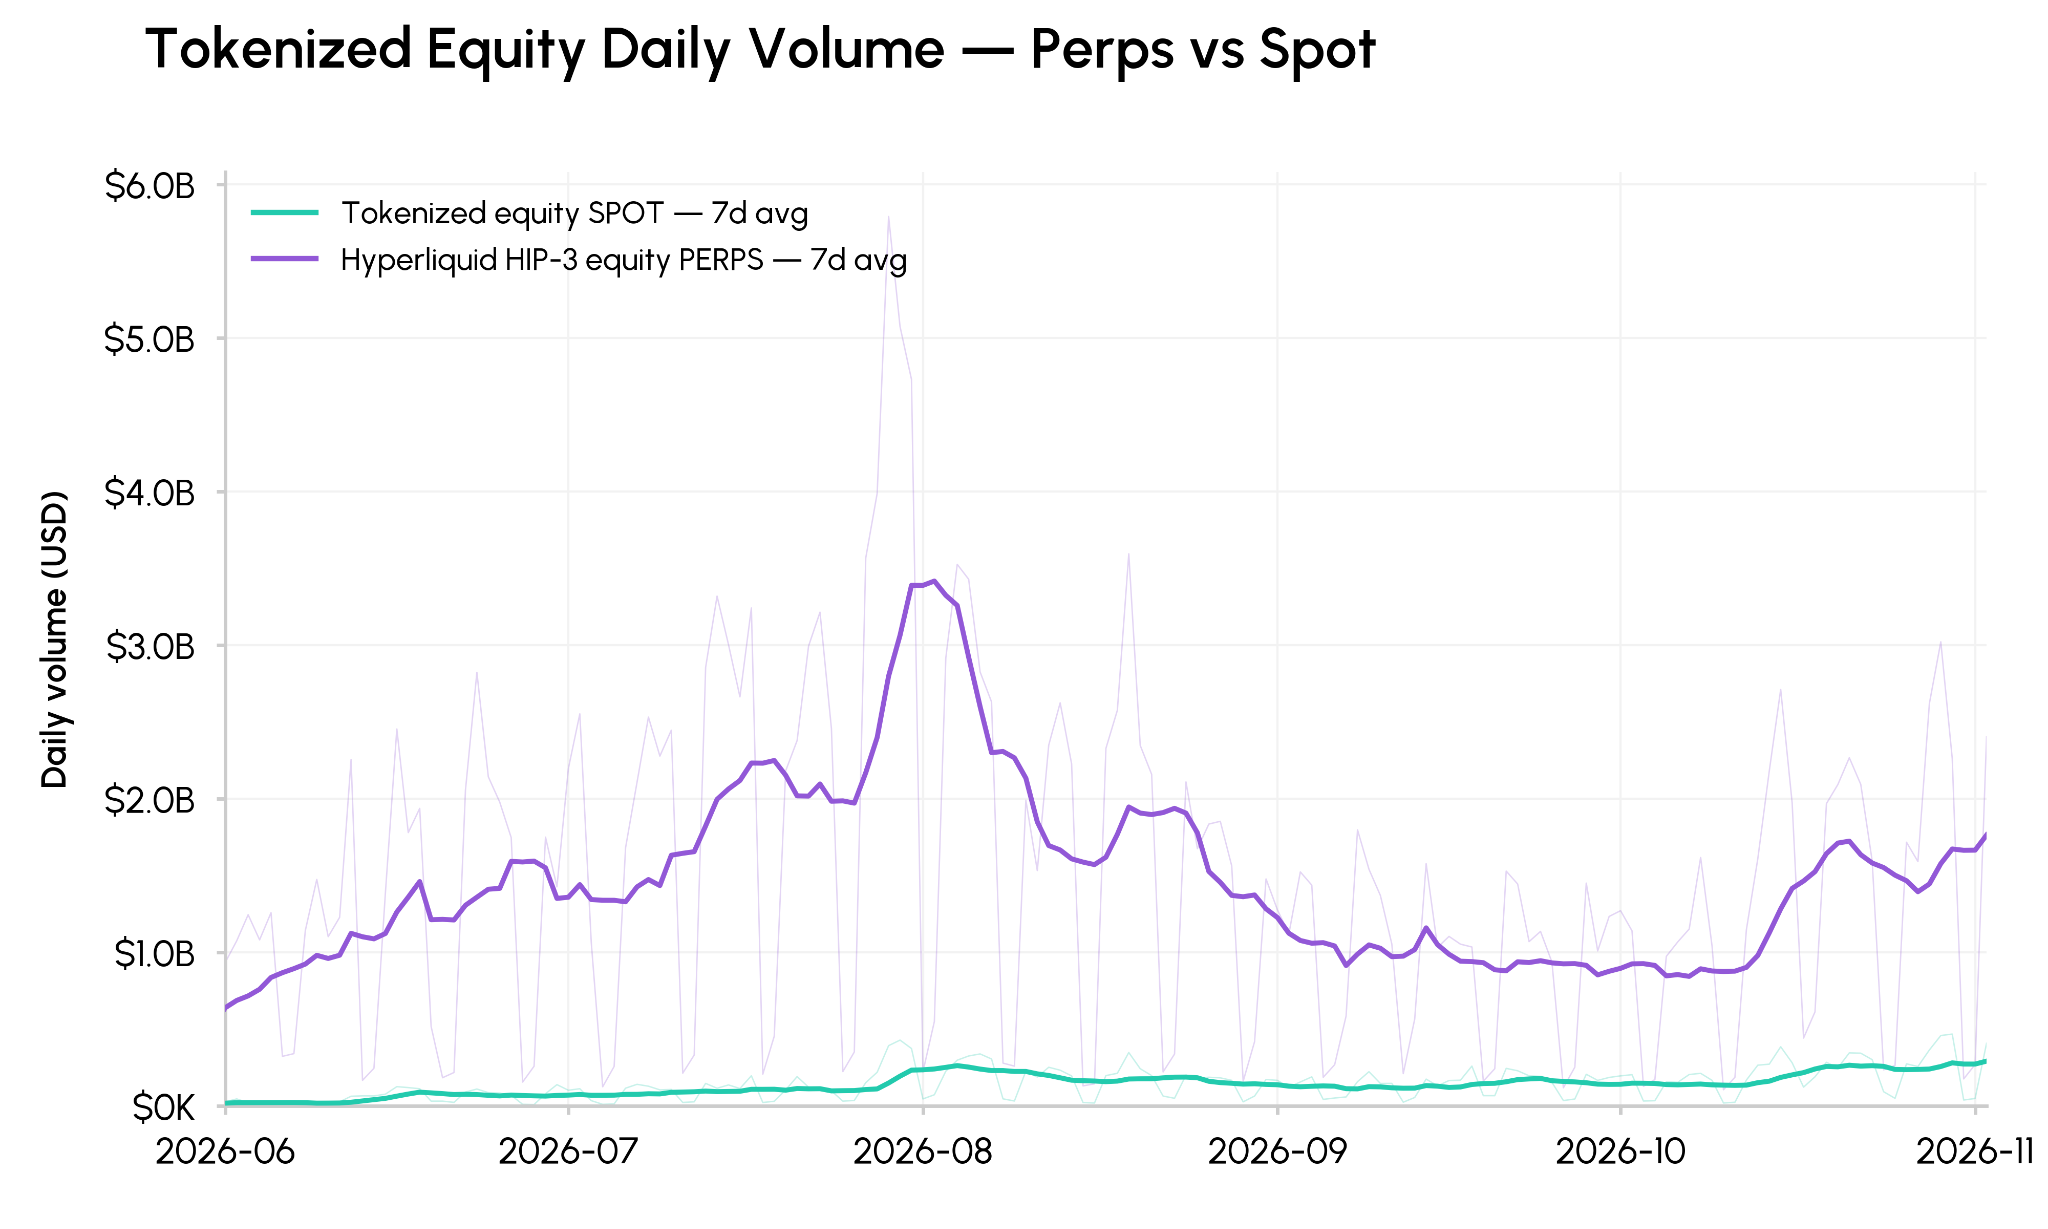
Figure: Comparison of 7-day average daily trading volume of tokenized stocks (Hyperliquid HIP-3 stock perpetual contracts vs. stock spot), data source: Talos CM Market Data Pro
In this issue of the "State of the Network" research report, we will delve into the pricing performance of tokenized stocks relative to the underlying stocks, the dynamics of price differences during after-hours and pre-market periods, and the market fragmentation of these assets across different trading platforms.
Comparison of Tokenized Stocks and Underlying Stock Performance
Tokenized stocks are typically issued to non-US investors, providing them with on-chain exposure to US stock prices outside of regular trading hours. These tokens are issued by specific entities and typically backed by the underlying stocks through licensed custodians.
As tokenized stocks trade in a 24/7 market throughout the year, continuous quoting can still be achieved on-chain even when traditional financial markets are closed.
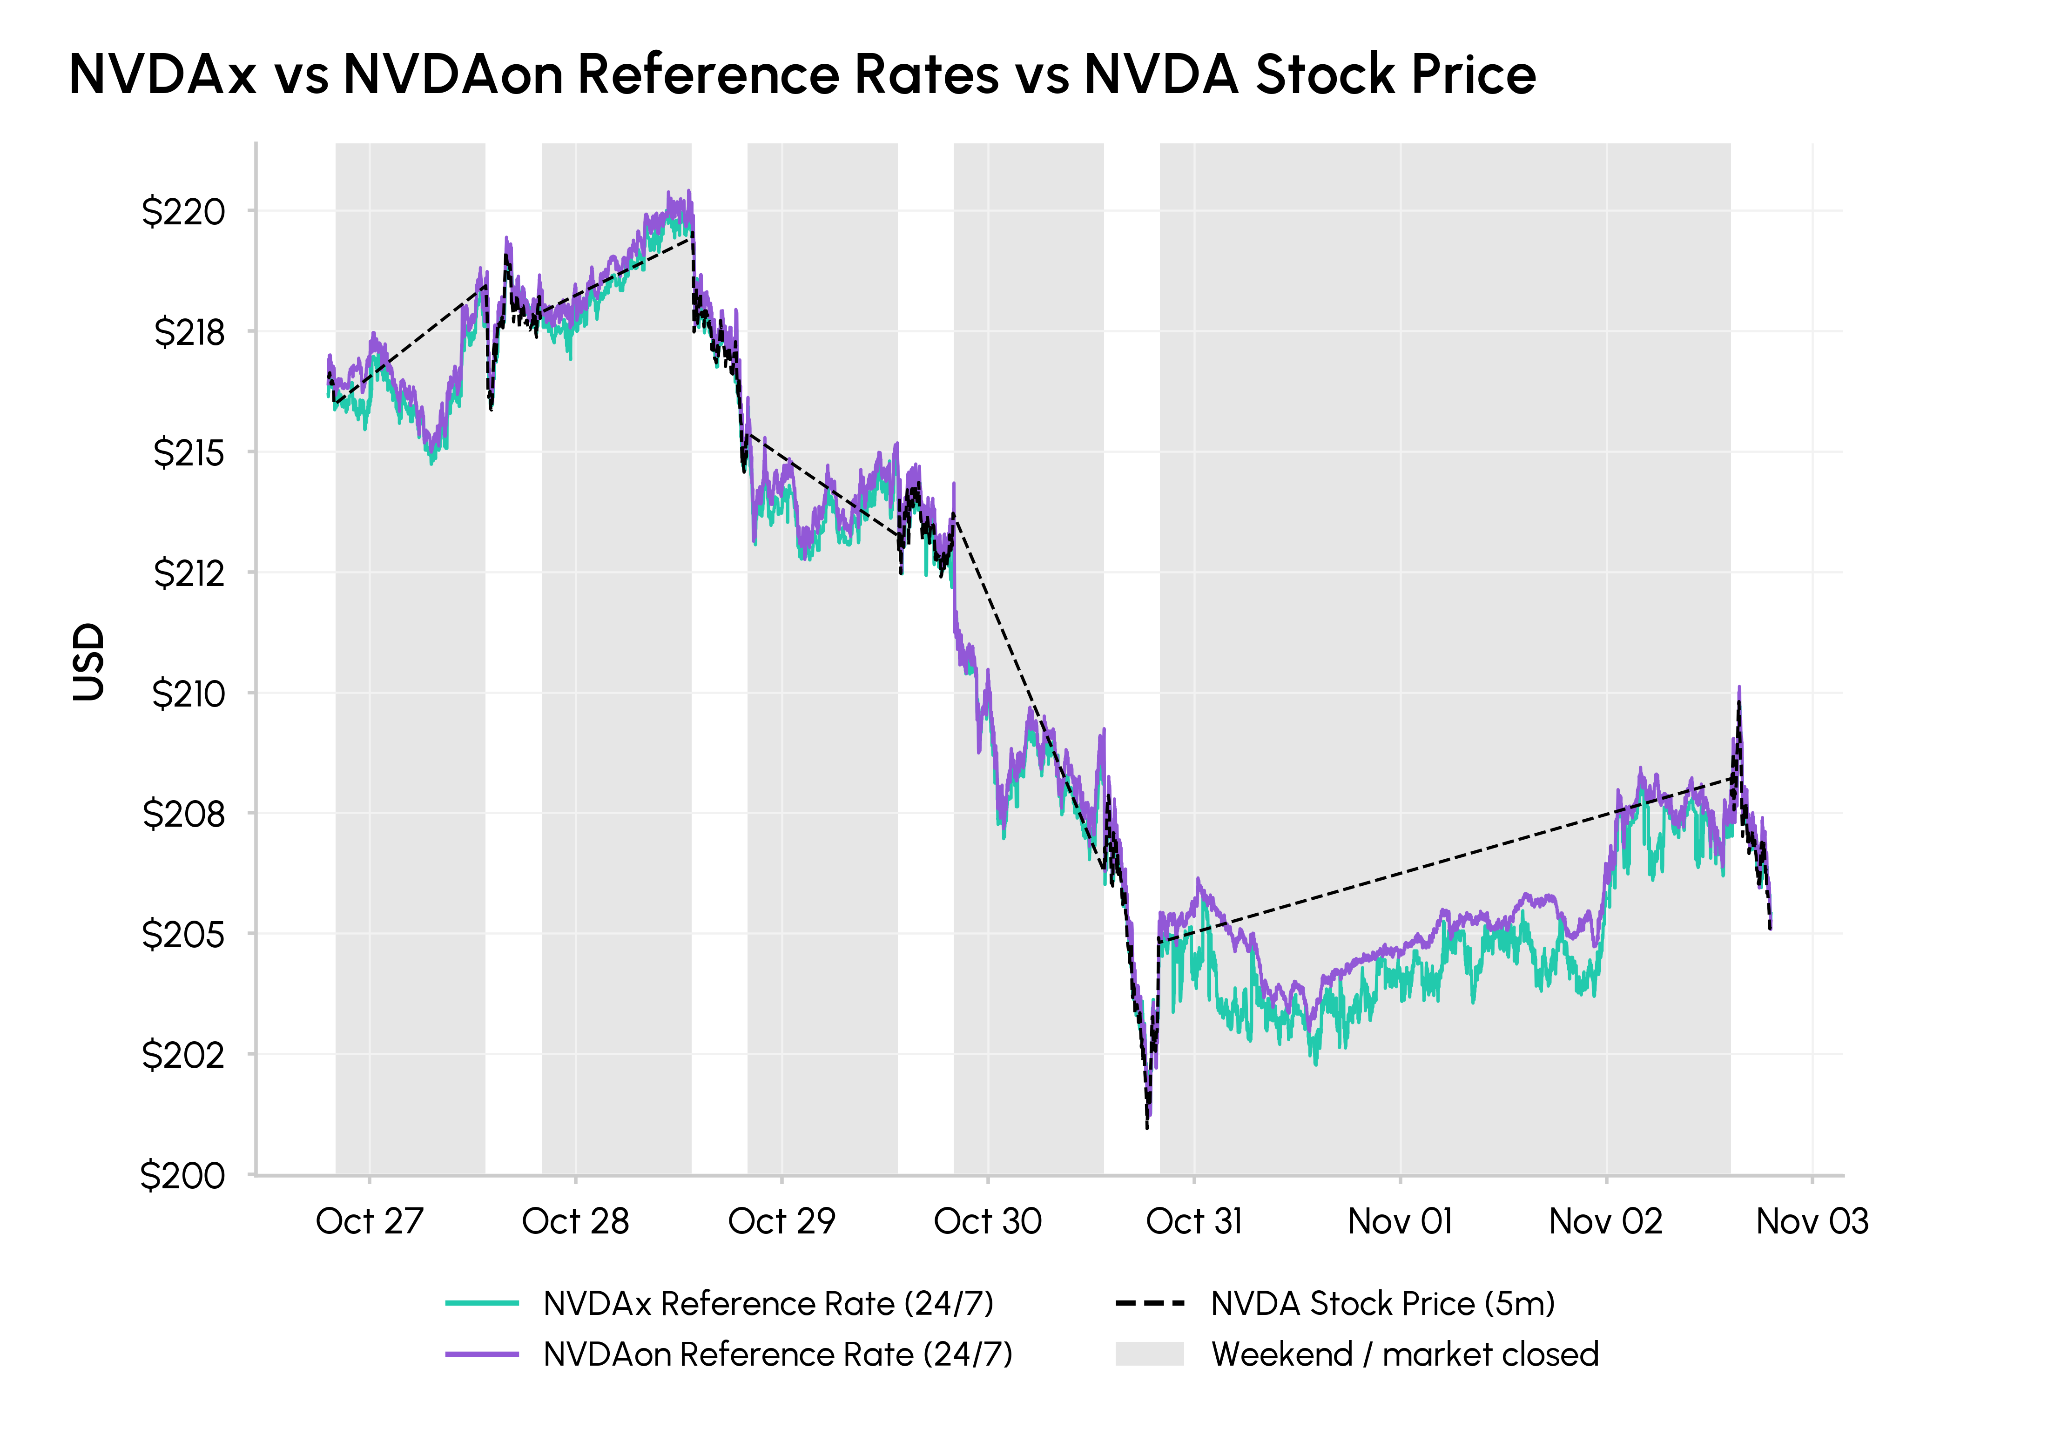
Figure: NVDAx and NVDAon 24-hour reference price comparison with NVDA actual stock price trend (the gray shadow indicates weekend or US market closure periods), data source: Talos CM Market Data Pro, Yahoo Finance
Currently, only whitelisted specific users have the qualification to mint new tokens and redeem the underlying stocks, which poses a potential redemption discount risk for regular token holders who do not have equal redemption rights.
From October 27 to November 2, the NVDAx issued by xStocks was at a premium 58.6% of the time during US market open hours, with an average premium of 3.1 basis points; while NVDAon issued by Ondo Stocks was at a premium 88.9% of the time during the market open period, with an average premium as high as 14.1 basis points. During the overall market sell-off, the tokenized NVDA also dipped below the previous Friday's closing price.
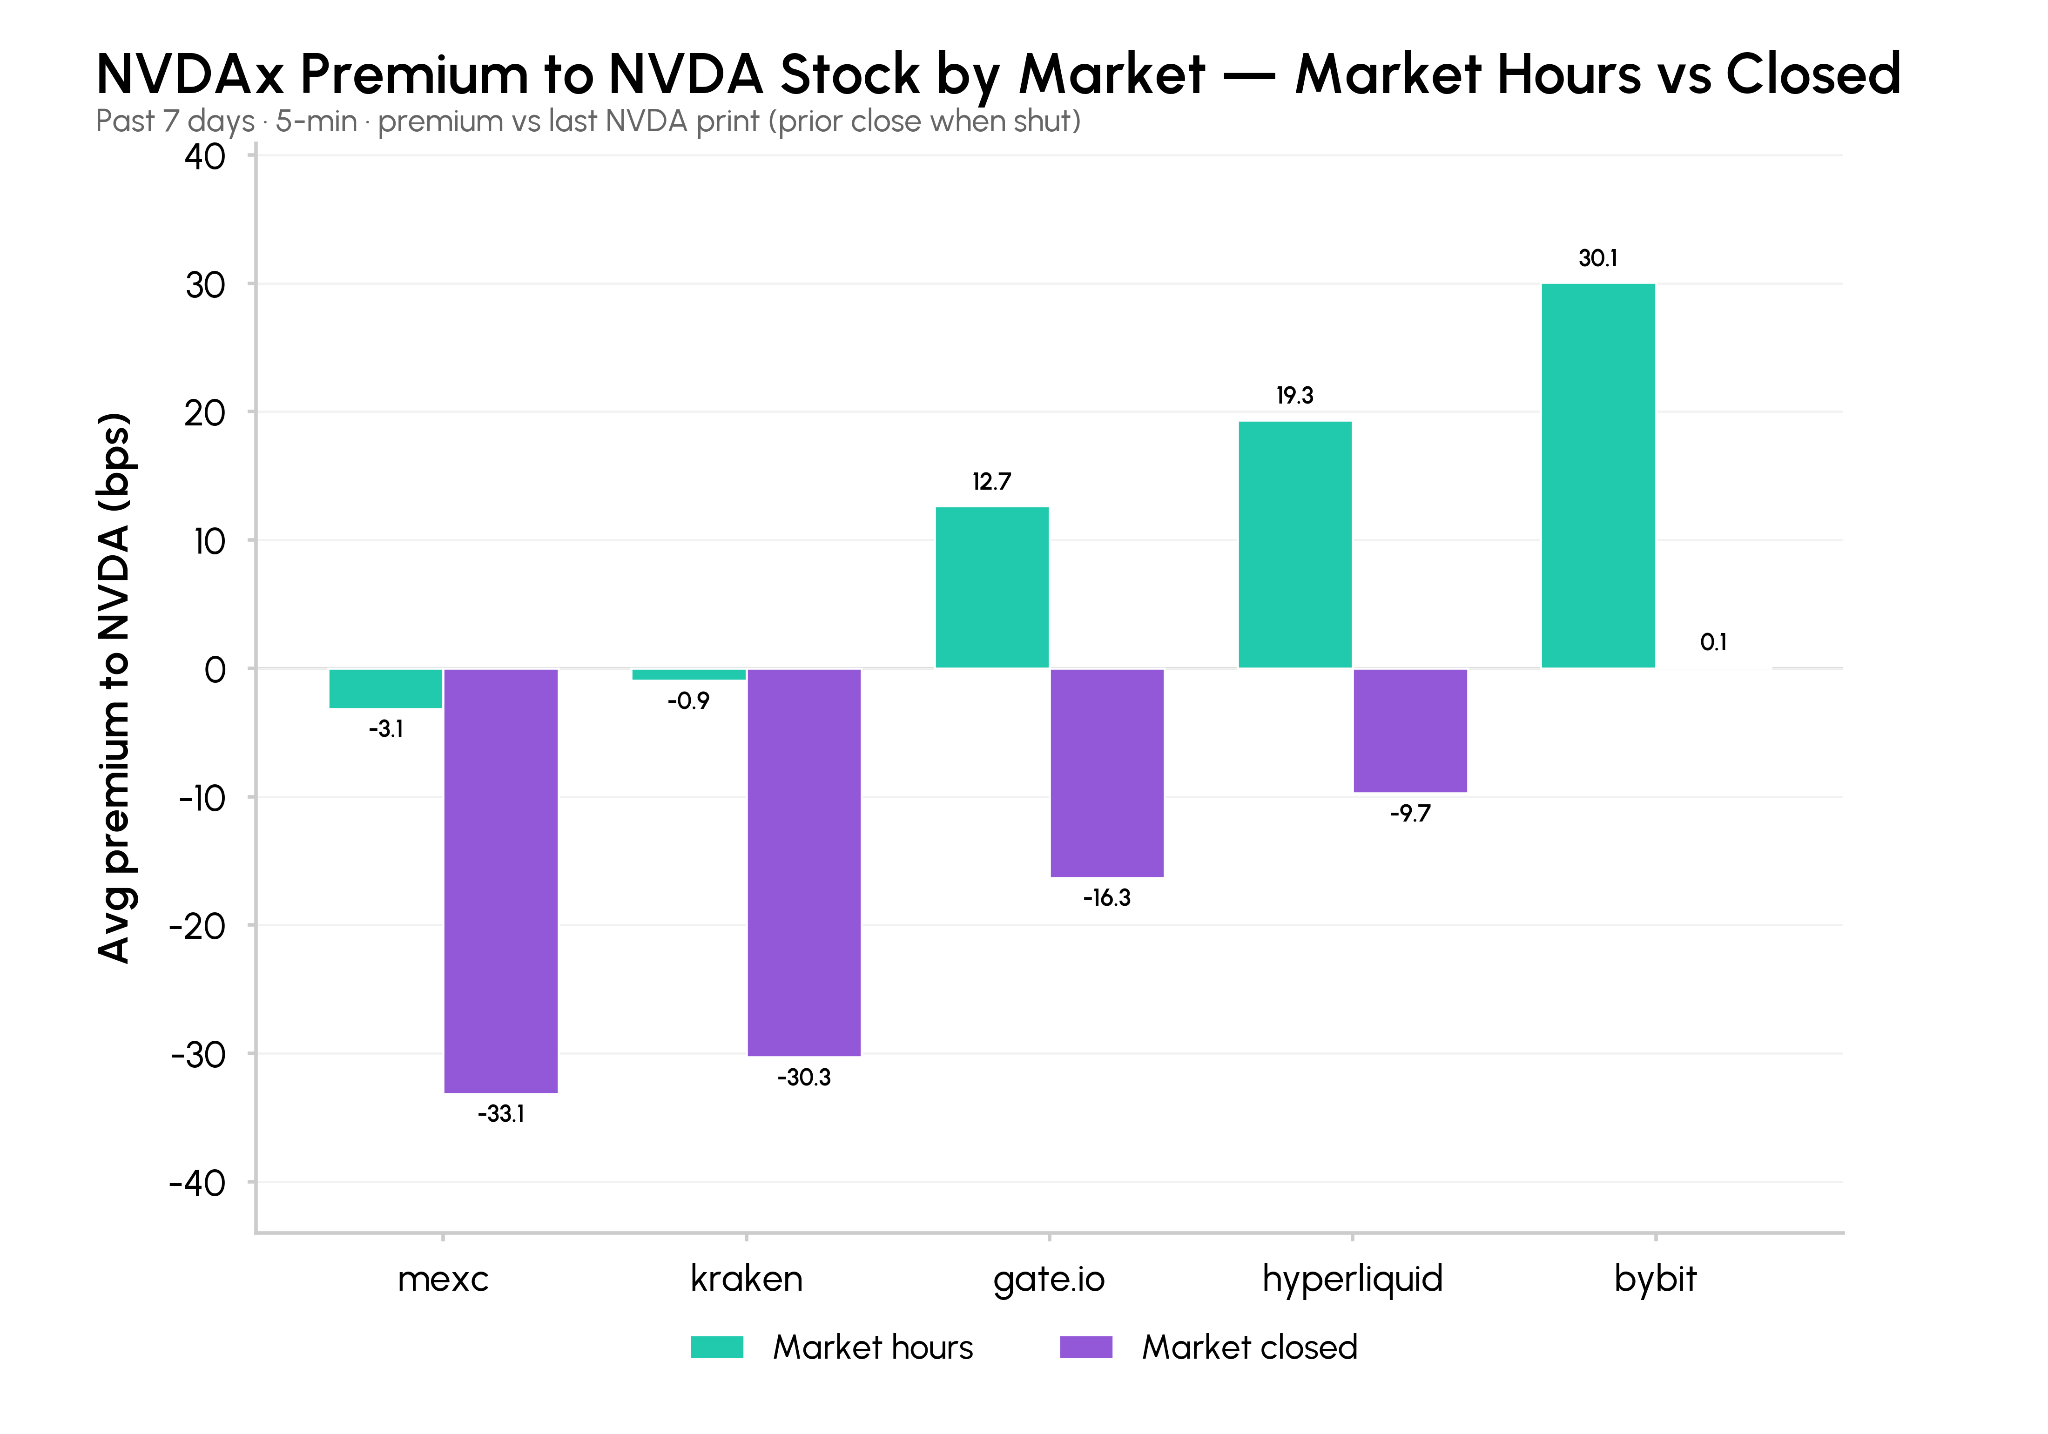
Figure: Average premium rates of NVDAx relative to NVDA actual stocks across trading platforms (during US market hours and closed periods), data source: Talos CM Market Data Pro
The fragmentation of trading platforms and liquidity means that the same tokenized stock can exhibit price differences across different markets during US market open and closed periods. During the observation period, the NVDAx on the Kraken platform recorded an average slight discount of -0.9 basis points relative to the actual NVDA stock during US market hours.
Through lead-lag analysis, we compared the price fluctuations of NVDAx during US market closures and the next day's actual opening gap of NVDA over a total of 210 trading days since January 2026, focusing on the following time windows:
- After-hours period (Eastern Time 16:00 to 20:00): The correlation between the token's fluctuations in the evening and the actual opening price of NVDA the next morning is extremely weak, with a fitting goodness of fit R² of only 0.24. Shortly after the US market closes, the token itself carries almost no effective forward signal about the direction of the next day's price movement.
- Overnight period (Eastern Time 20:00 to the next day 04:00): The fluctuations during the overnight period have a similarly weak correlation with the next morning's opening price, with an R² of 0.30, though slightly stronger than the after-hours period, and the correlation gradually strengthens as it approaches US pre-market.
- Pre-market period (Eastern Time 04:00 to 09:29): The price of NVDAx steadily converges towards the final actual opening price of NVDA, with the linear regression goodness of fit R² further rising to 0.42.
- Full overnight cycle (Eastern Time 16:00 to the next day 09:30): Throughout the entire US market closure period, the movement of the token is almost completely synchronized with the underlying stock, with a goodness of fit R² as high as 0.98. By the time the US market opens, NVDAx has fully returned to the actual price of the underlying stock as expected.
The price convergence between tokenized and actual stocks is extremely high at market open points, but this convergence mainly occurs gradually during the pre-market period. Relying solely on after-hours market fluctuations almost renders effective prediction of the next day’s actual opening performance impossible.
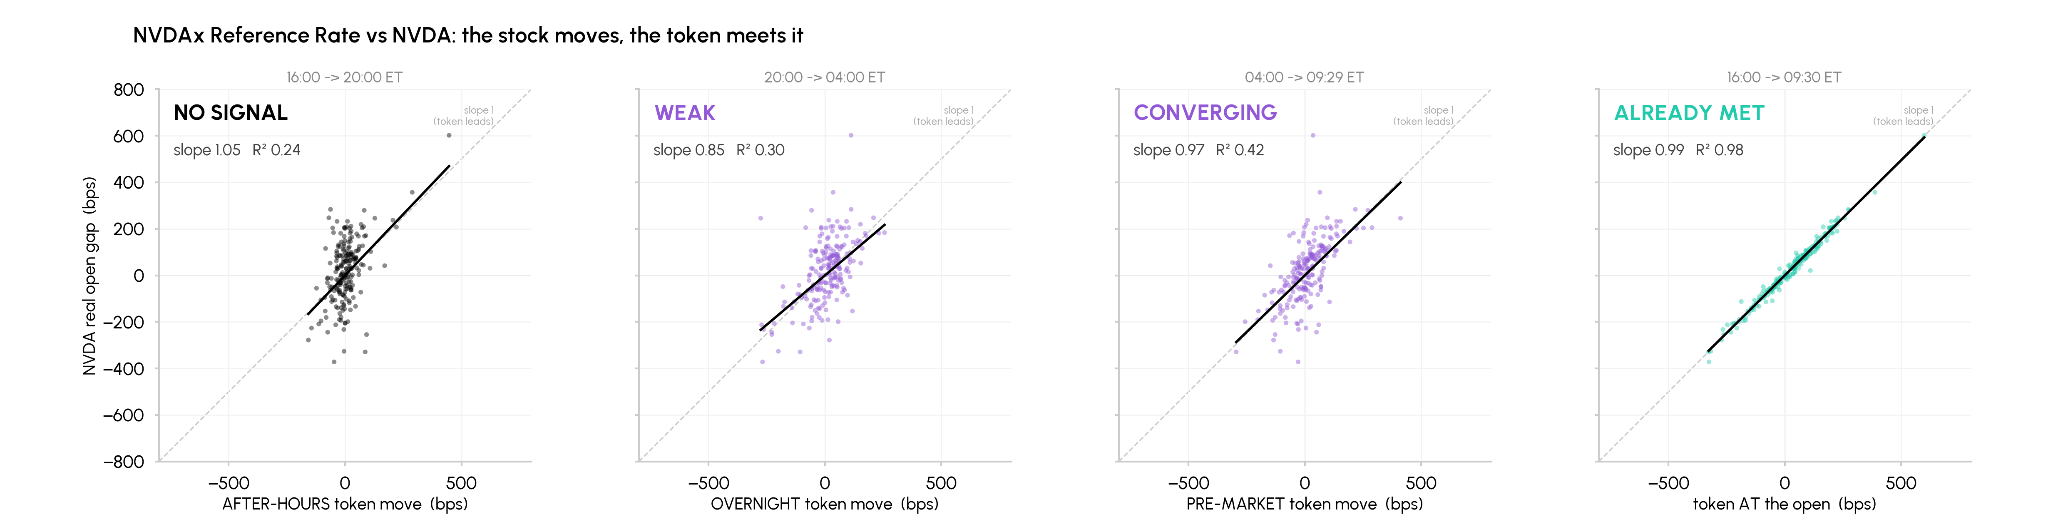
Figure: Correlation regression distribution of NVDAx in after-hours, overnight, pre-market, and close to opening periods with respect to the NVDA actual opening gaps, data source: Talos CM Market Data Pro, Yahoo Finance
Tokenized stocks are highly sensitive to transaction impacts, a phenomenon that is particularly evident during US market closures. When the US market is closed, market liquidity for NVDAx on Bybit and MEXC drops by an average of 19% within a 1% price range from the midpoint; while Hyperliquid's market depth within a 1% range from the midpoint shrinks by about 33%.
Buy and sell orders executed under this liquidity shock will further exacerbate the pricing discrepancy of the same NVDAx token across different markets, only to gradually adjust once the underlying US stocks resume trading.
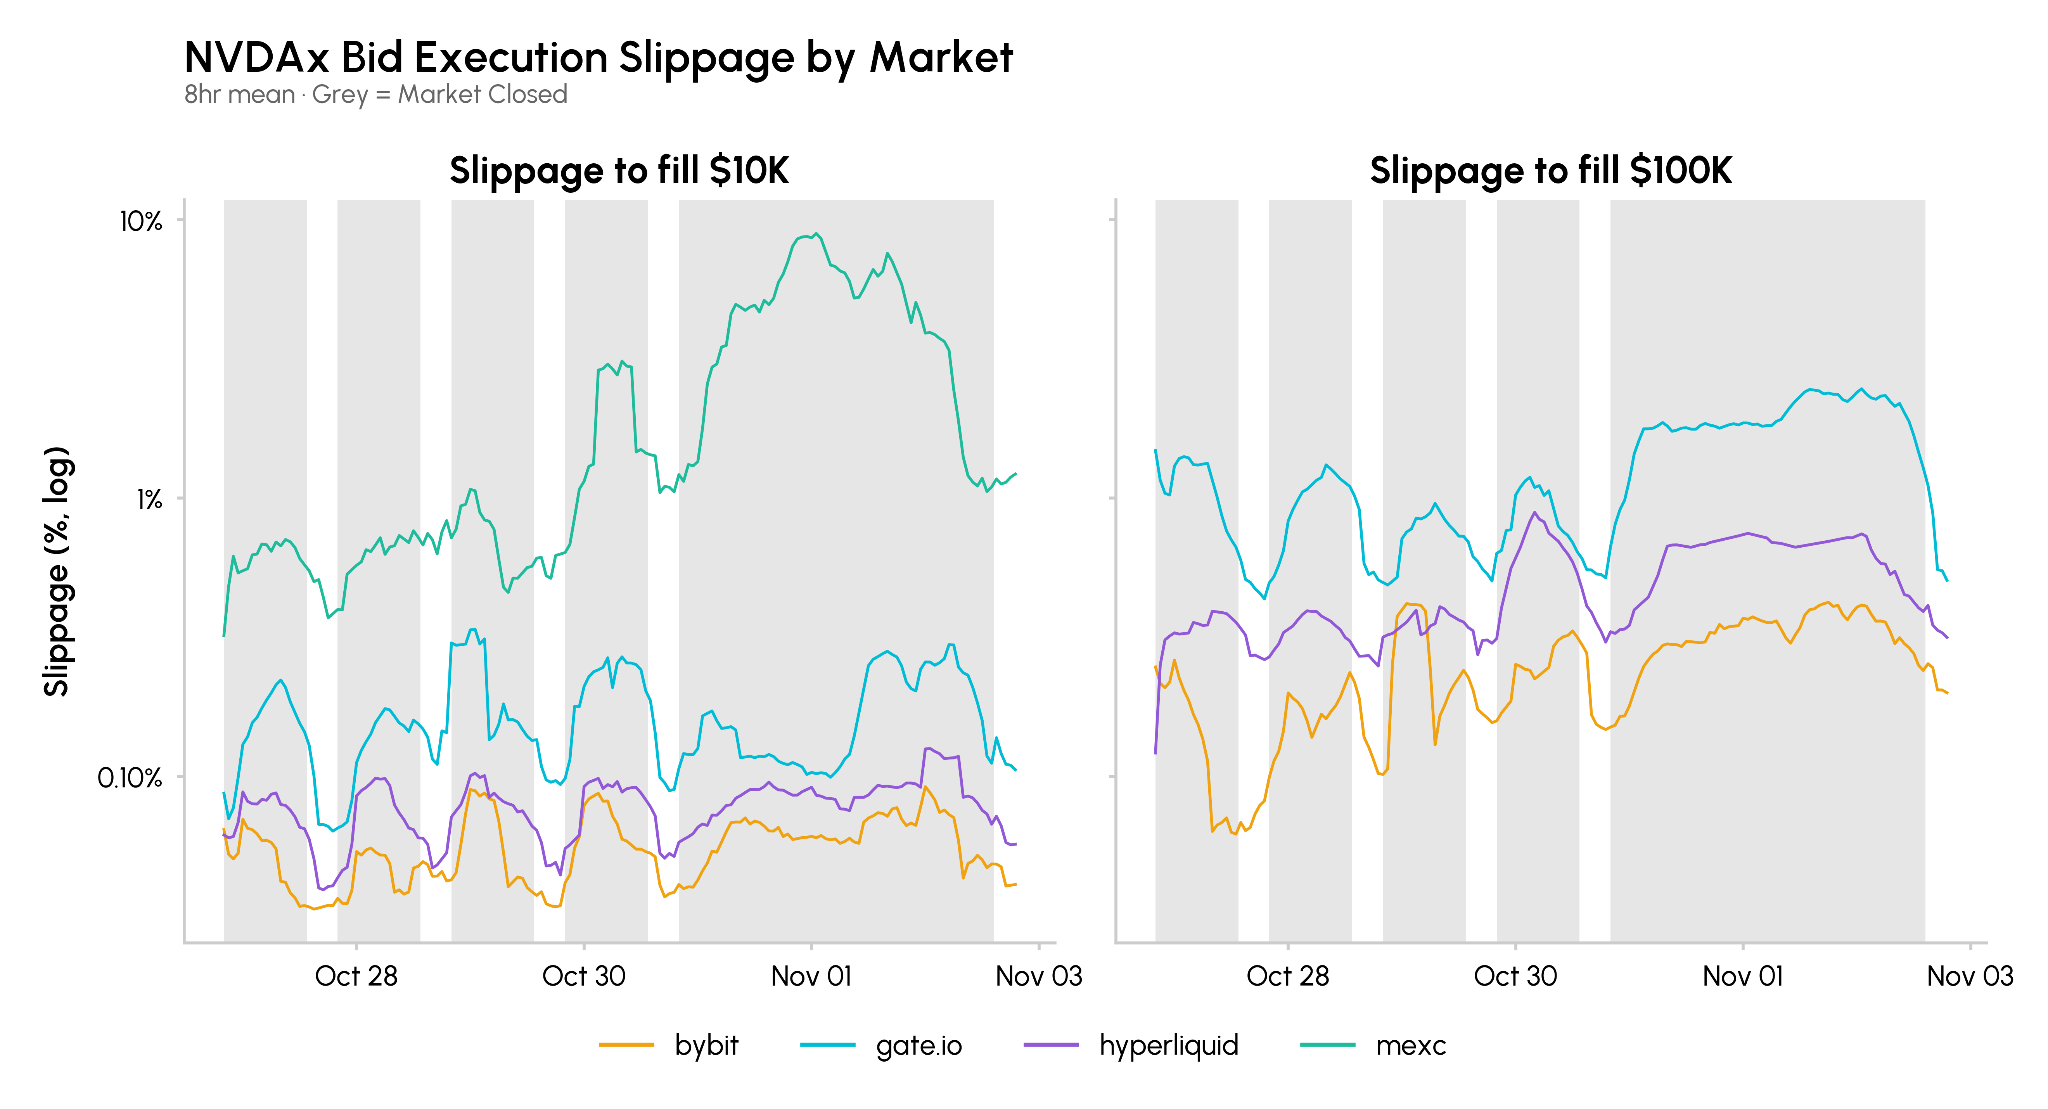
Figure: Comparison of average slippage of executing $10,000 and $100,000 scale orders for NVDAx across different trading platforms (logarithmic scale, gray area indicates market closure periods), data source: Talos CM Market Data Pro
When are Tokenized Stocks Usually Traded?
Tokenized stocks provide non-US investors with a channel to access US stock prices. By observing the trading distribution at different times throughout the day, it can reveal whether investors continue to participate in trading during the low liquidity market closure periods.
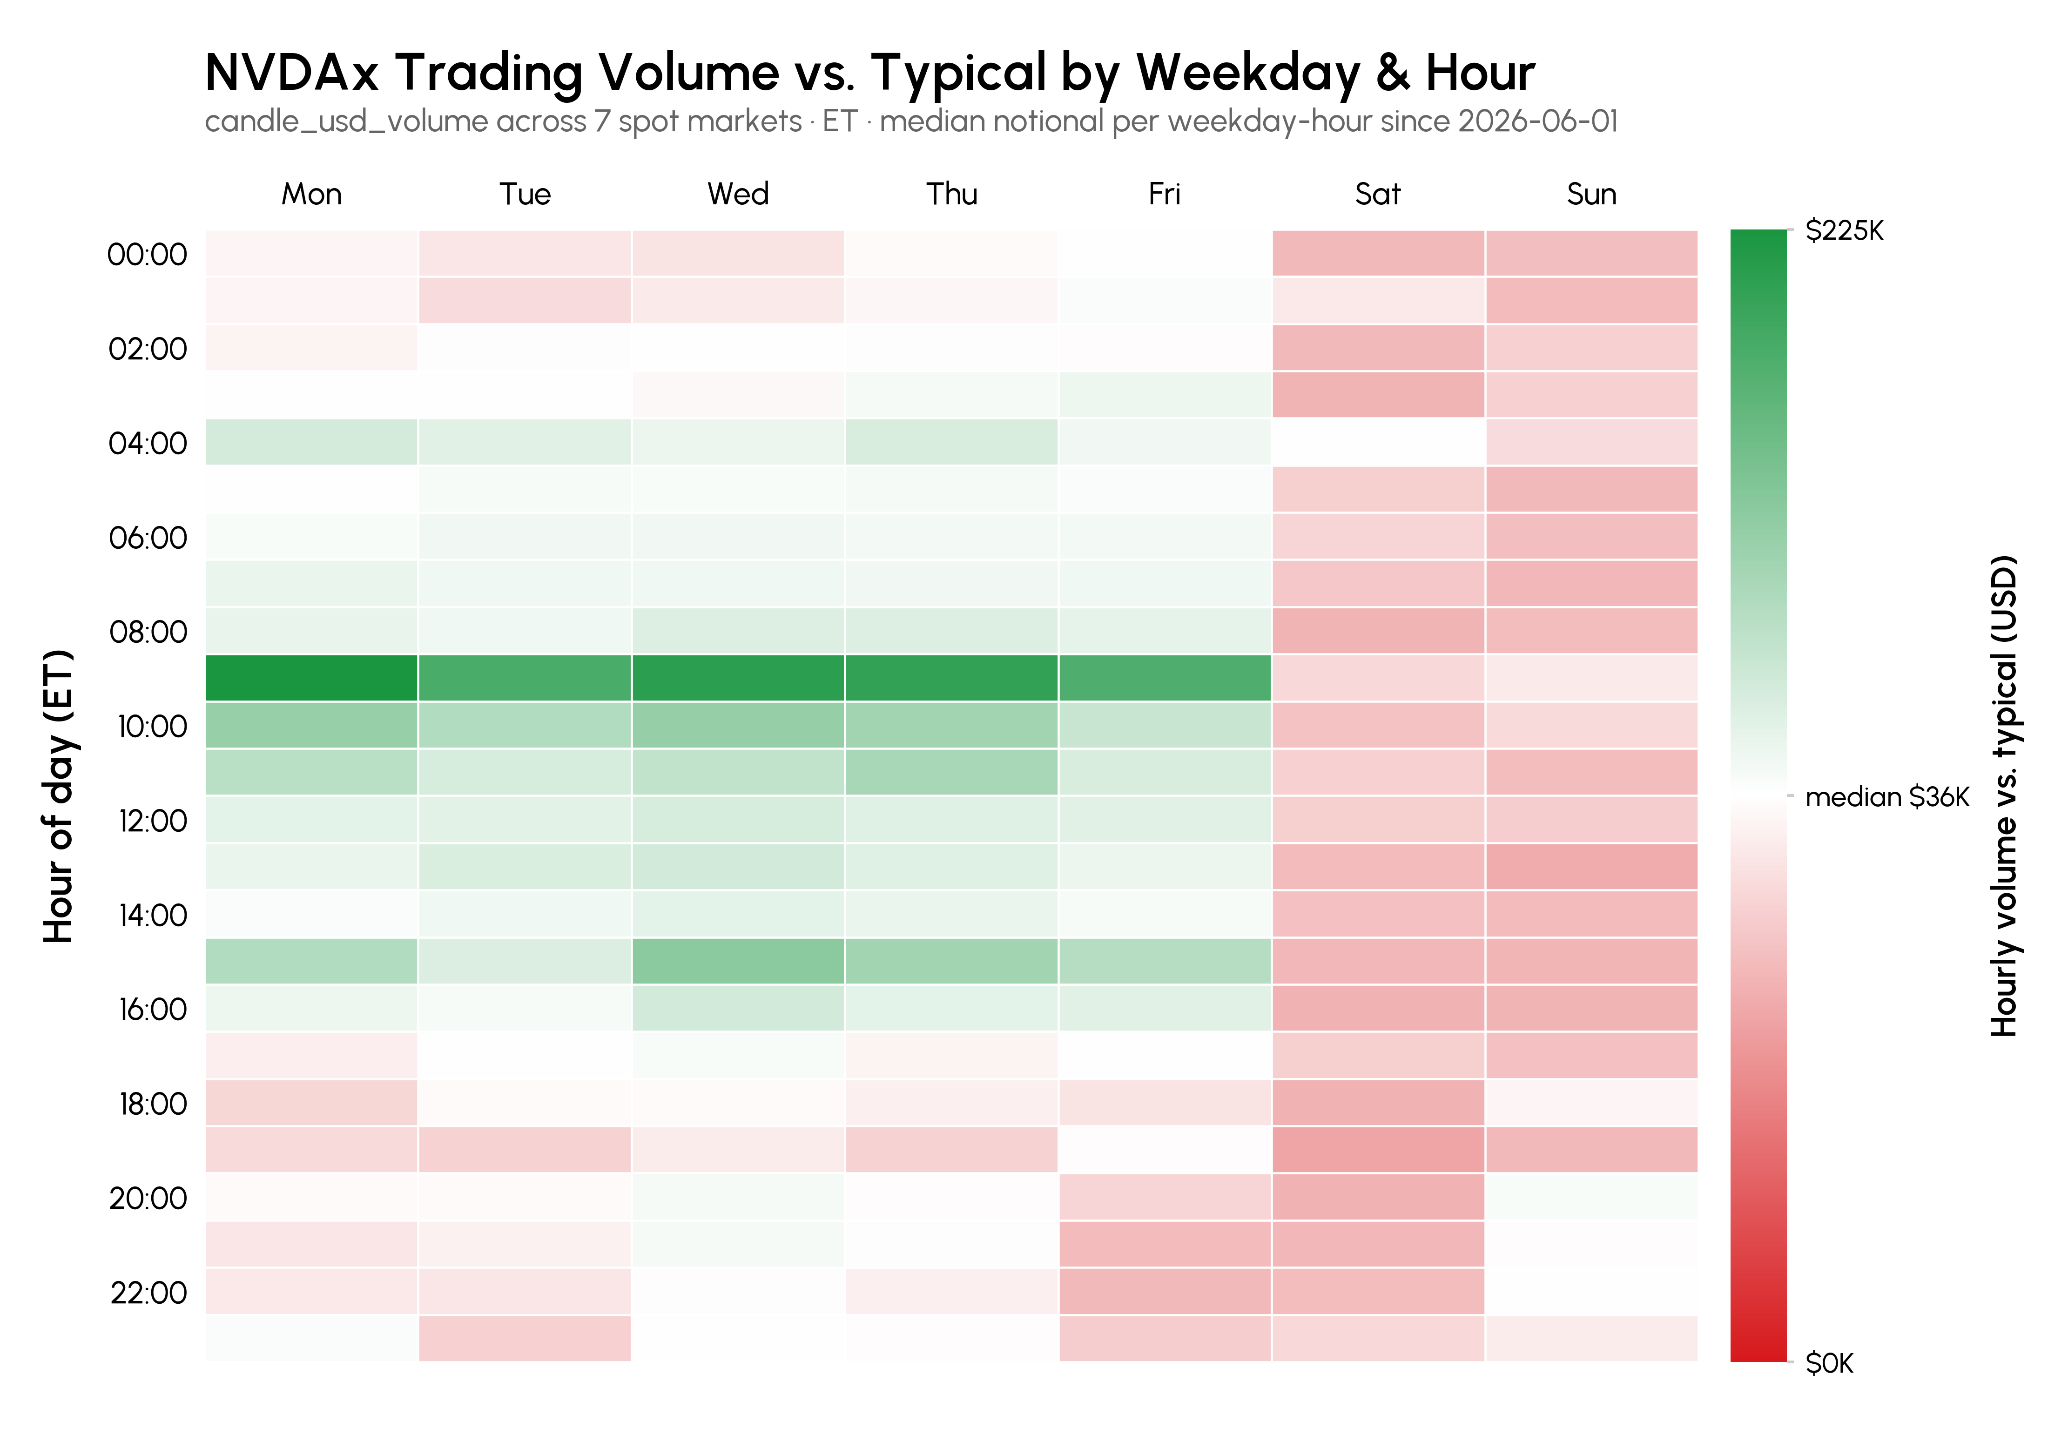
Figure: Heat map of trading volume statistics for NVDAx by week and Eastern Time hour across 7 spot markets (median $36,000, peak of $225,000 during the first hour of market open), data source: Talos CM Market Data Pro
Statistical results show that the trading activity of NVDA xStocks is mainly concentrated around the opening and closing of the US stock market. During the core opening period from 9:00 AM to 10:00 AM Eastern Time on weekdays, the average trading volume of NVDAx reaches $225,000 per hour.
There is also substantial trading during pre-market and after-hours periods surrounding opening expectations and sudden news events. Although the existing data cannot clearly identify the specific geographical location of traders, the offshore exchange pattern supporting these trades indicates that while the dominant participants are mainly international non-US users, their actual trading hours still closely follow US domestic trading periods.
Cross-Platform Execution Costs and Performance
Since the prices and depth of the same tokenized stock vary across different trading platforms, the actual trading costs for investors to obtain risk exposure largely depend on where the order is executed.
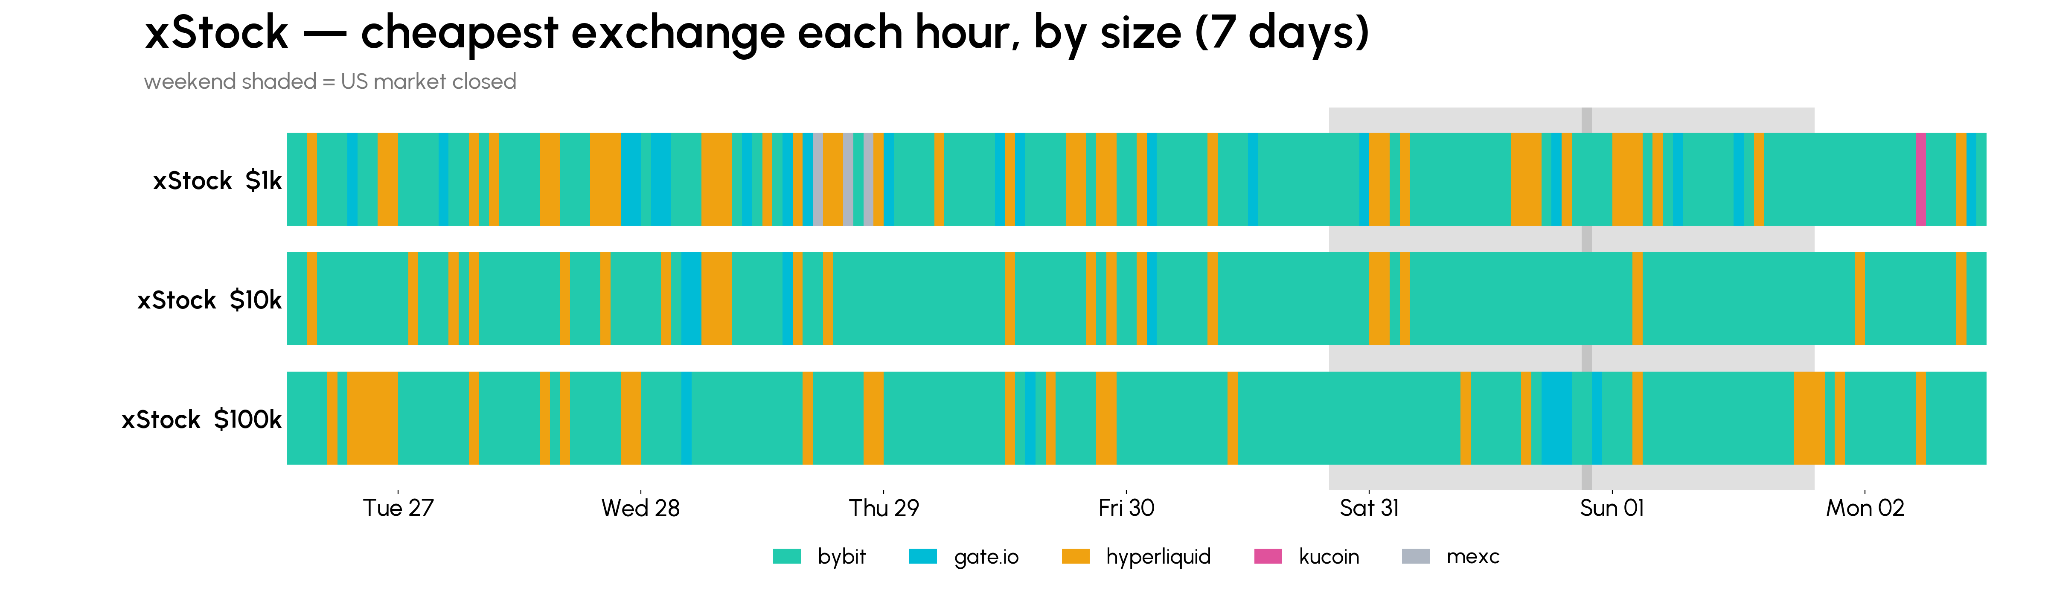
Figure: Distribution of trading platforms with the lowest hourly cost for different order sizes ($1,000, $10,000, $100,000) over the past 7 days (gray areas indicate US market closure), data source: Talos CM Market Data Pro
For smaller orders, there are relatively many platforms available to execute trades. During the period from October 27 to November 2, for $1,000 orders, Bybit and Hyperliquid were the platforms with the lowest slippage for 58% and 23% of the time, respectively; when the order size increased to $100,000, Bybit or Hyperliquid captured the optimal execution platform for as much as 98.2% of the time.
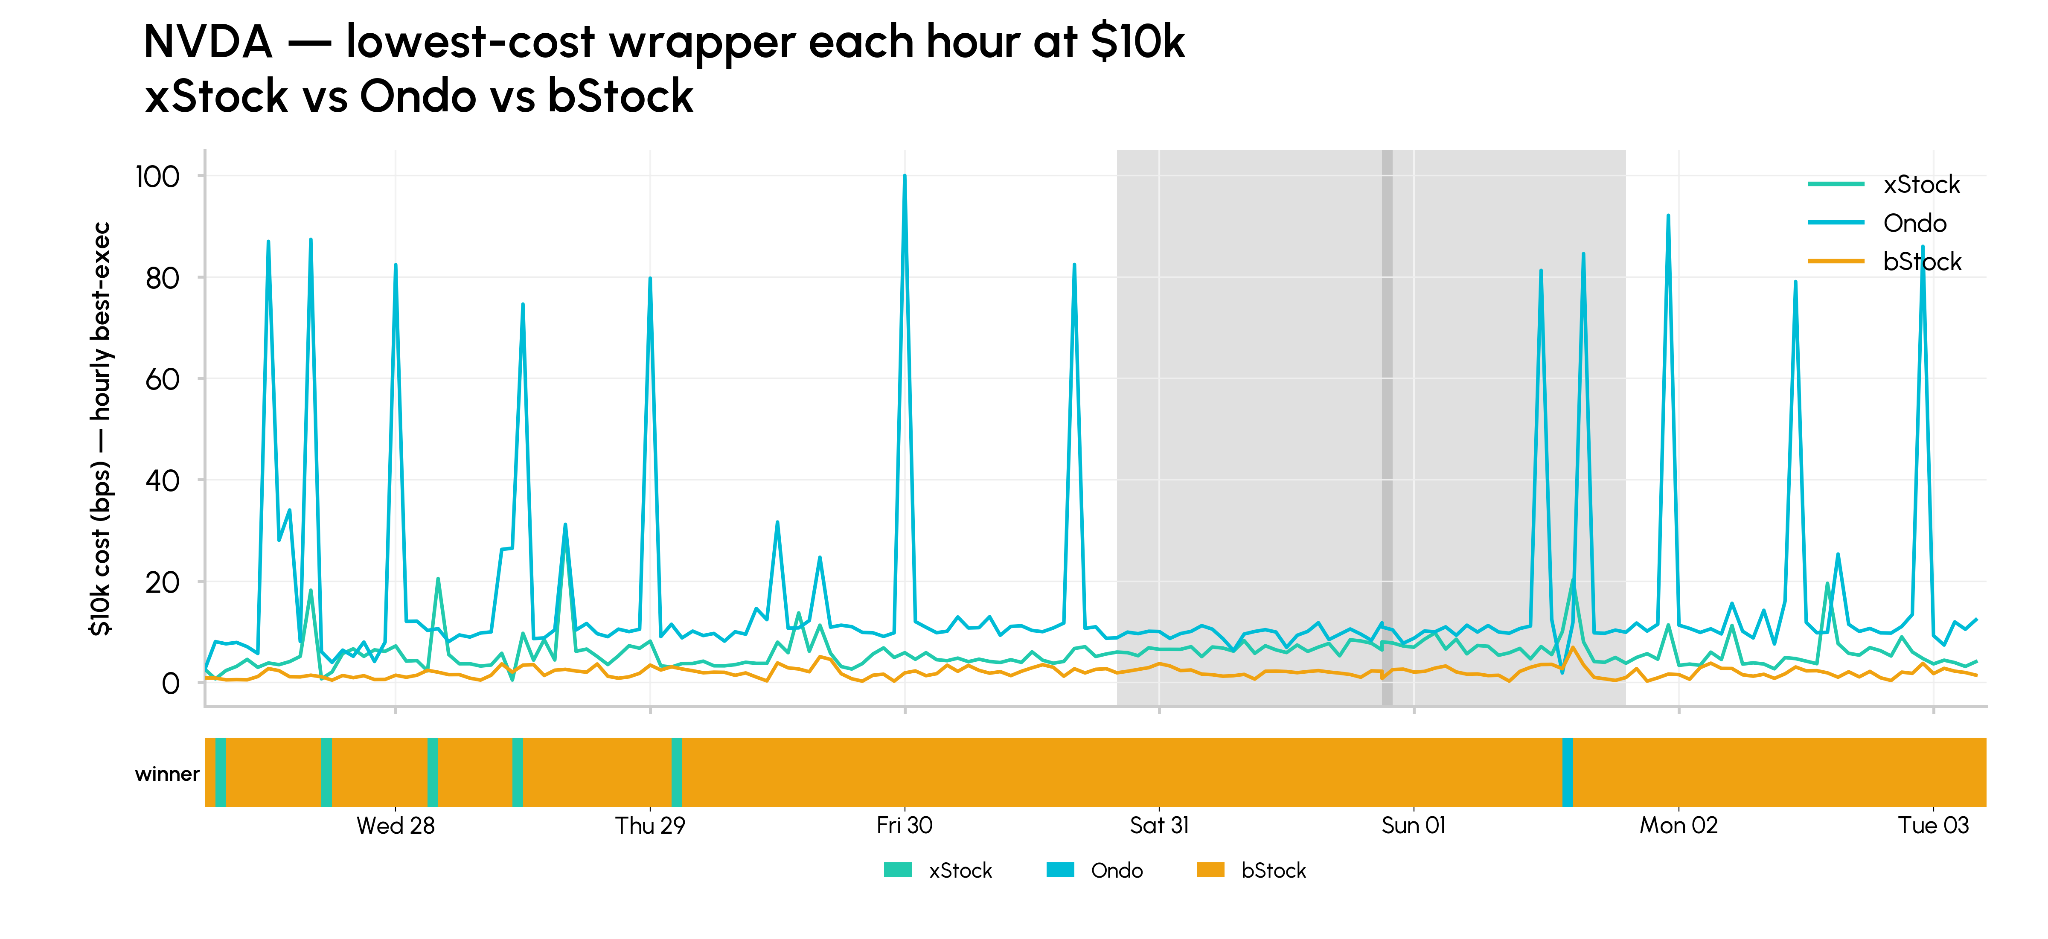
Figure: Comparison of xStock, Ondo, and bStock hourly optimal execution costs (bps) and winning issuers under a $10,000 order size, data source: Talos CM Market Data Pro
Comparing the performance of different tokenized variants shows that execution costs can vary due to the different issuing institutions. In the statistical period from October 27 to November 2, for $10,000 scale trades, NVDAb on the Binance platform recorded the lowest execution slippage among all NVDA tokenized variants, ranking optimal in cost in 96% of observation periods.
Is Arbitrage Space Still Available After Deducing Transaction Costs?
Although the price differences between different tokenized stock variants across trading platforms seem to create arbitrage opportunities, in practice, executing strategies must adequately consider liquidity constraints and transaction frictions.
Statistical data from June 2026 to November 2 indicates that even for orders with a smaller amount of $1,000, and not deducting platform transaction fees, the sum of the average market bid-ask spreads and bilateral entry and exit slippage has completely exceeded the observed cross-platform price differences.
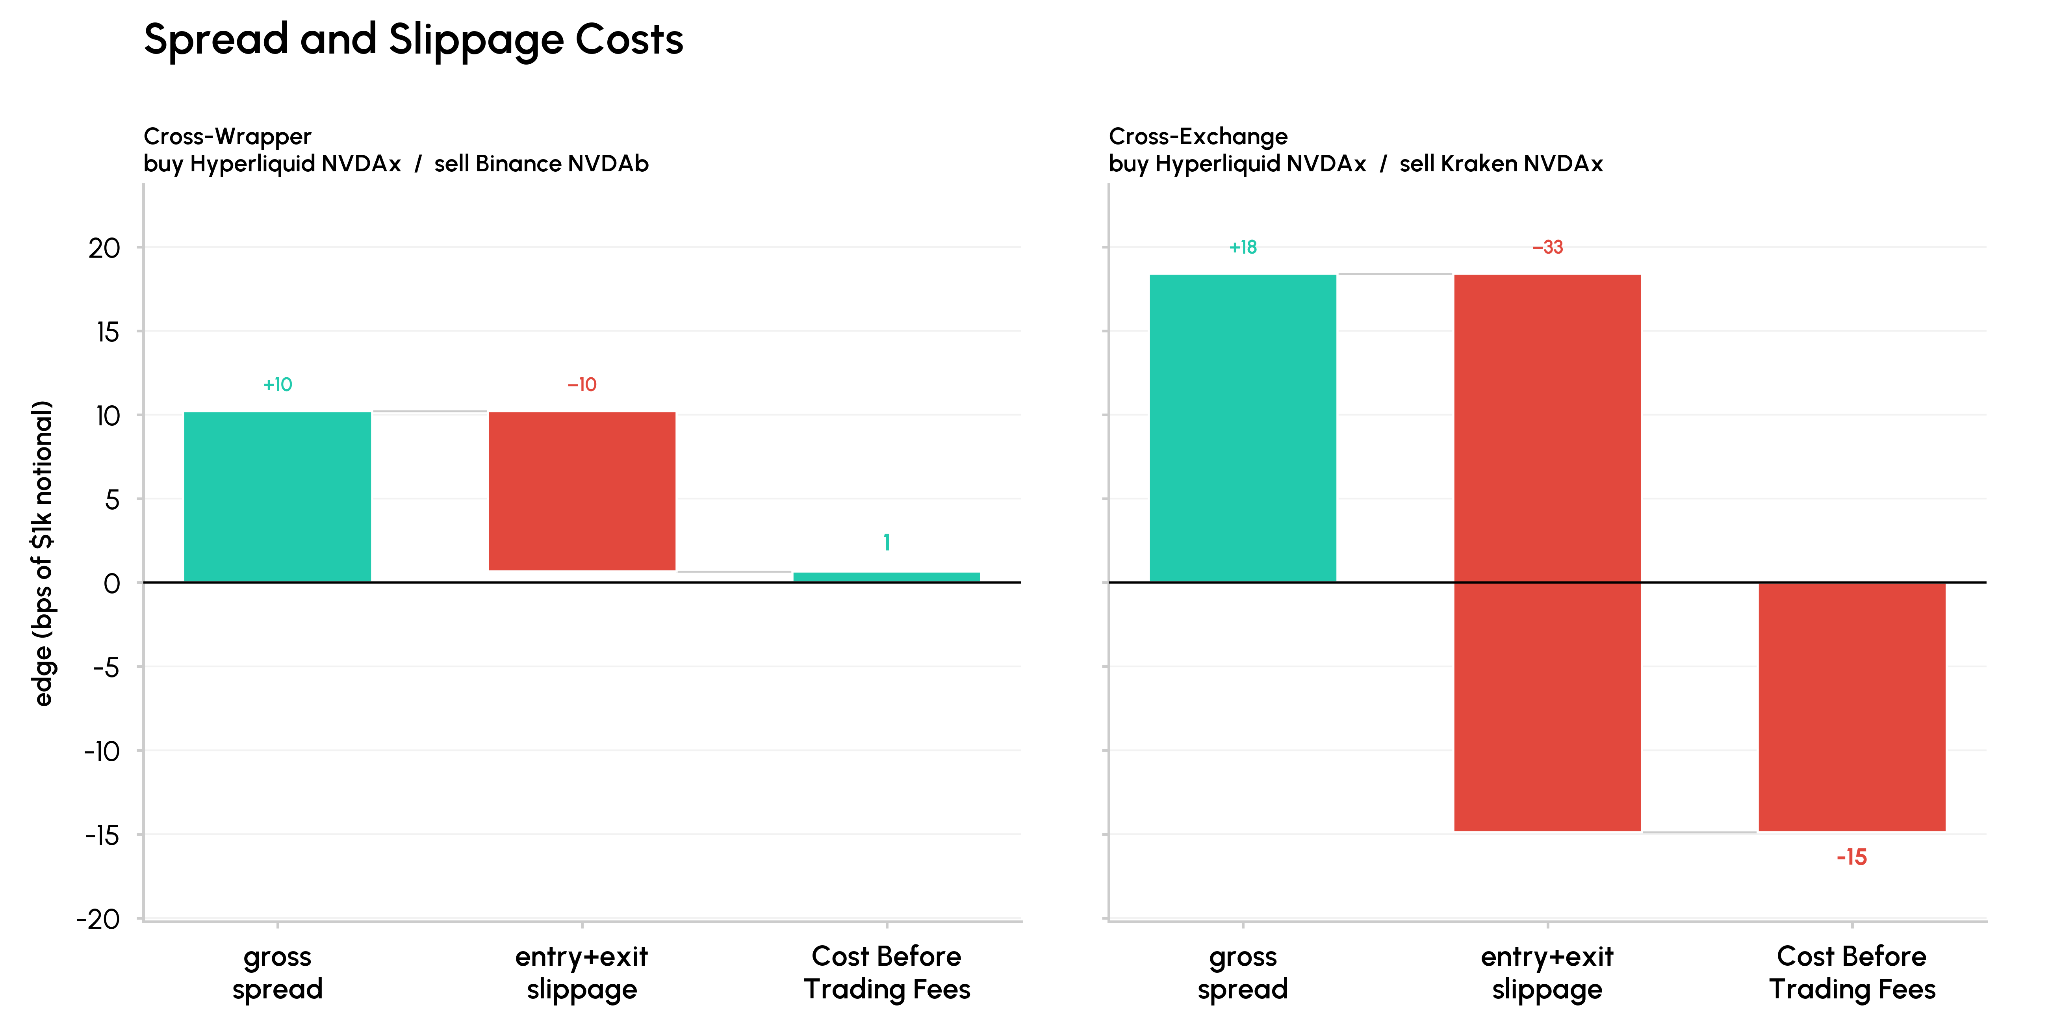
Figure: Comparison of arbitrage returns and entry/exit slippage under a nominal principal of $1,000 (left: long Hyperliquid NVDAx / short Binance NVDAb across issuers; right: long Hyperliquid NVDAx / short Kraken NVDAx across exchanges), data source: Talos CM Market Data Pro
Conclusion
Tokenized stocks have built a 24/7 on-chain pricing channel for non-US investors targeting traditional fixed-period stock assets. However, at the current stage of development, such tokenized assets remain highly concentrated in trading during traditional US market hours and are likely to encounter significant liquidity contraction shocks as soon as they enter market closure times.
Systematically collecting order book depth, execution slippage, and reference pricing data for tokenized assets can help trading teams more objectively and accurately assess the true execution costs between different stock token variants and different trading venues.
免责声明:本文章仅代表作者个人观点,不代表本平台的立场和观点。本文章仅供信息分享,不构成对任何人的任何投资建议。用户与作者之间的任何争议,与本平台无关。如网页中刊载的文章或图片涉及侵权,请提供相关的权利证明和身份证明发送邮件到[email protected],本平台相关工作人员将会进行核查。


