If you want to quickly find assets with higher market attention from a large batch of U.S. stocks, the "Trading Volume Ranking" in the OKX Wallet is a very practical entry point.
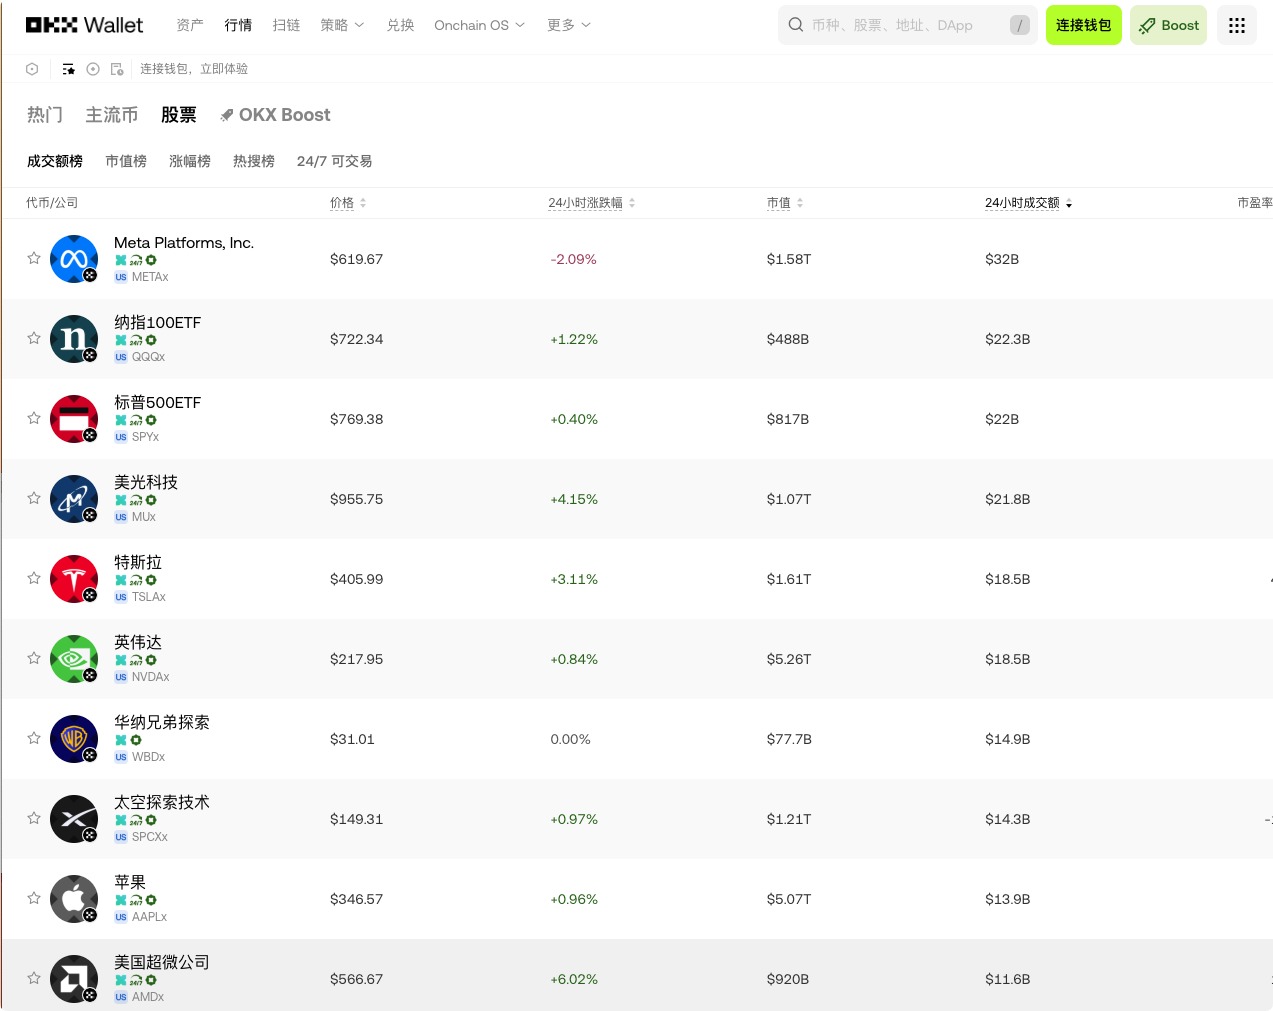
The 24-hour trading volumes of the top ten range from about 11.6B USD to 32B USD, covering Meta, Nasdaq 100 ETF, S&P 500 ETF, Micron, Tesla, Nvidia, Warner Bros. Discovery, SpaceX, Apple, and AMD.
However, it is important to clarify: trading volume ranking does not equal investment value ranking, nor does it equal future growth ranking.
A high trading volume indicates that more funds are currently trading, rebalancing, or hedging risks in the market. It can help users identify hotspots but cannot independently answer the question of “Is it worth buying now?” Truly valuable analysis should combine trading volume with market capitalization, price changes, industry logic, earnings expectations, and risk factors.
The Top Ten Assets in the Ranking
According to the data from the OKX Wallet, the data displayed at that time is as follows:
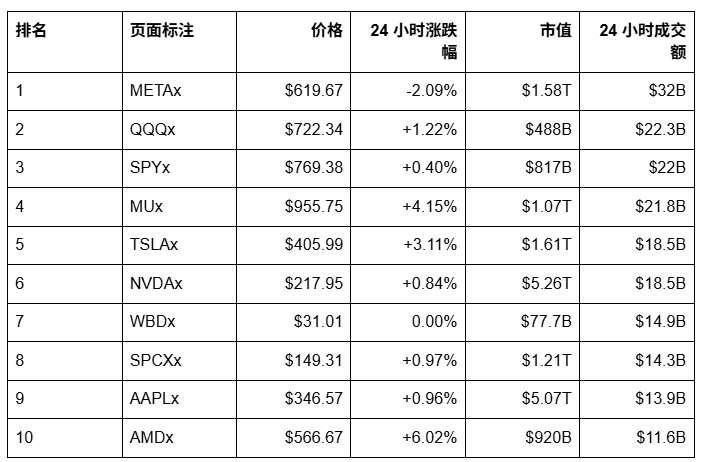
The list does not consist solely of individual company stocks. QQQx and SPYx are ETF mapped assets; WBDx and SPCXx should be verified according to the asset names and contract information displayed on the page. In particular, SPCXx is the SpaceX mapped asset, not SPYx which is the S&P 500 ETF, and the two should not be confused.
Category One: High Trading Volume of METAx, What is the Market Trading?
METAx ranks first with a trading volume of about 32B USD in 24 hours, significantly higher than other assets on the list; its price is approximately 619.67 USD, down 2.09% over 24 hours, with a market capitalization of about 1.58T USD.
A high trading volume coupled with a price drop usually indicates a significant market divergence: some funds may be buying, while others may be taking profits or decreasing risk exposure. For Meta, the market will pay long-term attention to advertising business, social platform user scale, AI recommendation efficiency, Reality Labs investment, and capital expenditure.
Therefore, METAx is worth watching, but the focus should not just be on its top ranking, but rather to observe whether high trading volume is accompanied by price stabilization or further declines. If trading volume continues to expand while prices weaken, risk signals and attention signals may coexist.
Category Two: QQQx and SPYx, Suitable for Observing the Overall Market Rather Than an Individual Company
QQQx and SPYx represent the mapped assets of the Nasdaq 100 ETF and the S&P 500 ETF, respectively. QQQx has a trading volume of about 22.3B USD in 24 hours, while SPYx is around 22B USD, both making it to the top three in the ranking.
The value of these two assets lies in diversifying the risk of a single company:
- QQQx is more concentrated in large tech and growth companies;
- SPYx covers a broader array of large U.S. companies with a more balanced industry structure.
If users are optimistic about the overall performance of large U.S. tech companies but do not wish to bet on just one company, they can first study QQQx; if they want to observe a broader U.S. market, they can focus on SPYx.
However, ETF mapped assets will still be influenced by index components, market valuations, on-chain liquidity, and mapping mechanisms. A high trading volume in an ETF does not mean all constituent stocks will rise simultaneously.
Category Three: MUx, NVDAx, AMDx, AI Chip Trading Mainline Still Active
Micron, Nvidia, and AMD appearing in the top ten indicates that chips and AI infrastructure remain important trading mainlines in the market.
MUx: High Attention Under High Price Increase
MUx is priced at about 955.75 USD, with a 24-hour increase of 4.15% and a trading volume of approximately 21.8B USD.
The market logic of Micron is usually related to memory chip prices, AI server demand, data center capital expenditures, and supply-demand cycles. An increase accompanied by high trading volume indicates that funds are actively repricing, but the volatility of cyclical chip stocks may also be significant. Users should pay attention to whether the price increase is supported by improvements in fundamentals or mainly driven by short-term theme funds.
NVDAx: Largest Market Capitalization, But Trading Volume Not Necessarily Highest
NVDAx has a market capitalization of about 5.26T USD, making it one of the highest valued assets on the list; however, its trading volume is around 18.5B USD, lower than that of METAx.
This indicates that market capitalization and short-term trading volume are two distinct indicators. Long-term observations on Nvidia should include AI accelerator demand, data center revenue, customer capital expenditures, supply chain, and competition landscape. For high-valuation assets, the market often requires not only performance growth but also sustained rate of growth that exceeds expectations.
AMDx: Highest Price Increase on the List
AMDx is priced at approximately 566.67 USD, with a 24-hour increase of about 6.02% and a trading volume of around 11.6B USD, marking the highest increase on the list.
A high increase indicates a rise in market attention but also implies an increase in short-term volatility and risk of pullbacks. Key observations for AMD include data centers, AI chips, server CPUs, product pipelines, and competition with Nvidia. For assets that have already risen rapidly, one should not only look at the increase but also consider whether trading volume is stable, whether prices have shown signs of a pullback, and whether future earnings reports and product progress can meet expectations.
Category Four: TSLAx and AAPLx, Mature Giants Can Also Become High Volatility Trading Targets
TSLAx and AAPLx represent the mapped assets of Tesla and Apple, respectively. TSLAx has a trading volume of about 18.5B USD, with an increase of about 3.11%; AAPLx has a trading volume of about 13.9B USD, with an increase of about 0.96%.
TSLAx: Intersection of Company Narrative and Market Expectations
The trading logic for Tesla includes not only vehicle deliveries and profit margins but also long-term narratives related to autonomous driving, robotics, energy storage, and software revenue. Because the expected span is vast, prices can easily be influenced by product releases, delivery data, regulatory progress, and management statements.
High trading volume for TSLAx indicates strong divergence and trading willingness in the market. Users should differentiate between short-term volatility and long-term business fulfillment, and should not interpret a single-day increase directly as validation of a long-term trend.
AAPLx: Defense and Growth Balance for Large Market Cap Assets
AAPLx has a market capitalization of approximately 5.07T USD, second only to NVDAx; its trading volume is around 13.9B USD.
Key observations for Apple include iPhone sales, service revenue, gross margins, hardware upgrade cycles, AI features, and supply chain. Apple generally has high market attention and liquidity, but high market capitalization also means that the market has higher expectations for performance stability and future growth.
Category Five: WBDx and SPCXx, Special Assets on the List
WBDx: Restructuring in Media Business and Content Logic
WBDx is priced at about 31.01 USD, with a 24-hour trading volume of about 14.9B USD, and a price change of 0.00%, with a market capitalization of approximately 77.7B USD.
The market focus corresponding to WBDx usually includes streaming subscriptions, ad revenues, content assets, sports copyrights, debts, and corporate restructuring. Unlike AI chips or index ETFs, the repricing of media-related assets often depends on content performance, user growth, and capital structure.
SPCXx: High Attention on the SpaceX Mapped Asset
SPCXx is priced at about 149.31 USD, with a 24-hour increase of 0.97% and a trading volume of around 14.3B USD, with a market capitalization of about 1.21T USD.
It must be emphasized again that SPCXx is completely different from SPYx. SPCXx is the SpaceX mapped asset as labeled on the page, while SPYx is the S&P 500 ETF mapped asset. Users must verify asset names, networks, contract addresses, and product descriptions before trading.
The valuation logic associated with SpaceX may involve launch business, satellite internet, commercial space travel, and expectations for private company valuations. Due to differences in information disclosure, liquidity, and valuation methods from publicly listed companies, the risks of SPCXx cannot simply apply traditional U.S. stock valuation frameworks.
Why Are the Top Ten Trading Volumes Worth Watching?
They Can Quickly Discover the Concentration of Funds
The simultaneous appearance of AI chips, index ETFs, consumer tech, media, and aerospace assets in the ranking indicates that market funds are not limited to trading a single theme. The trading volume ranking can serve as the first layer of a filtering tool to observe market hotspots.
They Help Judge Liquidity
A higher trading volume usually means it is easier to find trading counterparts, and price discovery may also be more sufficient. However, the trading volume of on-chain assets cannot be entirely equated to traditional exchange trading volumes; it is still necessary to look at pool depth, slippage, bid-ask spreads, and exit conditions.
They Can Be Used in Combination with Price Changes
“High trading volume + increase” may represent fund chasing or trend strengthening; “high trading volume + decrease” may indicate selling pressure, divergence, or risk release; “low volatility + high trading volume” may represent large fund turnover or temporary price balance.
None of these three situations alone can draw a conclusion for buying, but all warrant further study.
How to Use the OKX Wallet for Further Filtering?
Users can first find targets through the “Trading Volume Ranking” on the OKX Wallet U.S. stock page, then switch to price, market capitalization, price change rankings, and 24/7 tradable dimensions for cross-observation.
A more practical filtering process is:
- Look at trading volume first to find the assets that the market currently focuses on;
- Then check price changes to judge whether funds are chasing, accumulating, or withdrawing;
- Next, look at market capitalization to differentiate between major ETFs, mature giants, and high-volatility thematic assets;
- Enter detail pages to check charts, liquidity, trading pairs, contracts, and networks;
- Combine earnings reports, product progress, and industry cycles to judge fundamentals;
- Set position limits, price ranges, and exit schemes before trading.
The OKX Wallet page provides 24/7 on-chain market prices and trading entrances, but “24/7 tradable” does not mean reduced risks, nor does it mean that the traditional U.S. stock market is open all day. Earnings reports, policies, and sudden news may occur during the closure of traditional markets, and on-chain prices may also exhibit rapid fluctuations.
Conclusion: Worth Watching
The top ten trading volume ranking in the OKX Wallet is worth watching because it consolidates current market fund attention, price changes, market capitalization, and liquidity onto one page.
However, the true purpose of the ranking is to “discover opportunities and establish observation lists,” rather than to make investment decisions for users. The high trading volume of METAx reflects market divergence, while QQQx and SPYx provide index-based observation entry points, MUx, NVDAx, and AMDx represent the main line of AI chips, TSLAx and AAPLx represent high-attention consumer tech giants, whereas WBDx and SPCXx correspond to unique asset logic such as media restructuring and commercial aerospace.
Exclusive Benefits for AiCoin Users
Use the OKX Web3 Wallet to "Invest in Assets Worldwide"!
Bind the invitation code 【AICOIN88】 to enjoy a 20% saving on trading costs (Gas optimization and other benefits)!
Download/upgrade the OKX Web3 Wallet now and catch the trend:
https://jump.do/xlink?checkProxy=true&proxyId=24
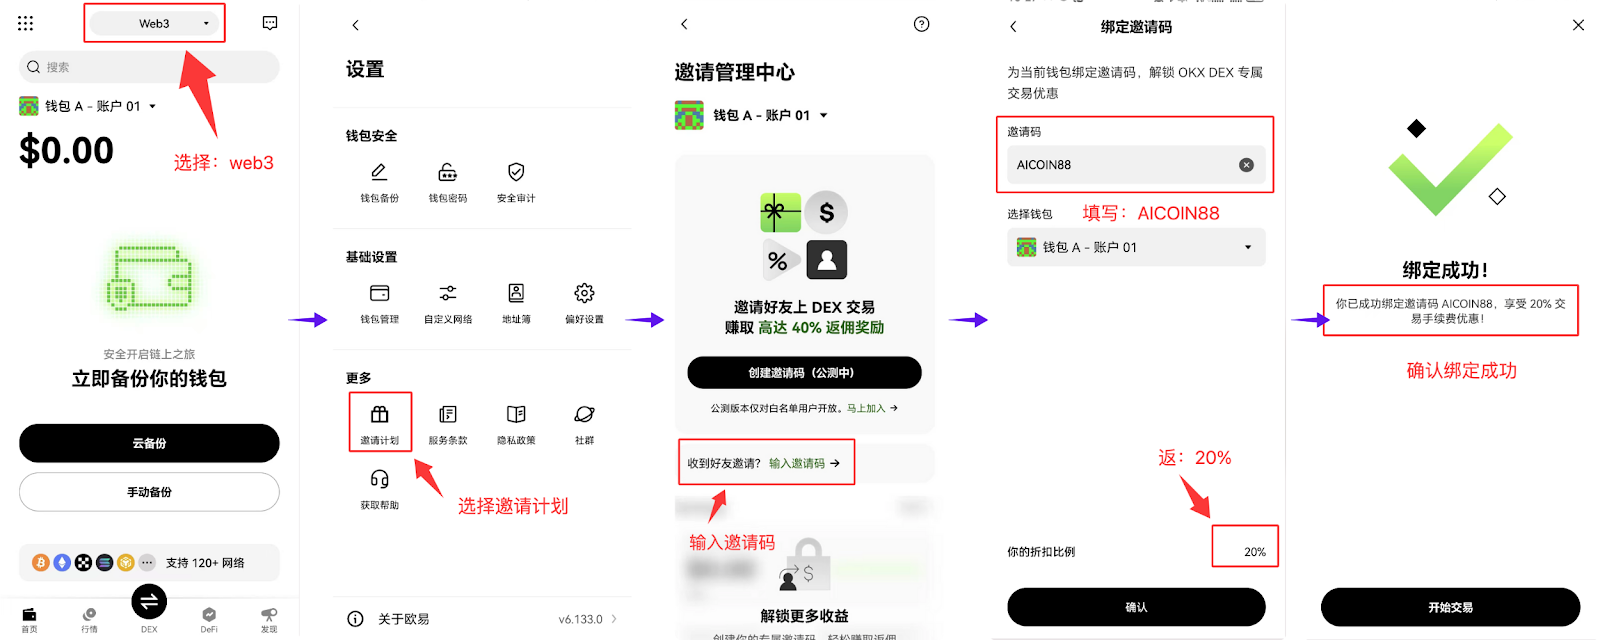
Using the exclusive invitation code 【AICOIN88】 to bind to the OKX Wallet is also easy to operate on the web!
https://web3.okx.com/ul/joindex?ref=AICOIN88
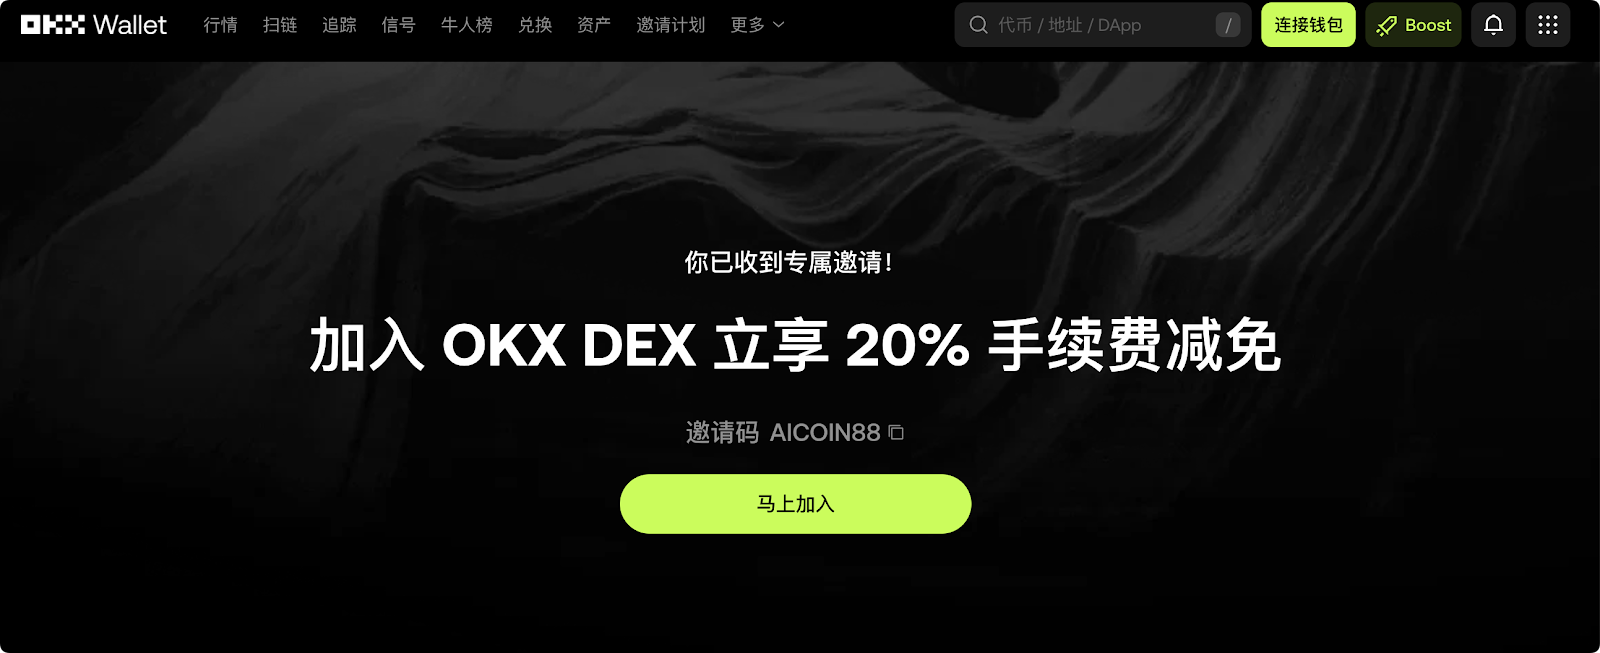
Don’t wait, set up the OKX Wallet, bind the offers and harvest new wealth!
免责声明:本文章仅代表作者个人观点,不代表本平台的立场和观点。本文章仅供信息分享,不构成对任何人的任何投资建议。用户与作者之间的任何争议,与本平台无关。如网页中刊载的文章或图片涉及侵权,请提供相关的权利证明和身份证明发送邮件到[email protected],本平台相关工作人员将会进行核查。