This morning, two events must be viewed together. The first, a giant whale withdrew 3,501 BTC from Bitstamp, worth $285.8 million, transferring it to a new wallet, which is often interpreted as long-term holding or cold storage, reducing sell pressure from exchanges. The second, BlackRock's ETF wallet transferred $356 million in BTC and ETH to Coinbase, with the large ETF assets coming into the exchange, the market's first reaction was fear of selling. One is withdrawing, and one is depositing, the directions are completely opposite. Additionally, Morgan Stanley purchased another 28.65 BTC, and Franklin Templeton launched a Nasdaq ETF reinvesting dividends in Bitcoin, indicating the actions of institutions are divergent: some are increasing exposure, while others are rebalancing. This discrepancy precisely explains why the current price is stuck around 80,641 USDT, neither going up nor down. The Qinglan Crypto Class has always emphasized that news only provides emotional context; the real direction should be determined by how prices move themselves.
Current price and time
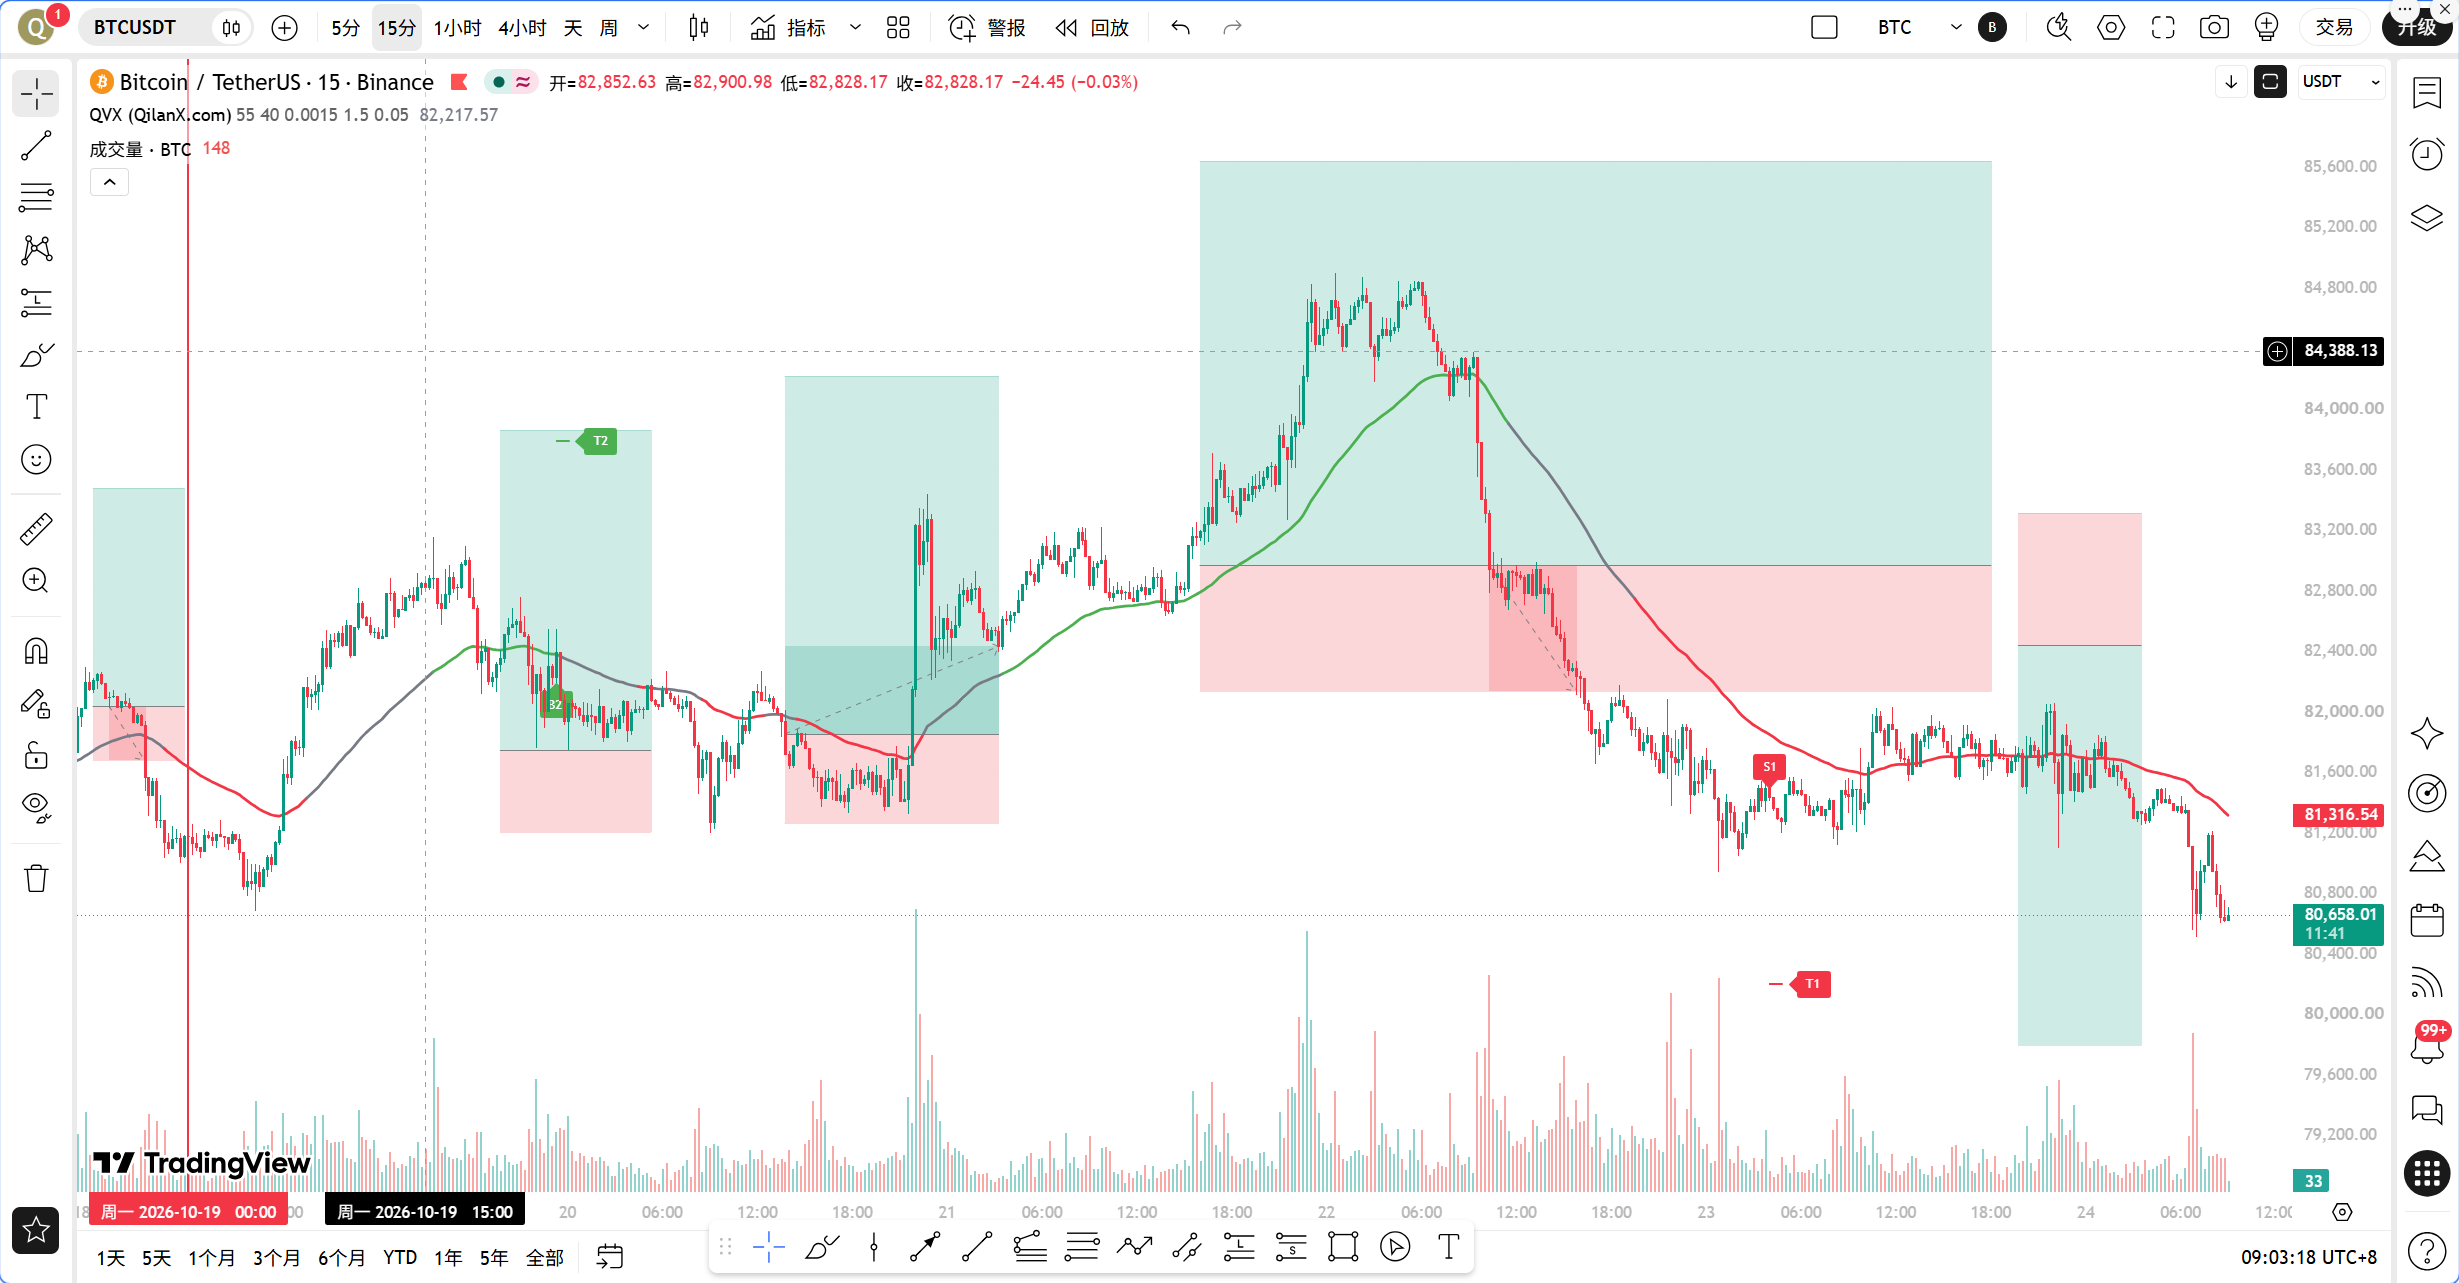
It is now October 24th, 09:03; BTC is quoted at 80,641 USDT, down 0.77% over the last 24 hours, with a market share of 59.48%. The fear and greed index is 51, neutral. Note a detail: the focal news mentioned BTC rebounded and broke through 82,000 USDT, with the decline narrowing to 1.03%, but the current price has fallen back to 80,641, indicating that the 82,000 position was gained and lost, raising doubts about the sustainability of the rebound. This is precisely the question today's title wants to ask: Who is lying? The answer is not in the news but in the candlestick chart.
Multi-period status overview
Daily level: MA5=82,073.65, MA10=81,977.52, MA30=83,224.68, price 80,641 is running below all three moving averages, with the moving averages displaying the early form of a bearish arrangement. The MACD's DIF=-183.40, DEA=120.60, bars=-304.00, with the DIF crossing below the zero line, the bar depth is negative, clearly indicating bearish momentum on the daily chart. RSI=41.14 is not yet in the oversold zone, indicating there is still downward space on the daily level, not a safe cushion for bottom fishing.
4-hour level: MA5=81,306.20, MA10=81,459.20, MA30=82,277.15, price is also below all three lines. The MACD's DIF=-353.87, DEA=-162.88, bars=-190.99, with the dual lines below the zero line and the bars remaining negative. The most striking is the RSI=12.18, which is an extremely oversold reading. Sister Qinglan wants to remind you: when the 4-hour RSI approaches 12, it historically often corresponds to the end of a sharp decline, leading to technical rebounds, but oversold does not equal a reversal; it only indicates that the decline has been too rapid and needs correction.
1-hour level: MA5=80,933.26, MA10=81,215.64, MA30=81,512.09, price 80,641 is below all moving averages. The MACD's DIF=-279.00, DEA=-195.01, bars=-83.99, bearish momentum is still being released. RSI=29.80 has just dropped below 30, entering the edge of overselling. EMA55=81,864.68 is the core anchor point for all today's judgments.
15-minute level: MA5=80,731.06, MA10=80,829.07, MA30=81,211.69, price is close to MA5, suggesting a flattening in the short term. The MACD's DIF=-209.45, DEA=-168.85, bars=-40.60, with the bars being negative but narrowing. RSI=30.89 has slightly rebounded from a low position. The 15-minute period is the one closest to stabilizing among the four cycles, but this is merely "a slowdown in decline," not "turning bullish."
TPV signal verification
First, let's look at the trend positioning. Current price 80,641, 1-hour EMA55=81,864.68, the price is below EMA55, indicating a bearish trend area, there is no dispute about this.
Check the long positions against three conditions: First condition, the price stabilizes above the 1-hour EMA55, requiring two consecutive 1-hour candlestick close prices greater than EMA55; the current price is 1.49% away from EMA55, and the past eight 1-hour candlestick close prices greater than EMA55 was 0/8, zero crossings, the first condition is completely unmet. Second condition, support stabilization pattern, the 15-minute level shows signs of flattening, but the 1-hour level has not seen a long lower shadow, bottoming pattern, or clear signals showing increased volume and stagnation. Third condition, the downwards momentum is weakening; the 1-hour MACD bars=-83.99 are still in the negative expansion zone, RSI=29.80 has just broken from above 30 rather than rebounding from below, and a bullish engulfing pattern has not appeared. All three conditions are unmet, providing zero signals for going long.
Check the conditions for short positions against three criteria: First condition, the price is pressured below the 1-hour EMA55, with two consecutive 1-hour candlestick close prices below EMA55, satisfied. Second condition, pressure meets resistance; the price rebounded to around 82,000 and then fell back, 82,000 to 81,864 area is where EMA55 is located, forming an effective resistance zone, satisfied. Third condition, weak rebound; the 1-hour MACD bars remain negative, RSI near 30 is failing to make upward progress, satisfied. All three conditions are simultaneously met; the TPV system gives a signal for continuing bearish trends.
Handling fluctuating market conditions: The past eight 1-hour candlestick close prices greater than EMA55 was 0/8, zero crossings, with the price at a 1.49% distance from EMA55, far greater than the 0.3% threshold, this does not meet the definition of fluctuation, the current situation is in a one-sided trend, adhering to trend rules to execute and not engaging in range trading.
On-chain/funds status
The fear and greed index is 51, neutral, indicating market sentiment is neither fearful nor greedy, under such conditions, prices are more likely to move along technical directions. BTC's market share is 59.48%, with funds still concentrating on Bitcoin, causing altcoins to face pressure. The total liquidation across the network in 24 hours is $325 million, with long positions accounting for $249 million, and the bullish leverage being heavily liquidated; this indicates a short-term bearish outlook but also means that some of the selling pressure above has cleared. Seven addresses placed $42 million in sell orders between 83,400 and 85,000, which is a clear upper resistance wall. Bank of America warned that global risk-averse sentiment may continue until mid-November, with a macro view leaning towards suppression. Overall, the funding situation is slightly bearish but not extreme, with institutions increasing holdings and the ETF inflows into exchanges creating hedges that prevent prices from having one-sided explosive fuel.
Key Attack and Defense Points
The first defense line above is 81,864.68, that is, the 1-hour EMA55, which is the dividing line between long and short; if the price cannot stand above it, every rebound is merely a repair. The second is the round number at 82,000, the high point mentioned in the news for the rebound is around here. The third is the dense order area between 83,400 and 85,000; do not fantasize about a breakthrough without increased volume. Below, support is first looked at the psychological barrier of 80,000, and then further down is around 79,000; if 80,000 is lost and the 4-hour RSI continues to dull from the oversold area, caution is needed for an accelerated downturn.
Trading Thoughts
Direction: Bearish trend, mainly shorting on rebounds, do not bottom out against the trend.
Entry condition: Wait for the price to rebound to the range of 81,500 to 81,864, that is, enter when approaching the 1-hour EMA55 but unable to stabilize. A stricter confirmation is: the 1-hour candlestick closes with a long upper shadow or a bearish engulfing below the EMA55, and the MACD bar does not show a significant reduction; at this time, enter to short. If the price directly increases volume and stands above 81,864, closing two consecutive 1-hour candlesticks above it, then the short strategy will be voided, and the position will be changed to wait and see.
Stop-loss: Place it above 82,200, that is, leave a buffer above the 82,000 round number to avoid spike stop losses.
Target price: First target 80,000, second target 79,000. After reaching the first target, reduce half of the position, and move the stop loss of the remaining position down to the entry price to protect profits.
Risk Warning
The 4-hour RSI at only 12.18 is extremely oversold, and a rapid rebound may occur at any time; shorts must carry stop losses and should not hold heavy positions against the market.
Follow the Qinglan Crypto Class to grasp more trading opportunities! Welcome to visit the official website www.qinglan.org
📊 Qinglan TPV Trading Strategy Backtest Reference
🕒 Last Backtest Time 10-24 07:00:01
Total Analysis: 4,619 Backtests: 4,611 Accuracy Rate: 77.3% (3,564/4,611)
免责声明:本文章仅代表作者个人观点,不代表本平台的立场和观点。本文章仅供信息分享,不构成对任何人的任何投资建议。用户与作者之间的任何争议,与本平台无关。如网页中刊载的文章或图片涉及侵权,请提供相关的权利证明和身份证明发送邮件到[email protected],本平台相关工作人员将会进行核查。