Good afternoon everyone, I am Xinya, recently handling things generally and relatively proactively. Let’s first briefly review the market conditions from the past two days. In the weekend night session, the Bitcoin peaked at 82200 and started to decline, dropping to around 80600 at four in the morning on the 19th, where it began to rebound, breaking through 82200 and reaching a high of 83150. At five in the afternoon, after an hour of tm13, it turned downwards, with a low of 81169 at nine in the morning.
The pullback process saw some rebounding after an hour of td yin9, but the strength was minimal, and after being pressured at 82200, it turned down again, facing pressure at this level for the second time at noon twelve.
The crucial divergence zone is evident, with 82200 becoming an important pivot for bulls and bears, and the hourly ema144 is also at this level; the four-hour ema120 and 144 are at 82800, while the hourly ma30 and four-hour ma120 are around 81800, the latter corresponding to the position of an hour of tm yin9. The reason for such a large divergence between bulls and bears recently is because the market is operating in a four-hour level oscillation, nearing its conclusion.
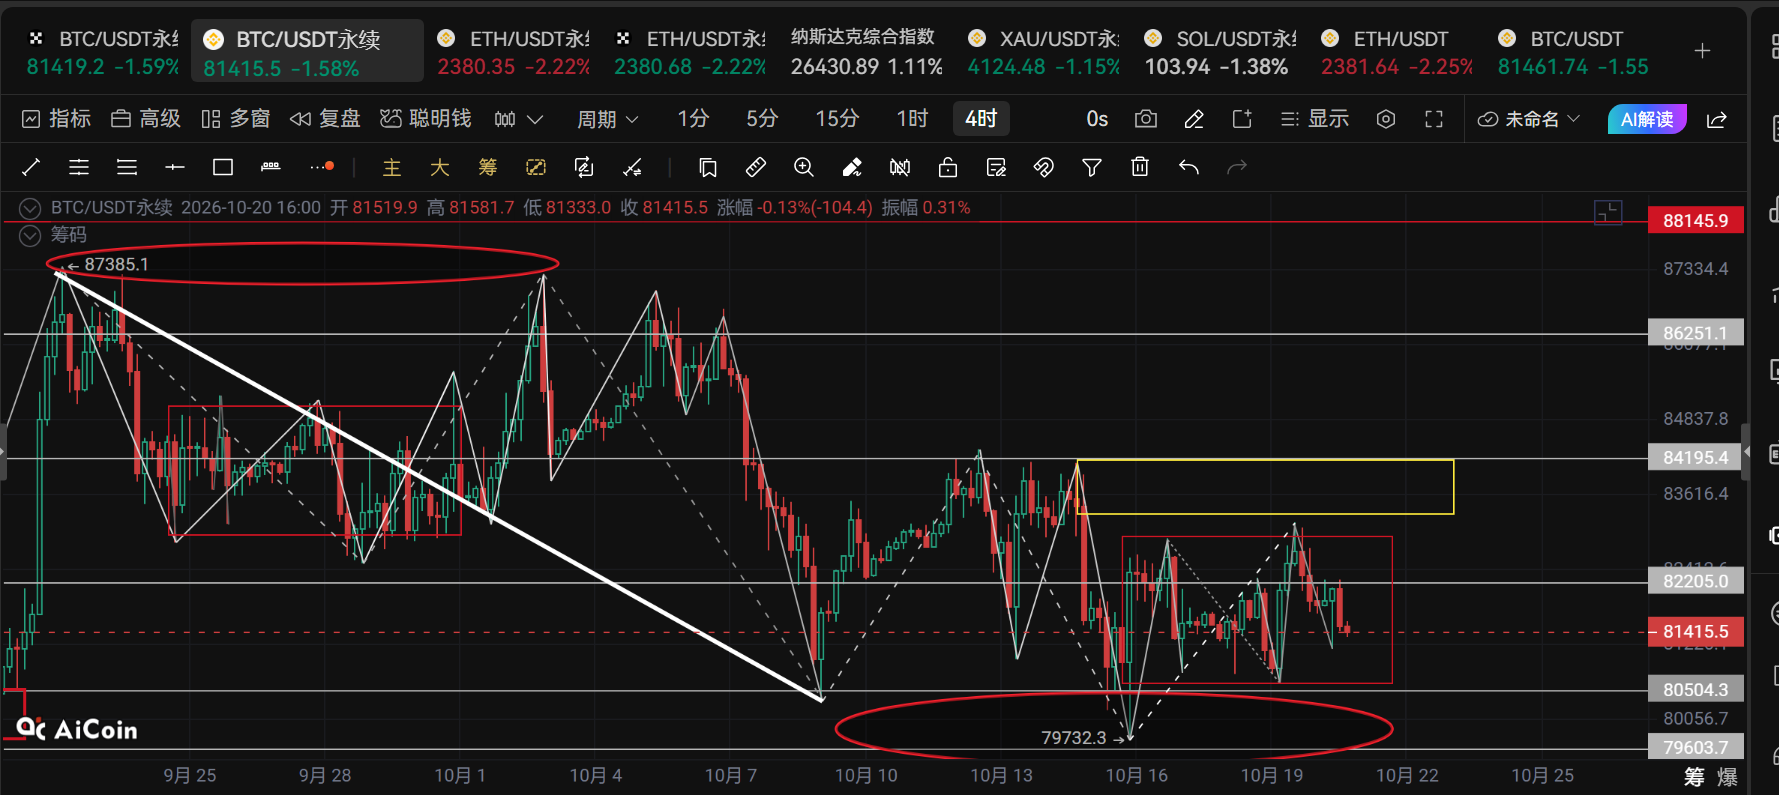
Let’s take a look at the structure over the past month. The Bitcoin dropped from midnight on September 22 to midnight on October 9, forming a downtrend. To avoid complicating the understanding later, we simplify the daily line’s movement. There is only one daily line center.
After this measure is completed, the market engaged in a four-hour oscillation, with the first move upwards from midnight on October 9 to noon on October 12, ranging from 80400 to 84200, and the second move down from October 12 to eight in the evening on October 15, in the range of 84200-79800, while the third move upwards is relatively strong, in the range of 79800-83200. It is clear that the structure is very complete. The second daily line center has emerged, between 80600 and 82800. The latter corresponds to the four-hour ema120 and ema144.
So, how does this relate to the future market? By linking the previous simplified movement, does it suggest a potential for a daily level decline? Because there are only two paths once the four-hour oscillation concludes, one is a strong breakout above the centerline, failing to retrace, and then proceeding with a four-hour three-buy signal, starting an upward segment, conversely, if it effectively breaks below, failing to retrace into the centerline, it will initiate a four-hour downward segment.
Let’s take a closer look. From October 9 to October 15, the first upward move in four hours entered the previous four-hour center. This initially disrupted the continuity of the decline, followed by a pullback that reached around 79700, refreshing a new low, ruining the reversal possibility, and the pullback into a third rebound was then thwarted at the previous center.
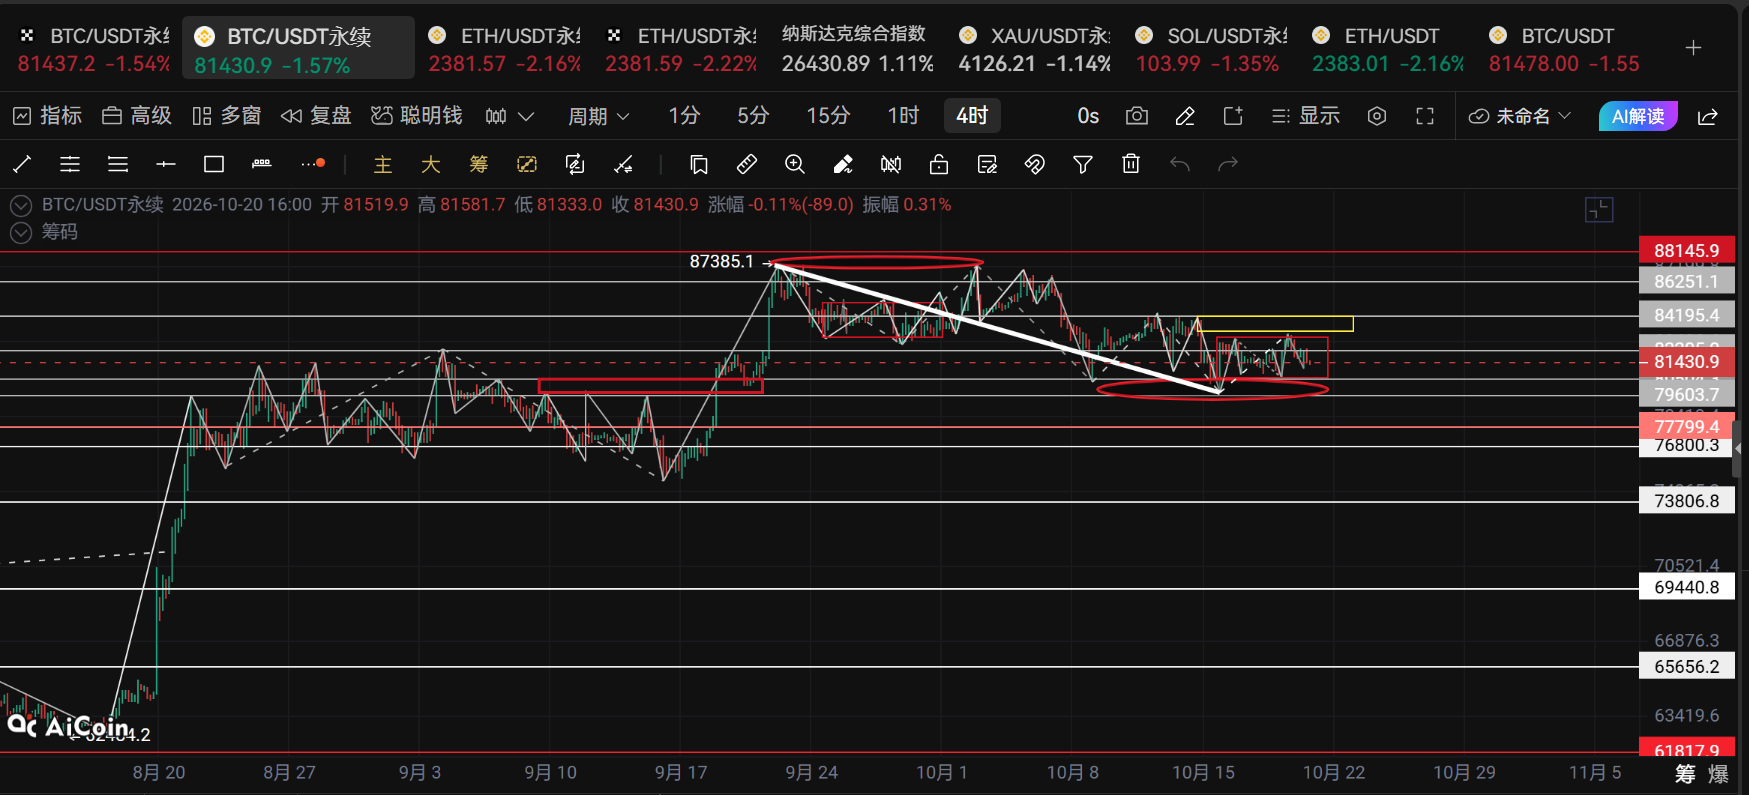
The market divergence is between the four-hour upwards and downwards, and the daily reversal is unrealistic, but the probability of forming a daily oscillation has now far exceeded that of a daily decline.
Currently, we are running a new one-hour oscillation within the four-hour oscillation, and thus several structures for the future market have been presented.
The first scenario involves completing a downward one-hour movement and starting a new upward one-hour movement. If it breaks through 84200 and retraces above 83200, then the market will upgrade to a four-hour rise, potentially reaching 86200, and if strong, 89500.
The second scenario involves this one-hour downward move effectively breaking below 79600 and failing to retrace to 80500, which upgrades to a four-hour decline, potentially reaching 76800 and 73800. If the market develops in this way, it will complete a daily decline and start a new daily reversal.
The third scenario involves the one-hour oscillation extending the four-hour oscillation, and as it progresses, the market will become a daily oscillation. One should focus on the following positions.
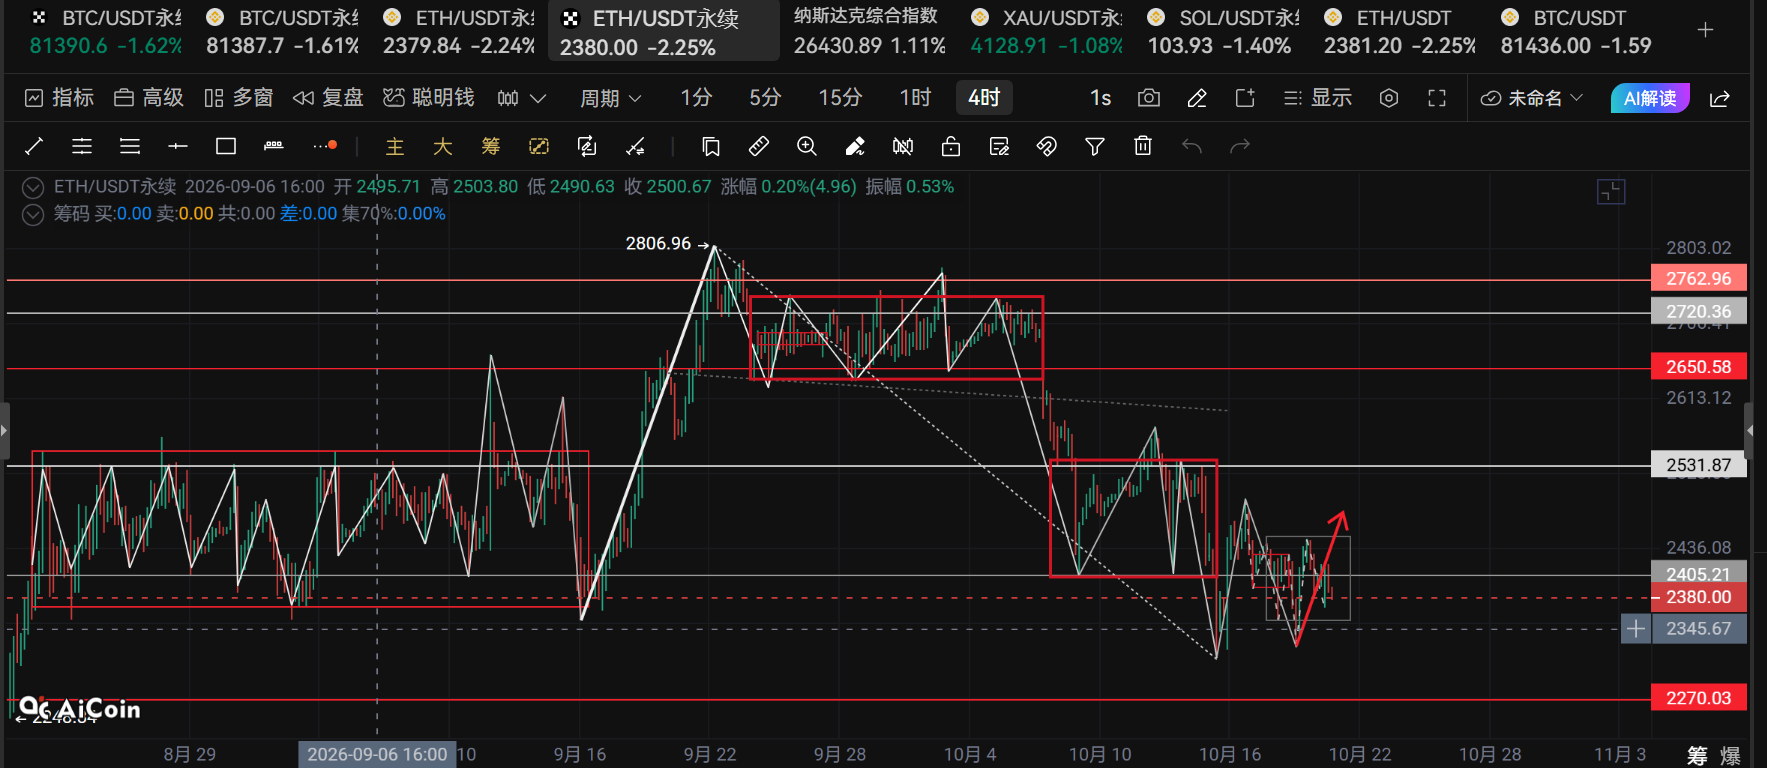
Thus, in the future market, the important positions are within the following four-hour range, including the downward shifts.
Watch 79600, 80500, 81200 below Bitcoin.
Watch 81800, 82800, 83500 above.
Watch 2405, 2445, 2485 above Ethereum.
Watch 2380, 2350, 2320 below.
Important periodic positions.
Below Bitcoin, 80500, 77500, 73800.
Above, 82800, 85200, 87800.
For Ethereum, 2315, 2250, 2168 below.
Above, 2450, 2520, 2585.
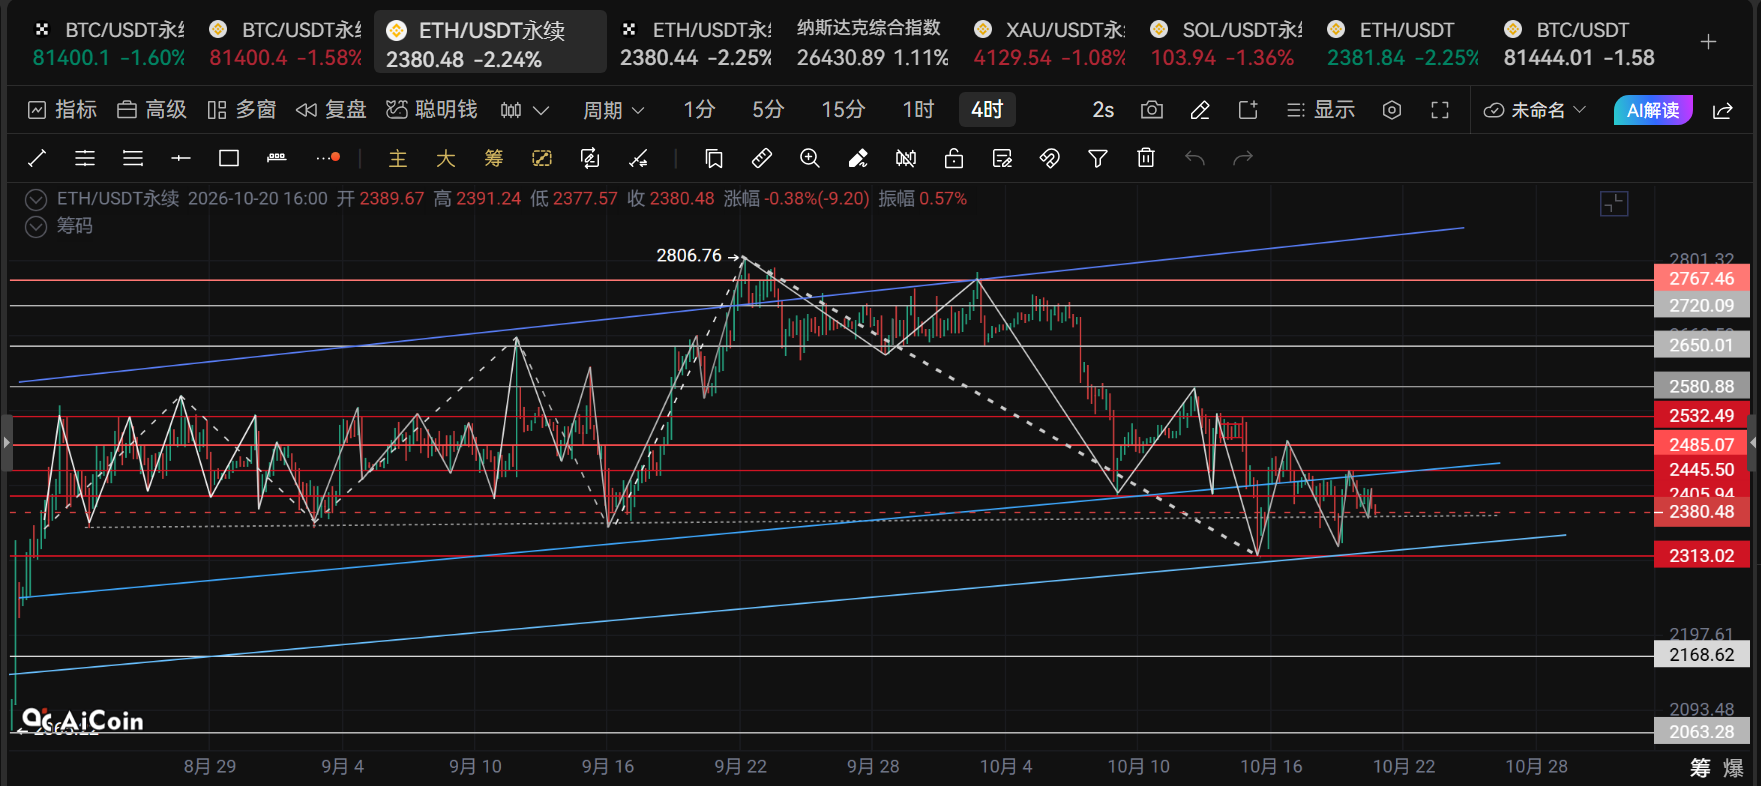
The subsequent handling requires attention to this period's operational status, first giving possibilities, leaving room for you to think; currently, as the four-hour oscillation concludes, the inclination is towards a four-hour upward to initiate an early reversal.
For updates, follow the public account: Xinya Diary.
免责声明:本文章仅代表作者个人观点,不代表本平台的立场和观点。本文章仅供信息分享,不构成对任何人的任何投资建议。用户与作者之间的任何争议,与本平台无关。如网页中刊载的文章或图片涉及侵权,请提供相关的权利证明和身份证明发送邮件到[email protected],本平台相关工作人员将会进行核查。