Author: AiPlot Research Institute
Focus: RWA / Digital Assets / Deep Analysis of Financial Infrastructure
Website: https://aiplot.com/?utm_source=aicoin
1. First, the conclusion: Micron's investment logic has upgraded from "storage reversal" to "AI storage infrastructure reassessment"
This presentation reveals four mutually reinforcing signals.
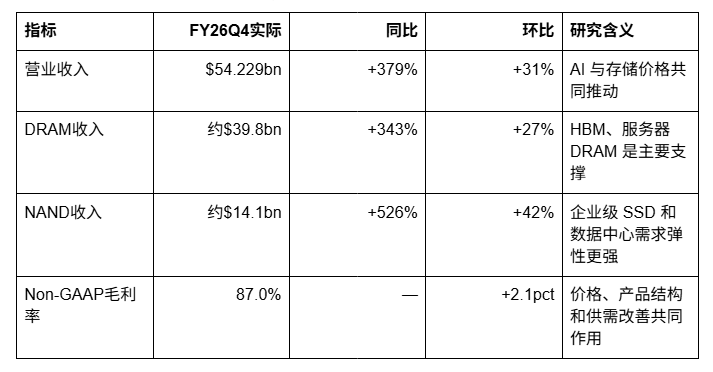
First, performance growth has already transmitted from the revenue side to the profit and cash flow side. Micron's FY26Q4 revenue was approximately $54.229 billion, a year-over-year increase of about 379% and a quarter-over-quarter increase of about 31%; of which DRAM revenue was about $39.8 billion, a year-over-year increase of about 343% and a quarter-over-quarter increase of about 27%; NAND revenue was about $14.1 billion, a year-over-year increase of about 526% and a quarter-over-quarter increase of about 42%. Non-GAAP gross margin reached about 87.0%, an increase of 2.1 percentage points quarter-over-quarter.
Second, the pull from AI storage is not solely coming from HBM. HBM is the most focused category, but CSP self-developed ASICs, Agentic AI servers, DDR5, LPDRAM, enterprise-level SSDs, and KV Cache layered storage are forming multiple sources of demand. The report points out that Micron's FY26Q4 data center SSD revenue was nearly $10 billion, exceeding ten times that of the same period last year, indicating that AI-driven storage demand has expanded from a single high-bandwidth memory to server memory and storage systems.
Third, long-term agreements are changing the cyclical nature of Micron's profitability. By the end of FY26, the company had signed a cumulative total of 26 SCA, significantly increasing from 16 in the previous quarter, covering more than 35% of revenues before 2030; prepaid and funding commitments rose from about $22 billion to about $32 billion, RPO rose from about $100 billion to about $150 billion, with some agreements extending to 2031.
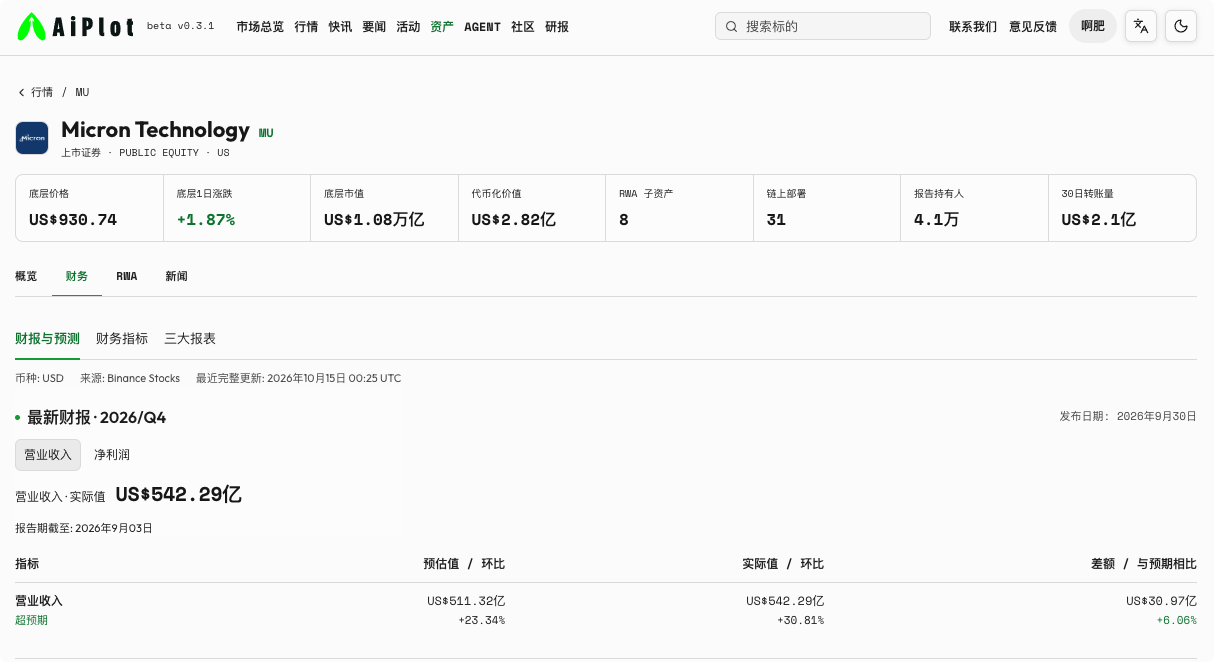
Fourth, the market has already reflected part of the "high profitability in the coming years" in valuations. The AiPlot page provided by users shows that on October 15, 2026, Micron's stock price was about $930.74, with a tokenized market capitalization of about $282 million; broker research reports indicated a stock price of $1,035.84 and a market capitalization of about $1,169.9 billion based on data from October 8, 2026, and with a FY27E price-to-earnings ratio of 8, a target price of $1,457 was given.
Hence, Micron is not a simple "AI beneficiary stock" story, but a cyclical growth stock that needs to simultaneously answer three questions:
- Can AI demand continue to grow faster than storage supply?
- Can long-term agreements lock in high profits for a longer time?
- Has the current valuation already reflected supply-demand tightness and repurchase expectations?
2. The real surprise comes from profit margins and operating leverage
1. Revenue Structure: DRAM is the mainstay, NAND grows faster
2. Exceeds market expectations
The company's guidance for FY27Q1 is:
- Revenue $61.5±1.5 billion;
- EPS $38.15±1;
- Gross margin approximately 86.25%.
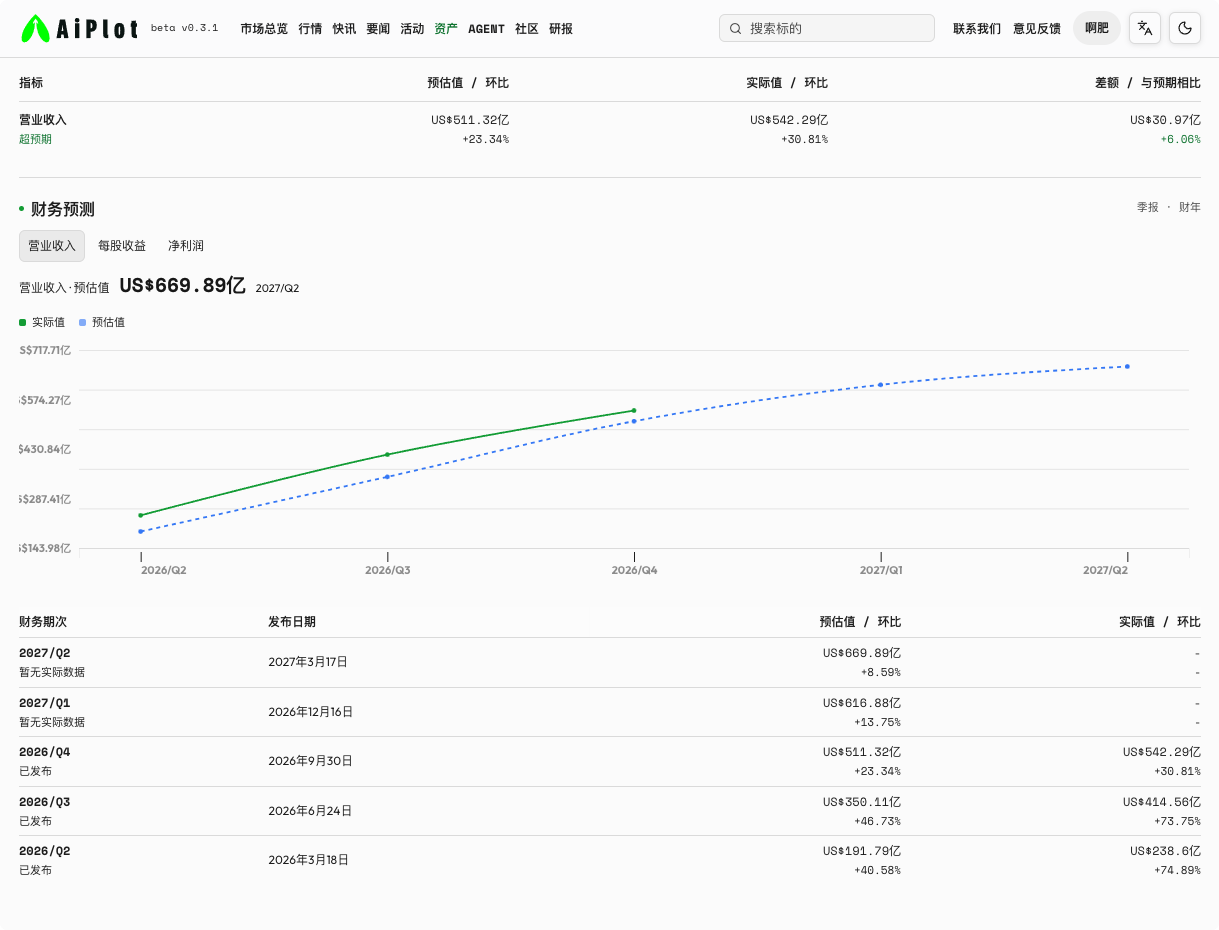
According to AiPlot's forecast page, FY27Q1 revenue is estimated at approximately $61.688 billion, EPS is estimated at approximately $38.15; FY27Q2 revenue is estimated at approximately $66.989 billion, EPS is estimated at approximately $42.15.
This indicates that the key market expectation is not whether there will be continued growth in the next quarter, but whether Micron can maintain an extremely high profit conversion rate in FY27. High revenue growth is not difficult to explain; what really needs observation is:
- After the new HBM prices are implemented, will gross margins improve further;
- Is the 86.25% in FY27Q1 indeed the low point for the entire year;
- Will new factory launches, employee incentives, and rising depreciation offset price increases;
- Can the strong growth of NAND be maintained, rather than being a one-off inventory restoration?
3. Key changes in AI storage demand: HBM is not the only main line
1. HBM: From high bandwidth component to capacity constraint of AI clusters
HBM directly connects GPUs, AI accelerators, and high-bandwidth computing systems, making it a key storage component in AI training and inference infrastructure. Its prices and profit margins are generally higher than ordinary DRAM, but production is also more complex, requiring advanced packaging, stacking, yield, and capacity coordination.
The report indicates that the gross margin for the cloud memory sector where HBM is located in FY26Q4 was about 83%, lower than the company's overall gross margin of about 87%. This seems unusual, but the reason may lie in:
- New HBM prices have not yet fully landed;
- Products are still in the capacity ramp-up and customer certification stages;
- New product packaging and startup costs are high;
- Depreciation from scale growth has not yet been fully diluted.
Therefore, the investment value of HBM should not only consider demand growth but also the transition from "volume" to "high-profit volume." If HBM contract prices significantly rise in FY27 while yield and capacity utilization improve simultaneously, the margin gap between HBM and conventional DRAM may narrow, driving overall company profitability upward.
2. Server DRAM: AI inference allows general memory to regain pricing power
AI servers require more than just GPUs and HBM. As model inference, Agentic AI, and self-developed ASIC servers expand, DDR5, LPDRAM, and other server memory will also need to increase.
Especially in inference scenarios, as models are deployed to a wider range of applications and devices, the number of servers may be larger than training clusters, leading to demand characteristics such as:
- Wider scale of devices;
- Sustained requirements for memory capacity and bandwidth;
- More likely to form parallel multi-generation products;
- Demand is not concentrated on a few projects like a single training cluster.
The report predicts that from 2027 to 2028, DRAM bit shipments will increase by about 20%, significantly higher than supply growth; this means that the tight state of the storage cycle may not end quickly.
3. Enterprise-level SSD: AI is reconstructing the storage layers of data centers
The demands generated by AI applications are not only computational but also produce significant data reads and writes, model parameters, vector databases, caches, and checkpoint data. The report points out that Micron's FY26Q4 data center SSD revenue was nearly $10 billion, with a year-over-year increase of over ten times.
This indicates that the logic of NAND demand is changing:
- AI training requires substantial data reads and writes;
- Inference services need low-latency access to models and data;
- KV Cache layered storage may drive architectural reconstruction between DRAM, SSDs, and HDDs;
- Enterprise-level SSDs are expected to replace some traditional HDD scenarios;
- Storage capacity and performance are becoming system-level bottlenecks for AI clusters.
Thus, one cannot explain all NAND demand using the past "PC and mobile inventory cycle" framework. NAND remains a more cyclical business, but enterprise-level SSDs are becoming much closer to a part of AI infrastructure capital expenditures.
4. Long-term agreements are the most important structural change in Micron's current cycle
1. What 26 SCAs mean
As of the end of FY26, Micron has signed a cumulative total of 26 long-term supply agreements, covering more than 35% of revenues before 2030; some agreements have already extended to 2031.
In traditional storage cycles, customers often procure through spot or short-term contracts, with chip prices and supply fluctuating with the cycle. Long-term agreements will change this model:
- Customers gain assurance of future supply;
- Micron gains greater revenue visibility;
- Capacity expansion has clearer demand anchors;
- Prepayments and funding commitments reduce financing uncertainty for expansion;
- If the pricing mechanism is near current market prices, the profit bottom may be higher than historical cycles.
2. Long-term agreements do not equate to fixed price contracts
It is necessary to avoid simplifying SCAs to "locking in high prices." The report indicates that new signed agreements are negotiated based on current market prices, higher than previous agreements based on CQ2 prices.
A more accurate understanding is:
Long-term agreements lock in demand visibility and customer relationships, not necessarily locking in all prices and profits.
When market prices are rising, agreements may help Micron pass price increases onto customers; when market prices are falling, the pricing mechanisms, minimum commitments, and product ranges in the agreements will determine the profit floor. Investors need to continue focusing on:
- Whether the agreements are fixed-price, floating-price, or have minimum price guarantees;
- Whether prepayments are refundable or offset against purchases;
- Compensation mechanisms when customers do not meet purchase commitments;
- Whether the coverage for HBM, DRAM, and NAND differs;
- Whether agreements after 2030 still have economic constraints.
3. Long-term agreements enforce capital expenditures but do not eliminate supply risks
The company raised its full-year capital expenditure guidance to over $50 billion, from a previous forecast of over $45 billion, with the increment primarily for plant and cleanroom construction, aiming to accelerate production by the end of 2028 and beyond.
This seems to increase future supply, but in the short term may not immediately alleviate supply-demand tightness in 2027–2028:
- Wafer fabrication and cleanroom commissioning takes time;
- HBM capacity ramp-up is constrained by packaging and yield;
- New plant commissioning does not equal immediate release of effective bits;
- Capacity may prioritize service to already signed long-term agreements;
- Competitors are also simultaneously increasing AI storage capacity.
Therefore, the capital expenditure increase can be interpreted as "the company has confidence in future order visibility," but it also means that depreciation, cash flow, and supply release will become important constraints for future valuations.
5. Profit quality: Micron is experiencing rapid release of operating leverage
The AiPlot financial metrics page provided by users shows that Micron's FY26Q4:
- EPS is approximately $32.87;
- ROE is approximately 61.4%;
- ROA is approximately 43.38%;
- Equity ratio is approximately 70.64%;
- Current ratio is approximately 3.31 times;
- Price-to-earnings ratio is approximately 12.91 times;
- Price-to-book ratio is approximately 7.94 times.
The page also shows that FY26Q4 free cash flow was approximately $32.863 billion, a year-over-year increase of approximately 45,543.06%; cash flow from financing activities was about $11.276 billion, and net cash flow was about $13.369 billion.
These metrics together indicate that Micron has transitioned from the previous cycle's "heavy asset, low profit, cash flow pressure" state to a phase of "high prices, high capacity utilization, high operating leverage."
However, these extremely high ROE, ROA, and free cash flow growth rates cannot be directly extrapolated to a perpetual state. There are three reasons:
First, rising storage prices will simultaneously uplift revenue and profits, causing profitability and returns to improve non-linearly during the upward cycle;
Second, capital expenditures and inventory will rise during expansion cycles, so current free cash flow may be higher than future normalized levels;
Third, the higher the profits, the more motivation there is for the industry to expand production, which will ultimately depress prices through increased supply.
Therefore, when analyzing Micron, one should not only ask "how high is the current ROE," but rather: How much free cash flow can the company still generate in a scenario where prices drop by 20%-30% while capital expenditure remains elevated?
6. Balance sheet and cash flow: cash creation capabilities enhanced, but expansion will consume capital
AiPlot shows that Micron's FY26Q4 total assets were approximately $195.888 billion, a year-over-year increase of about 136.59%; the equity ratio is approximately 70.64%, indicating a strong equity base amid asset expansion.
The cash flow structure indicates:
- Operating cash flow significantly improved with rising profits;
- Cash flow from investing activities was approximately -41.953 billion dollars, reflecting ongoing capital investment;
- Cash flow from financing activities turned positive, at approximately $11.276 billion;
- Net cash flow was approximately $13.369 billion.
This suggests that Micron is not simply "earning cash without investing," but is simultaneously undertaking three tasks:
- Generating cash through high profits;
- Expanding HBM, DRAM, and NAND capacity through capital expenditures;
- Preparing room for future repurchases and shareholder returns.
The company plans to increase shareholder returns after two years of being under the subsidy agreement of the CHIPS Act, starting from December 9, 2026, and intends to return excess cash to shareholders in the long term.
Share repurchases are particularly important for Micron as they may enhance EPS by reducing the number of outstanding shares, creating a dual push of "profit growth + equity reduction." However, whether repurchases create value depends on:
- Whether the repurchase price is below normalized earnings value;
- Whether the repurchase squeezes investments in HBM and advanced capacity;
- Whether the company conducts large-scale repurchases at the cycle peak;
- Whether there is a dynamic balance between capital expenditures and shareholder returns.
7. Valuation: 8 times FY27 PE seems cheap, but cyclical stocks should not only be viewed by low PE
Brokers' reports predict Micron's FY27-FY29:
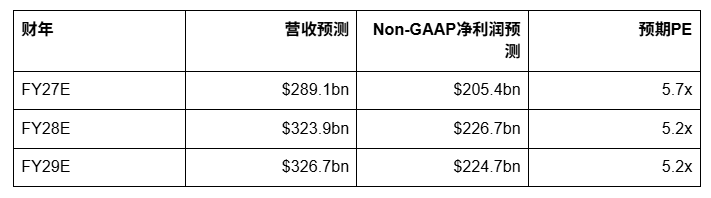
The report gives a target price of approximately $1,457, maintaining an "overweight" rating based on an FY27E PE of 8 times; comparable companies have an average FY27E PE of approximately 4.9 times, indicating that Micron's corresponding valuation carries a certain premium.
From a static valuation perspective, Micron does not seem expensive. However, low PE for storage stocks often indicates one of two possibilities:
- The market undervalues profitability sustainability;
- The market expects profits to be at the cycle peak.
The logic behind Micron gaining a valuation premium this time mainly comes from:
- The sustainability of AI storage demand being higher than traditional PC/mobile cycles;
- Improved product structure with HBM and enterprise-level SSD;
- Long-term agreements covering over 35% of revenues before 2030;
- Relative scarcity of domestic HBM suppliers in the US;
- Potential acceleration of capital returns in FY27.
However, valuation still requires normalization testing. A simple stress test is:
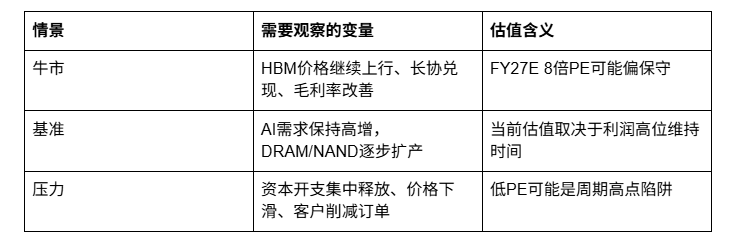
The core of Micron's valuation is not "5 times or 8 times PE," but rather how much future high profitability the market is willing to treat as sustainable profit, rather than a one-off cyclical peak.
8. Competitive Landscape: Micron's strengths and weaknesses
The research report selects SK Hynix, Samsung Electronics, Kioxia, and SanDisk as comparable companies.
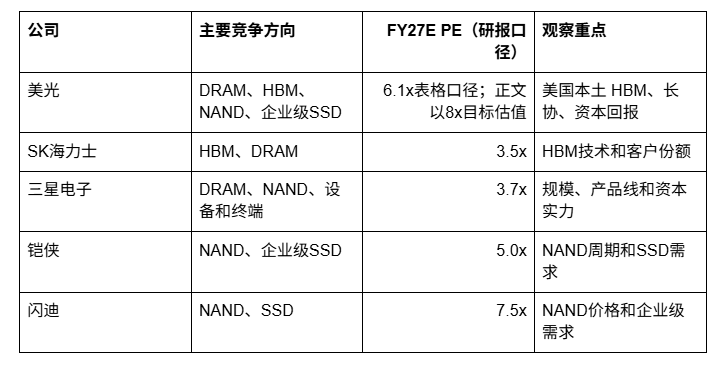
Micron's relative advantages are:
- Local storage suppliers are scarce in the United States;
- Simultaneous benefits in HBM, server DRAM, and enterprise-level SSD;
- Rapid increase in long-term agreement coverage and customer funding commitments;
- Capital return plans may improve EPS;
- Product structure has the opportunity to shift from ordinary storage to AI infrastructure storage.
Micron's relative risks are:
- Competition with SK Hynix in HBM;
- Samsung's advantages in scale, capital, and product line;
- NAND remains sensitive to price cycles;
- Large-scale capital expenditures lead to depreciation and supply release pressure;
- Concentration of AI customers and reliance on a few CSP capital expenditures.
9. RWA Perspective: Why Micron is suitable to become a "tokenization of industrial assets" case
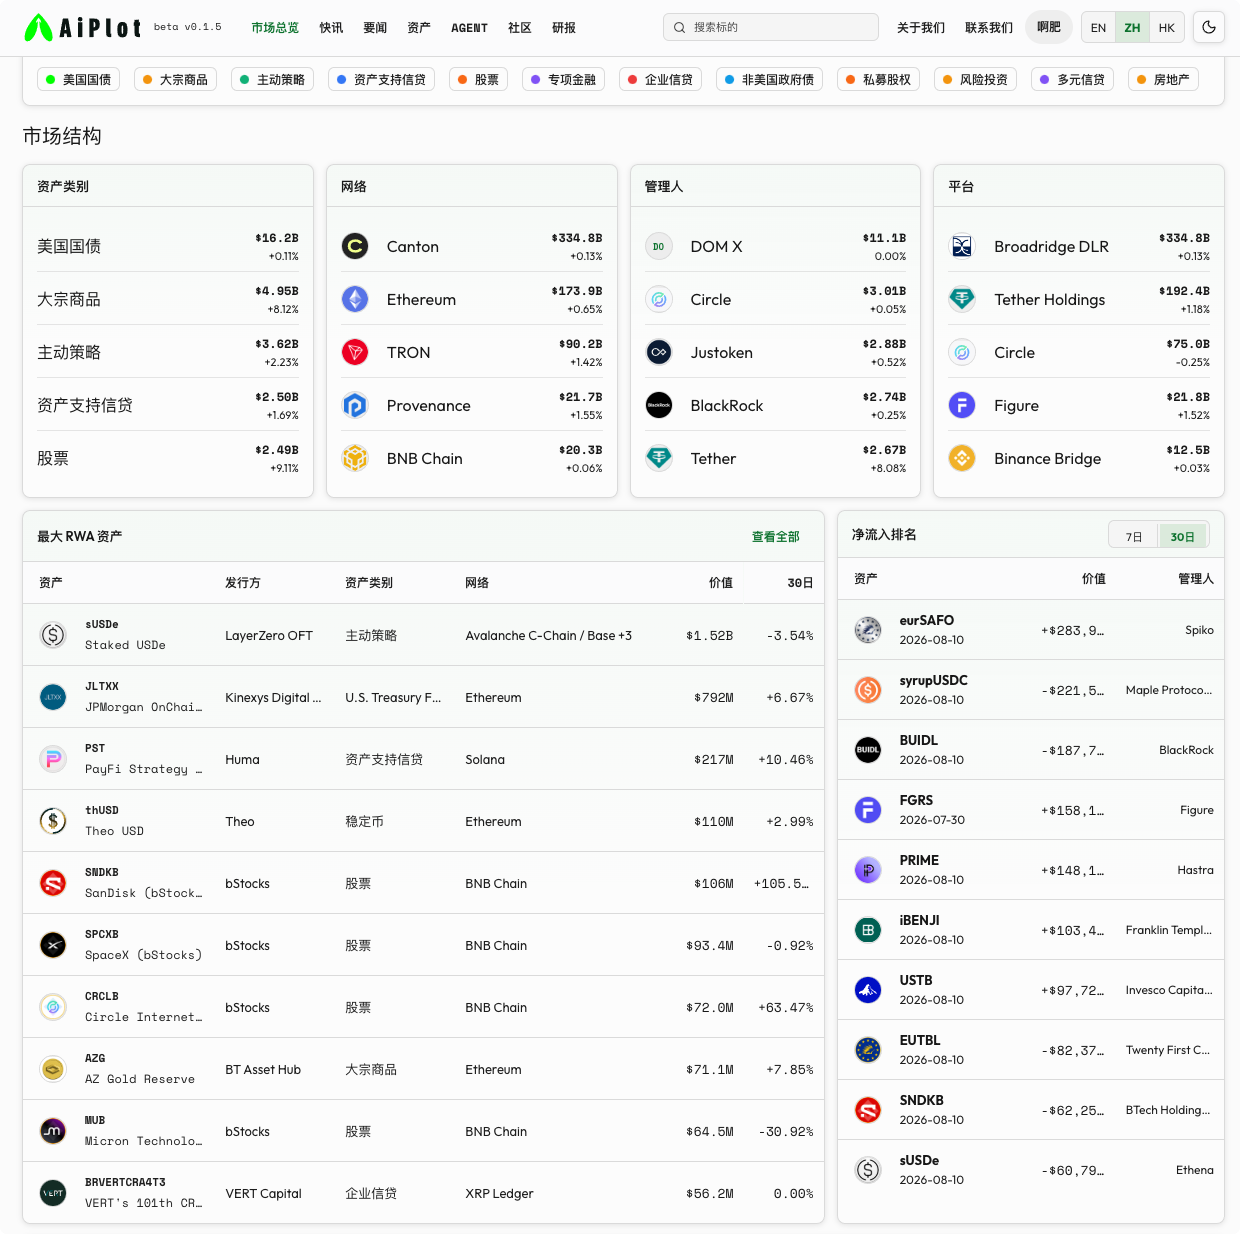
The AiPlot Micron page shows:
- Page price approximately $930.74;
- Tokenized market capitalization approximately $282 million;
- RWA sub-asset count 8;
- On-chain deployments 31;
- Report holders approximately 41,000;
- 30-day transfer volume approximately $210 million.
These indicators indicate that Micron is no longer just a traditional stock target, but has also become an object of on-chain stock distribution and RWA data tracking.
1. Micron's underlying asset narrative is clear enough
Compared to early projects that are difficult to value, Micron has a clearer industrial mapping:
- HBM is an essential storage component for AI accelerators;
- DRAM is the core memory for servers and computing devices;
- NAND and enterprise-level SSD meet data center storage demands;
- Long-term agreements, capital expenditures, and orders form traceable operational data;
- Financial reports, cash flow, and balance sheets can continuously validate the narrative.
Therefore, the value of Micron Tokenized Stock lies not just in "moving stock onto the chain," but in enabling on-chain users to obtain tradable exposure to the AI storage industry.
2. Tokenized market capitalization and company market capitalization are not the same concept
The page shows that Micron's tokenized market capitalization is approximately $282 million, while the report shows the company's total market capitalization is about $1,169.9 billion (the dates are different). Tokenized market capitalization only represents the issuance or circulation scale of on-chain products, does not represent the intrinsic market capitalization of Micron itself, and does not signify that on-chain Token holders possess shareholder rights entirely consistent with U.S. securities accounts.
It is necessary to distinguish:
- The economic exposure of the underlying stock;
- The legal rights of the Token;
- Whether it is 1:1 custodial or supported by other structures;
- Whether it can be redeemed for underlying stocks;
- Whether it holds voting rights, dividend rights, and corporate action rights;
- Whether investors are subject to transfer and regional restrictions.
Therefore, the analysis focus of Micron RWA cannot remain at "tokenized market capitalization growth" but needs to continue to track the Token's issuance structure, custodial arrangements, liquidity, holder concentration, and redemption mechanisms.
3. 41,000 holders and $210 million transfer volume mean what
If the approximately 41,000 holders mentioned on the page and the 30-day transfer volume of about $210 million are reliable, then Micron Tokenized Stock already has a certain level of on-chain distribution and trading activity.
However, these two numbers still cannot be directly equated to a long-term investor base:
- Transfer volume may include exchanges, market makers, and routing addresses;
- Holders may have very small balances;
- The same user may hold multiple addresses;
- Transaction volume may be driven by short-term arbitrage rather than long-term allocations;
- The economic rights of the Token may differ from traditional stocks.
The value of AiPlot lies in placing these metrics alongside conventional financial metrics on the same page: users can observe Micron's revenue, EPS, cash flow, valuation, RWA sub-assets, holders, and on-chain transfers at the same time, rather than just one price curve.
10. Five key indicators to track
1. HBM price and gross margin difference
Pay particular attention to whether the gross margin of the cloud memory sector where HBM resides can continue to converge from about 83% in FY26Q4 toward the overall gross margin. If HBM prices rise but gross margins do not improve, it may indicate that capacity ramp-up and packaging costs are still consuming profits.
2. Long-term agreement fulfillment rate and pricing mechanisms
Focus on whether the 26 SCAs translate into actual revenue, prepayments, and orders; pay attention to whether the agreements include minimum purchase commitments, price floors, and default arrangements.
3. FY27–FY28 capital expenditure and free cash flow
Capital expenditures exceeding $50 billion signify confidence but also constraints. It needs to be examined whether operating cash flow can cover expansion and shareholder returns, avoiding "high profits but cash consumed by expansion."
4. Sustainability of enterprise-level SSD growth
The nearly $10 billion revenue from data center SSDs in FY26Q4, with a year-over-year increase of over ten times, is a very strong signal, but it must be determined whether the growth stems from long-term demand or concentrated customer purchasing, or if it is merely a phase of inventory replenishment.
5. On-chain quality of the Tokenized Stock
When researching Micron at AiPlot, it is advisable to continuously track:
- Tokenized market capitalization;
- Number of holders and average balance;
- 30-day transfers compared to real transaction volume;
- Deviation of token price relative to U.S. stock price;
- Issuer, custodian, and redemption mechanisms;
- Whether the token has entered lending, collateral, and index products;
- How dividends and corporate actions map to on-chain holders.
Conclusion
Micron's current core logic can be summarized as follows:
AI enhances storage demand, HBM and enterprise-level SSD improve product structure, long-term agreements increase order visibility, capital expenditures dictate the pace of supply release, while valuation depends on how long the market believes high profitability can be sustained.
The $54.2 billion revenue, 87% Non-GAAP gross margin, and about $33 billion adjusted free cash flow of FY26Q4 prove that Micron has entered a very strong operational leverage phase. The approximately $61.5 billion revenue guidance for FY27Q1, approximately $38.15 EPS guidance, and around $66.989 billion expected revenue for FY27Q2 indicate that the market is still betting on the continuation of AI storage demand.
However, investors must not overlook: Micron remains a capital-intensive, cyclical storage company. The current high ROE, high ROA, and low forward PE may signify profitability reassessment or simply the appearance of being at a cyclical peak. The 26 long-term agreements and those extending to 2031 indeed enhance profit visibility, but they do not eliminate price, customer, supply, and capital expenditure risks.
From an RWA perspective, Micron represents a quite representative industrial asset case: it has a clear narrative surrounding AI infrastructure, verifiable financial data, and active on-chain stock distribution. However, the true value of tokenized stocks lies not in transforming MU into a new trading symbol but in whether real industrial assets like Micron can be incorporated into a broader on-chain investment portfolio, collateral system, and global asset allocation network.
Micron's fundamentals determine whether the Token holds underlying value; the financial infrastructure of RWA determines whether this underlying value can be utilized by more market participants.
For more data and analysis, please follow Aiplot:
https://aiplot.com/?utm_source=aicoin
📖 Community Communication:
- Telegram:
https://t.me/+IIYMcJigBAo4Mjg1
The content of this article represents the author's personal views and does not represent the position of this platform. The views, conclusions, and suggestions in this article are for investors' reference only and do not constitute any investment advice related to this platform. Markets are risky; investments should be made cautiously.
免责声明:本文章仅代表作者个人观点,不代表本平台的立场和观点。本文章仅供信息分享,不构成对任何人的任何投资建议。用户与作者之间的任何争议,与本平台无关。如网页中刊载的文章或图片涉及侵权,请提供相关的权利证明和身份证明发送邮件到[email protected],本平台相关工作人员将会进行核查。


