Li Ying Chat Coin: Latest Market Analysis of Bitcoin (BTC) and Ethereum (ETH) on October 15
Family! The current price of Bitcoin is 81900, suddenly put on pause after a roller coaster ride. It seems to be in a dilemma, the technical aspect leans bearish but there is a demand for an oversold rebound. The moving average system still shows a weak short-term trend. Although the MACD indicator's DIF and DEA values are low, they suggest that the downward momentum has weakened. Regarding the Bollinger Bands, the price touched the lower band at 82208 and then experienced a rebound, currently operating below the middle band at 83211, which constitutes the first strong resistance level. Overall, the major trend is downward, but there is a need for short-term correction indicators, typical of a bearish continuation or bottom oscillation pattern.
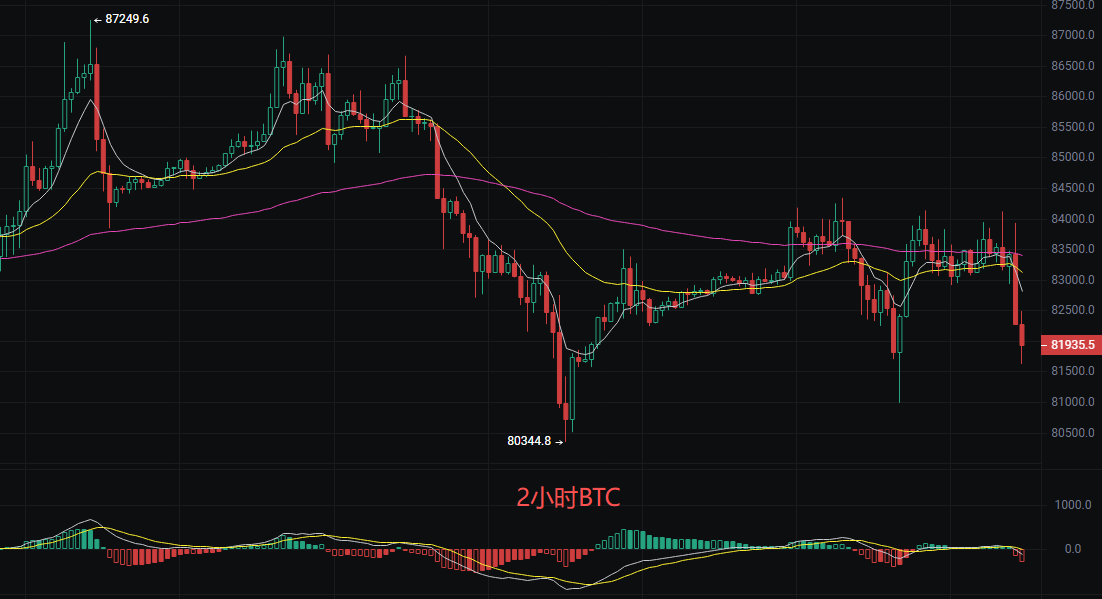
The current pattern is weakly oscillating, suggesting a focus on short positions, with long positions as a supplement.
Short Position Strategy
Entry: Monitor for a rebound to the 83000-83200 range. If a long upper shadow or engulfing bearish candlestick appears, lightly short the position. Stop loss: above 83500. Target: first target at 80500, if broken look at 80000.
Long Position Strategy
Aggressive short-long: Attempt to catch a rebound near 81000-81200. Stop loss at 80300, target 82500.
Conservative right side: Do not catch falling knives for now. Wait for the price to effectively stabilize above 83500 and break through the EMA120 suppression before following the trend to go long.
Ethereum
Family! The current price of Ethereum is 2435. From the drop at the end of September to the beginning of October, the bullish confidence was smashed quite a bit. Now the price is fluctuating between 2400-2550, resembling a lost drunk without direction. Looking at the candlesticks, recent rebounds have been unable to stabilize above 2500, indicating heavy selling pressure above; however, every time it drops near 2400, there is buying support, making the short-term situation a consolidation market. Don’t rush to chase rises or falls; first, observe who is leading the rhythm, whether the bears have not fully exerted their power, or if the bulls are quietly accumulating. This position tests patience the most; waiting for signals is much more reliable than blind guessing. The EMA moving average system shows a bearish arrangement but with a slowing slope; the MACD indicator's DIF and DEA show a weakening downward momentum but the reversal signal has not been confirmed; the Bollinger Bands show a technical rebound demand. Overall, the indicators resonate to show that the market is in a weak consolidation phase, waiting for the moving averages to turn or a MACD golden cross to confirm a trend change.
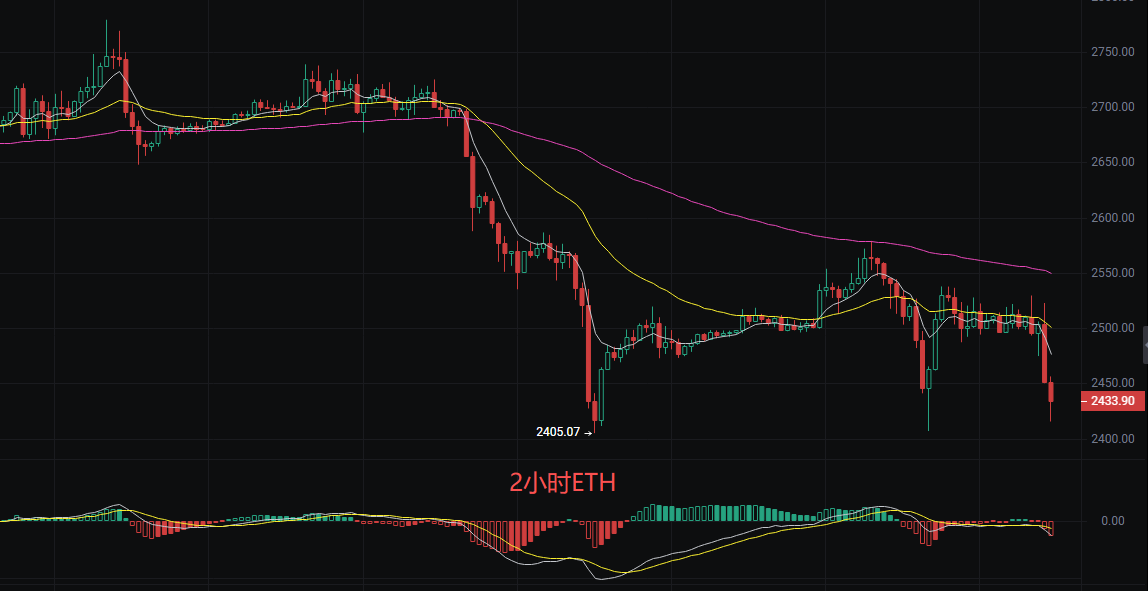
Adopt a high sell low buy strategy, controlling positions within 10%
Long Position: Enter at 2405-2415, stop loss below 2380, target 2480-2500.
Short Position: Enter at 2520-2530, stop loss above 2560, target 2400-2420.
Risk Control: If the price breaks above 2550 or falls below 2380, exit immediately and observe. Do not heavily gamble on the direction; wait for a volume breakout before operating in the trend.
The above content is exclusively original to Li Ying; please cite the source when reposting! There may be delays in article publishing and review, the market changes rapidly, and the above suggestions are for reference only, risk is self-borne.

Warm Reminder: The above content is solely created by the author of the public account. The advertisements at the end of the article and in the comment section are unrelated to the author, please identify them cautiously. Thank you for reading.
免责声明:本文章仅代表作者个人观点,不代表本平台的立场和观点。本文章仅供信息分享,不构成对任何人的任何投资建议。用户与作者之间的任何争议,与本平台无关。如网页中刊载的文章或图片涉及侵权,请提供相关的权利证明和身份证明发送邮件到support@aicoin.com,本平台相关工作人员将会进行核查。


