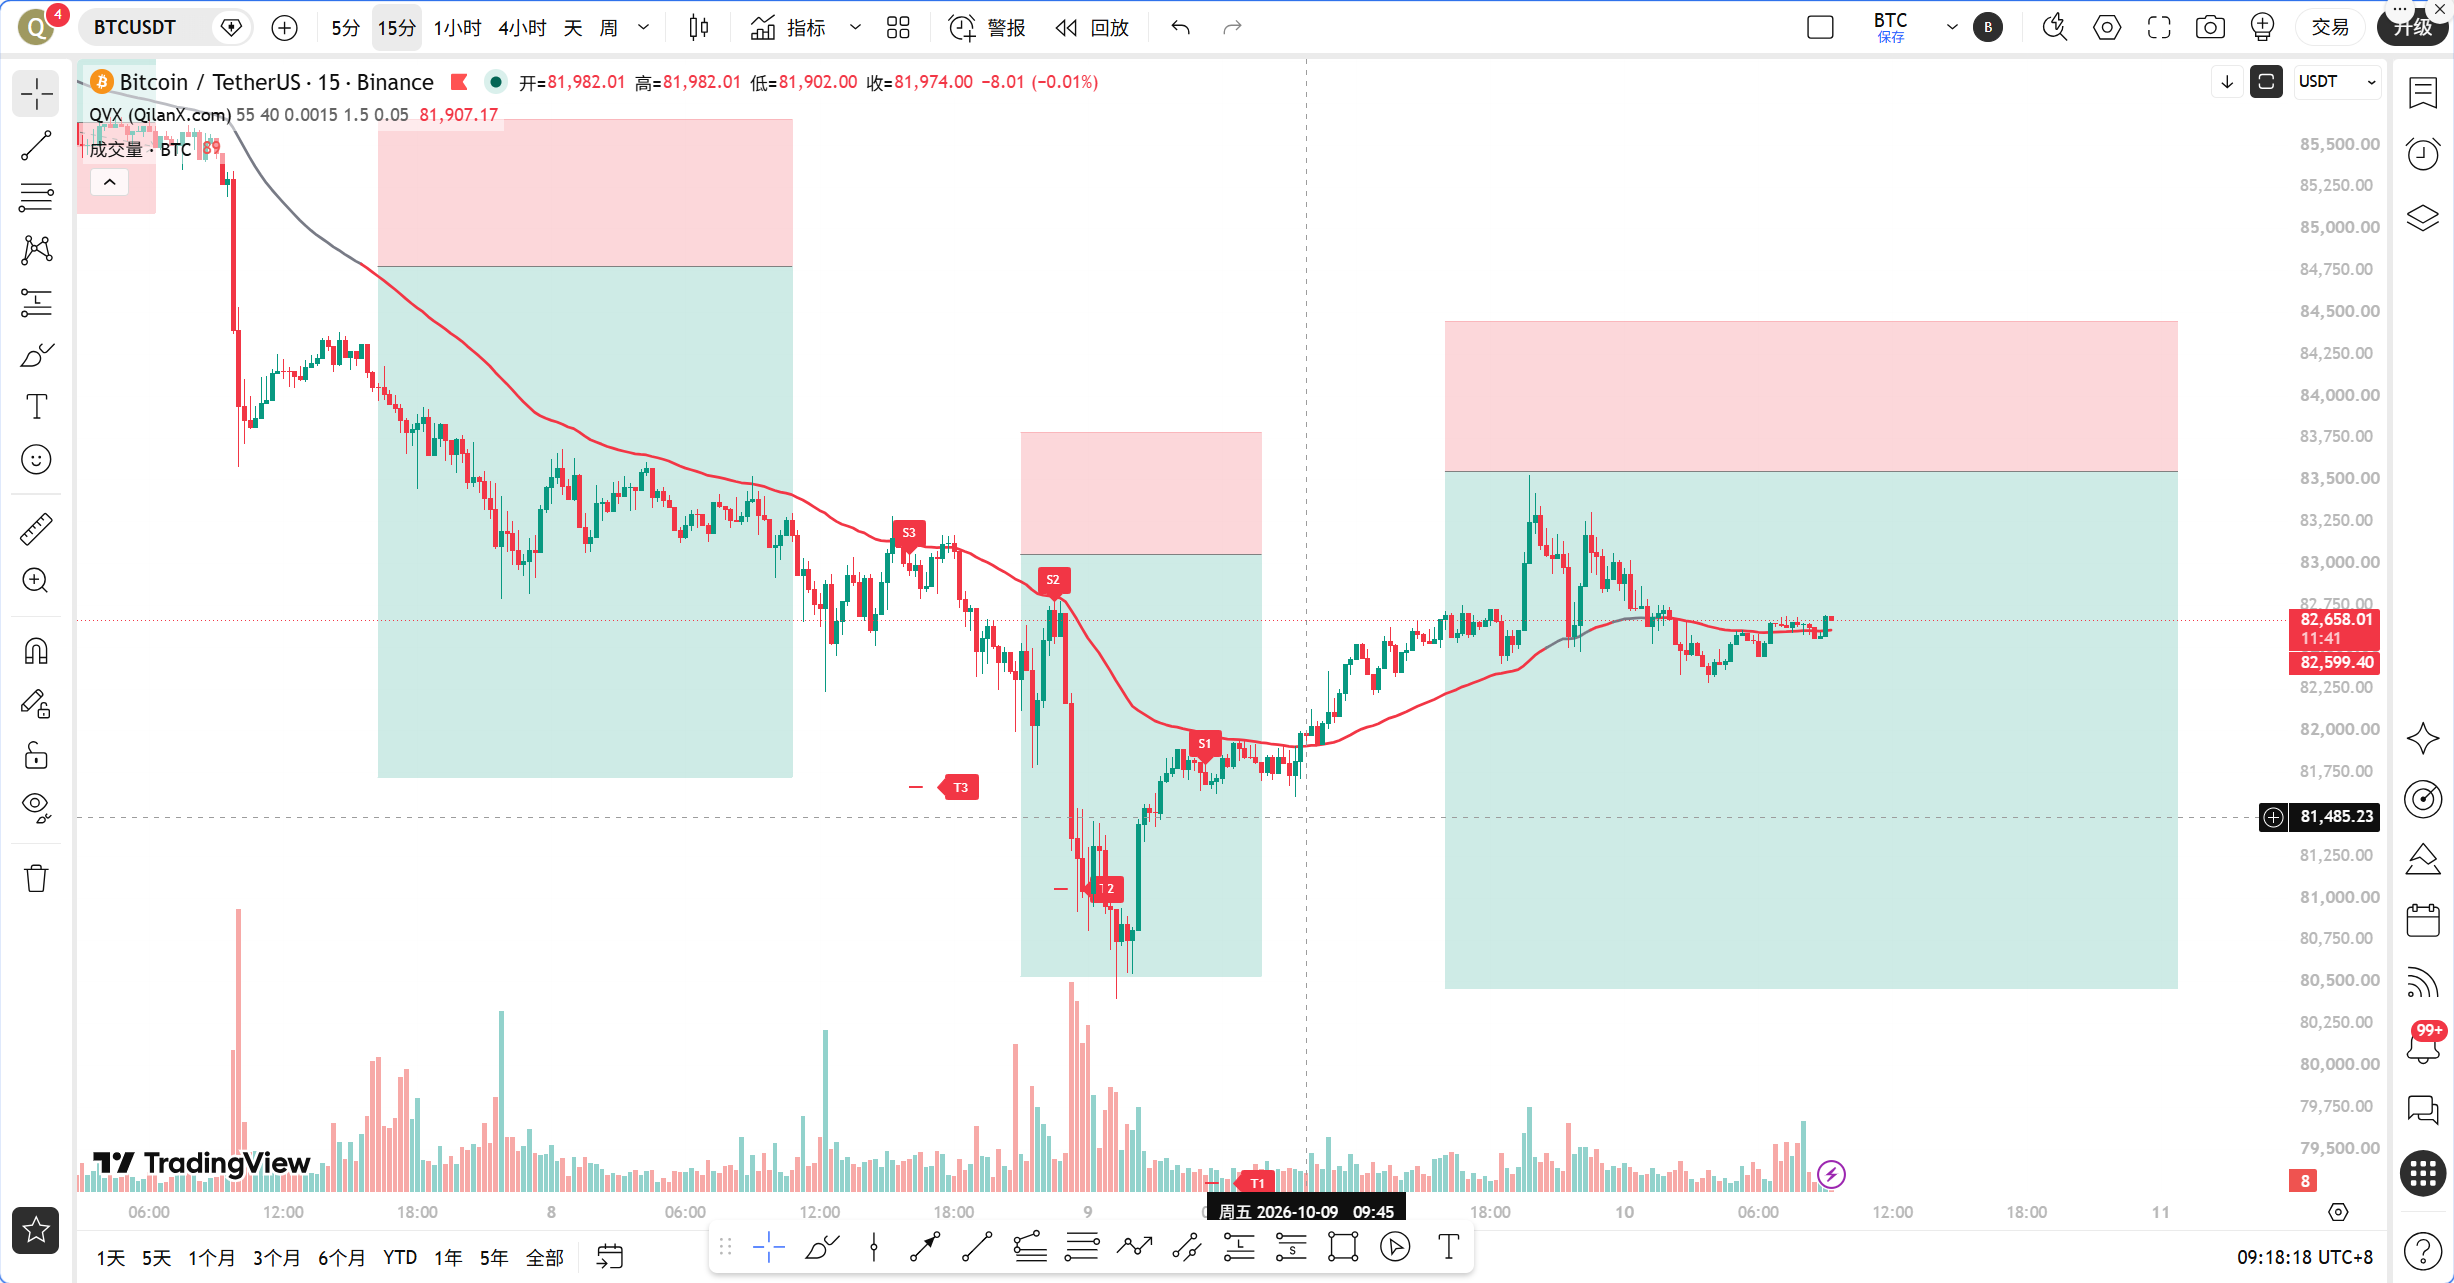
Dear teammates, this morning when I opened my eyes, two pieces of news directly smashed market sentiment to freezing point. The first piece, $528 million was liquidated across the entire network in 24 hours, with long positions accounting for $359 million, which means that in the past day, those who went long have been washed out, with selling pressure concentrated and released. The second piece is even harsher, Ledger users are suspected of suffering from a large-scale theft of assets, with losses exceeding $86 million, CZ personally warned about the risk of supply chain attacks, and the security trust crisis of hardware wallets directly triggered panic selling. With these two pieces of news combined, BTC once fell below 81,000, the market dropped across the board, with the AI sector leading with a 5.09% decline, and short-term bearish sentiment was obviously dominant. But the question arises, what's next after the drop? The current BTC quote is 82,613, grinding just below the 1-hour EMA55, is this a continuation of the downward trend or a turning point for short sellers exhausted? Sister Qinglan will guide you through the TPV system frame by frame.
Current Price and Time
It is now October 10th, 09:37, with the latest BTC quote at 82,613 USDT. The 24-hour change is +1.22%, pay attention to this number, although the news headlines are all shouting about a drop, in reality, the 24-hour figure is still slightly up, indicating that panic selling was absorbed at lower levels. BTC's market share is 59.14%, and funds are still concentrating on Bitcoin, with altcoins bleeding much more severely than BTC. The Fear and Greed Index is 64, in the greed zone, this position of greed is actually a bit delicate, as the price has already pulled back significantly from highs, the sentiment indicators lag behind prices and must be cautious.
Multi-Cycle Status Overview
First, let's look at the daily chart. MA5=83,174.88, MA10=84,232.29, MA30=82,295.56. The current price is 82,613, stuck between MA5 and MA30, with MA5 having crossed below MA10, indicating a bearish short-term moving average system. Daily MACD Column = -590.93, DIF = 961.43, DEA = 1,552.36, with DIF operating below DEA, bearish momentum still dominant. Daily RSI = 41.35, there is still space to oversell, indicating that the daily level has not reached a point where it can't fall further.
Next, let's look at the 4-hour chart. MA5=82,743.21, MA10=82,337.58, MA30=83,910.37. The price of 82,613 is below MA5 and above MA10, with moving averages entangled. 4-hour MACD Column = 63.58, which is positive, DIF = -583.44, DEA = -647.02, with DIF above DEA, this is a weak bullish structure after a bottom golden cross. 4-hour RSI = 43.54, neutral but slightly weak. The signal from the 4-hour level indicates: bearish momentum is weakening but has not yet turned into a clear bullish trend.
The 1-hour level is today's core. MA5=82,597.06, MA10=82,575.89, MA30=82,462.06, with three moving averages densely packed between 82,460 and 82,600, the price of 82,613 slightly standing above all short-term moving averages. But the key is EMA55 = 82,791.84, the current price of 82,613 is about 179 points below EMA55, a magnitude of 0.22%. 1-hour MACD Column = -14.42, DIF = 31.84, DEA = 46.26, with DIF below DEA, the histogram is negative, indicating short-term momentum is bearish. 1-hour RSI = 35.28, close to the oversold area, but has not yet broken below 30.
15-minute level. MA5 = 82,606.54, MA10 = 82,619.21, MA30 = 82,539.43, moving averages are bonded. 15-minute MACD Column = 9.58, DIF = 5.99, DEA = -3.59, with DIF above DEA, the histogram is positive, indicating there’s short-term rebound momentum. 15-minute RSI = 65.27, biased strong but not overbought. The 15-minute signal indicates: short-term is in recovery, with a willingness to test upwards.
TPV Signal Verification
According to Sister Qinglan's TPV system core rules, verify step by step.
First, EMA55 condition. The current price is 82,613, 1-hour EMA55 = 82,791.84, the price is below EMA55. In the past 8 one-hour K-lines, the closing prices greater than EMA55 were 0/8, and crossing counts were 0 times. What does this mean? It means that in the past 8 hours, the price has never stood above EMA55, always under pressure below it. According to the TPV rules, the first condition for going long “two consecutive 1-hour candles closing above EMA55” is completely unmet. The first condition for going short “two consecutive 1-hour candles closing below EMA55” is met.
Second, the model condition. The short position condition requires that pressure meets resistance, needing a long upper shadow, top distribution, or a descent after hitting an effective high. At the current 1-hour level, the price is oscillating around 82,600, with no obvious long upper shadow or top distribution appearing. But it is worth noting that the price has made multiple attempts to rise but was suppressed by EMA55, which in itself is a kind of pressure confirmation.
Third, momentum condition. The short position condition requires that rebounds are weak, needing MACD columns to shorten for two consecutive periods, RSI to retreat from above 70, or bearish engulfing patterns. Currently, the 1-hour MACD column = -14.42, DIF and DEA are both above the zero axis, but DIF has crossed below DEA, with the histogram negative, indicating that bearish momentum is being released. RSI = 35.28, has risen from a lower position, not a retreat from above 70. Therefore, momentum conditions do not completely meet short selling requirements.
Overall, the TPV system signals that: the price is in a bearish trend area, but the three elements of shorting do not completely resonate because momentum conditions are unmet. At the same time, the oscillation auxiliary data shows that the absolute distance of the price from EMA55 is 0.22%, less than 0.3%, belonging to near-line volatility, increasing the probability of oscillation. Currently, it does not meet the condition in the oscillation threshold of “closing prices greater than EMA55 for 3 to 5 times,” as the count is 0 times, so the system determines it may be in a unilateral trend, but near-line volatility also increases the oscillation probability. This is a contradictory signal, and Sister Qinglan’s judgment is: the direction is biased bearish, but it is not advisable to chase shorts, as the price is too close to the line, and it could be pulled back above EMA55 at any time by a single bullish candle.
On-chain funds
Fear and Greed Index is 64, indicating greed. This level of greed suggests that market sentiment has not fully turned to panic, and retail investors are still bottom-fishing. BTC market share is 59.14%, and funds are concentrating on BTC, which is relatively favorable for BTC, but bearish for altcoins. $528 million was liquidated in 24 hours, with $359 million of long positions thoroughly cleaned out, releasing some short-term selling pressure. However, the Ledger theft incident may still have follow-up implications, and the security issues with hardware wallets will raise users' concerns about self-custody assets; some users may choose to transfer assets to exchanges, increasing selling pressure on the exchanges. US consumer confidence in October dropped to 46.3, with the economic conditions index hitting an all-time low, macro-level risk assets are under pressure. US Treasury Secretary plans to seize $1 billion in crypto assets, concerns over tightening regulation are rising.
Key Defensive and Offensive Levels
First resistance level above: 1-hour EMA55 = 82,791.84. This is the dividing line for the TPV system between long and short, and the price must close above this level continuously for two consecutive 1-hour candles to confirm the return of the bullish trend. Second resistance level above: 4-hour MA5 = 82,743.21, which nearly coincides with EMA55, forming pressure resonance. Third resistance level above: Daily MA5 = 83,174.88, which is a stronger resistance.
First support level below: 1-hour MA30 = 82,462.06, which is the lower boundary of the short-term moving average concentration area. Second support level below: 4-hour MA10 = 82,337.58. Third support level below: Daily MA30 = 82,295.56, which is close to the 4-hour MA10, forming support resonance. If it breaks below 82,295, the next target is the integer level of 81,000.
Trading Ideas
Direction: Bias bearish, but do not chase shorts, wait for a rebound to meet resistance to short, or wait to go long after breaking above EMA55. The current price is near the line, with unclear direction, Sister Qinglan’s suggestion is to patiently wait for signal confirmation.
Short Ideas: If the price rebounds to the 82,700 to 82,800 range, near EMA55, and shows a long upper shadow or a 1-hour bearish engulfing pattern, along with the 1-hour MACD column continuing to be negative, a light short can be initiated. Entry condition: 1-hour candle closing confirms it cannot stay above EMA55, and RSI retreats from high positions. Entry point: 82,700 to 82,800 range. Stop loss: above 83,000, near Daily MA5. Target points: first target 82,460, second target 82,330, third target 82,295.
Long Ideas: If the price has two consecutive 1-hour candle closing above EMA55 = 82,791.84, and the 1-hour MACD column turns from negative to positive, with RSI rising above 40, a light long can be initiated. Entry condition: two consecutive 1-hour candles closing greater than EMA55, and a bottom distribution or a strong volume stall occurs. Entry point: 82,800 to 82,850 range. Stop loss: below 82,500. Target points: first target 83,170, second target 83,900.
Oscillation Ideas: If the price continues to fluctuate narrowly between 82,460 and 82,800, do not actively go long or short, only perform high sell and low buy within the range, but the position should be light, as near-line volatility may choose a direction at any time.
Risk Warning
The Ledger security incident may continue to cause selling; US tightening regulation and worsening consumer confidence may increase macro pressure, near-line volatility may change at any time, strict stop loss.
Follow Sister Qinglan's Crypto Classroom for more trading opportunities! Welcome to visit the official website www.qinglan.org
📊 Qinglan TPV Trading Strategy Backtesting Reference
🕒 Last Backtesting Time 10-10 07:00:01
Total analysis: 4300 Backtest: 4293 Accuracy: 77.9% (3346/4293)
免责声明:本文章仅代表作者个人观点,不代表本平台的立场和观点。本文章仅供信息分享,不构成对任何人的任何投资建议。用户与作者之间的任何争议,与本平台无关。如网页中刊载的文章或图片涉及侵权,请提供相关的权利证明和身份证明发送邮件到support@aicoin.com,本平台相关工作人员将会进行核查。