Crypto Circle Academician: The lower shadow on October 10 for Bitcoin (BTC) is not a bottom, and the upper shadow is not a top. The language of K-lines hides the most honest market truth.
The current price of Bitcoin is 83000, to say it is fluctuating would be an understatement. This morning it dropped to a low of 81500, many friends must have felt anxious, wondering if it was about to start a significant drop, but in the afternoon it steadily climbed back to around 82900. Within a single day, the price fluctuated nearly 2000 dollars, which is really hard to bear for those with weak hearts. In fact, this type of trend is quite typical, just a consolidation after a big rise. From over 57000 in June to now over 82000, that’s an increase of nearly 25000 dollars, and it’s perfectly normal to pause and digest the profit-taking in between.
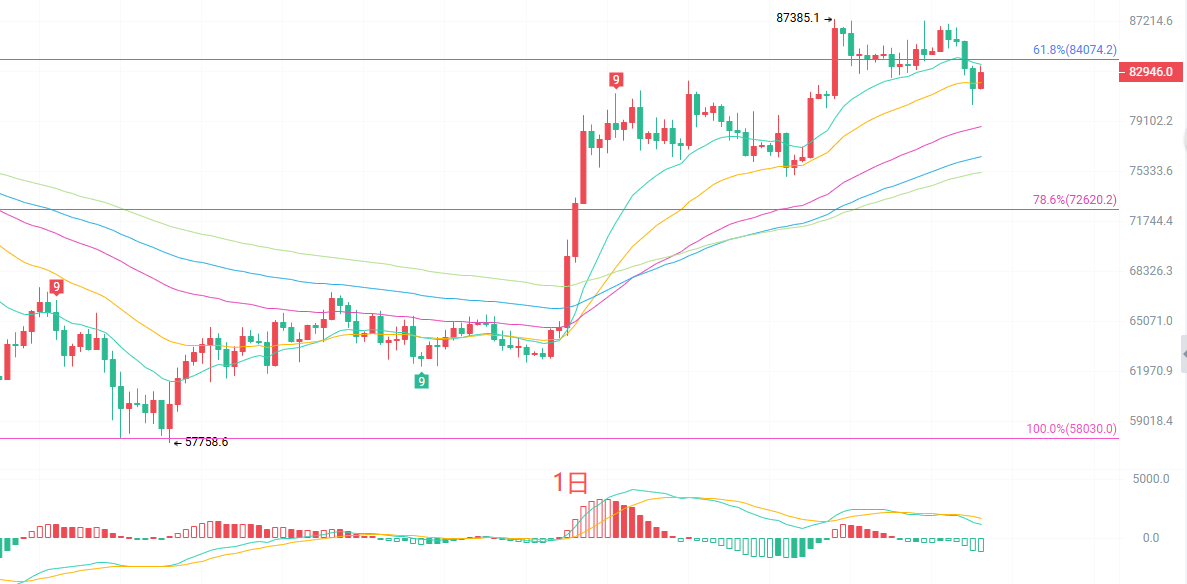
The daily K-line dropped to around 81571 and was pulled back, landing right above the lower Bollinger Band at 81498, indicating buying interest near the lower band. On the moving average system, the price is currently above EMA30 and EMA60 but is being pressed by EMA15, with short-term moving averages beginning to flatten out. The MACD shows that both DIF and DEA are above the zero axis, indicating that the overall trend is still bullish, and currently, it is a normal corrective digestion during the upward process. The Bollinger Bands are narrowing, with the upper and lower bands getting closer together, indicating that a direction is to be chosen soon.
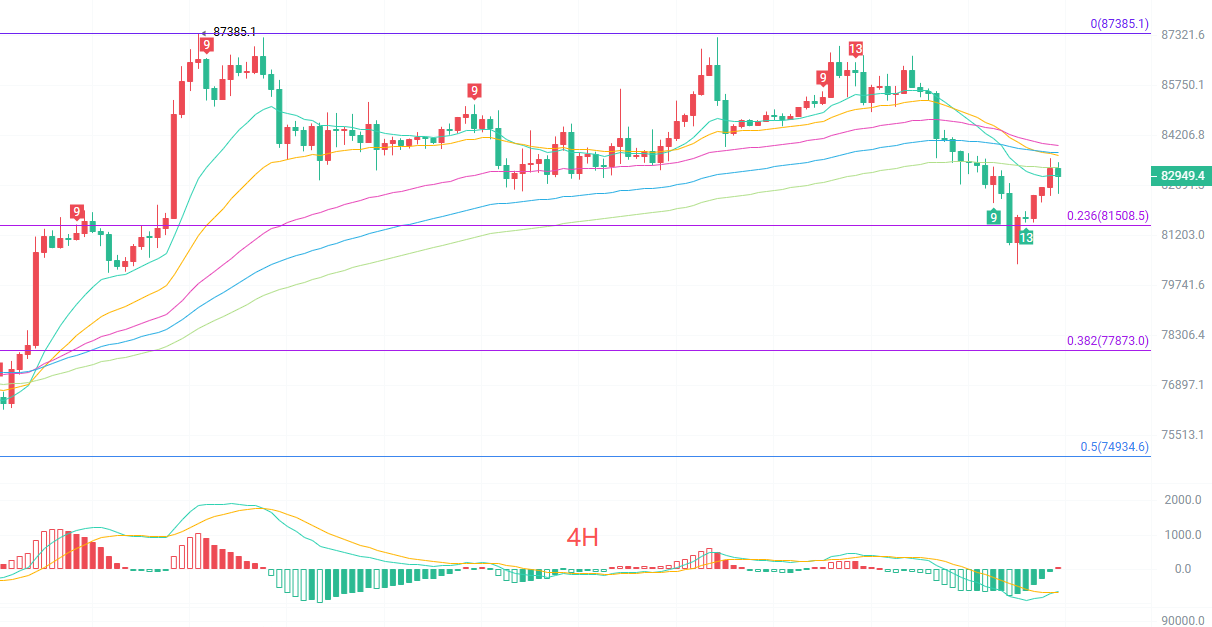
The four-hour K-line has retreated from the previous high of 87385, with a low of 74909 after rebounding all the way back, now fluctuating in the range of 82000 to 83500. In terms of moving averages, EMA15 is at 82983, and the short-term prices are being pressed by these moving averages; however, EMA120 has started to flatten out near 83241, indicating potential support. The MACD indicator shows a short-term rebound signal. The lower Bollinger Band at 80666 is a key support level, while the middle band at 83431 is the first resistance level.
Short-term reference
For upward movement, buy from 81700 to 81200, stop loss at 500 points, target at 83500 to 85000.
For downward movement, sell from 83500 to 84000, stop loss at 500 points, target at 82500 to 81500.
Specific operations should be based on real-time data from the market. For more detailed information, you can consult the author. There may be a delay in article publication, so it is advised for reference only and risks are to be borne by the reader.

Kind reminder: The above content is solely created by the author of this public account. Ads at the end of the article and in the comments section are unrelated to the author. Please identify carefully, thank you for reading.
免责声明:本文章仅代表作者个人观点,不代表本平台的立场和观点。本文章仅供信息分享,不构成对任何人的任何投资建议。用户与作者之间的任何争议,与本平台无关。如网页中刊载的文章或图片涉及侵权,请提供相关的权利证明和身份证明发送邮件到support@aicoin.com,本平台相关工作人员将会进行核查。