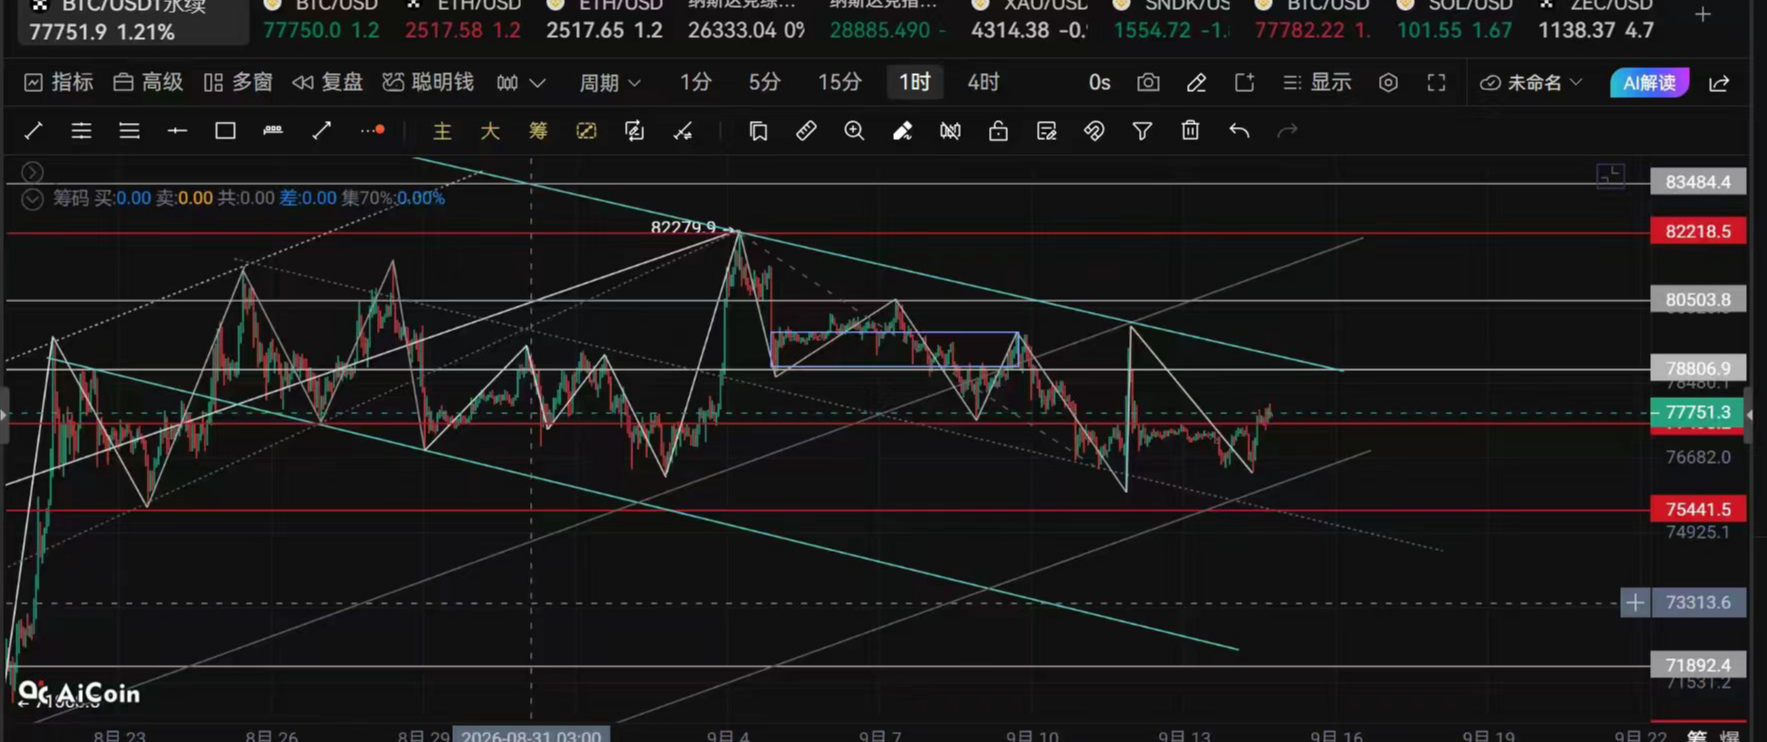
Crypto Circle Academician: On September 15, Bitcoin (BTC) experiences turbulent fluctuations and traps. How to see the future operating logic through moving averages and Bollinger Bands? Latest market analysis and operational suggestions.
The current price of Bitcoin is 78450. The fluctuations in the middle of the bullish market are the most exhausting. Before the direction is fully chosen, blindly chasing highs or loading positions for bottom-fishing can easily result in losses from back-and-forth movements. Understanding the current K-line structure and key support and resistance levels is crucial to avoiding false breakouts in the fluctuations. When the market moves in a certain direction, it is important to seize safer opportunities. Additionally, those of us positioned north of 65000 are still on board.
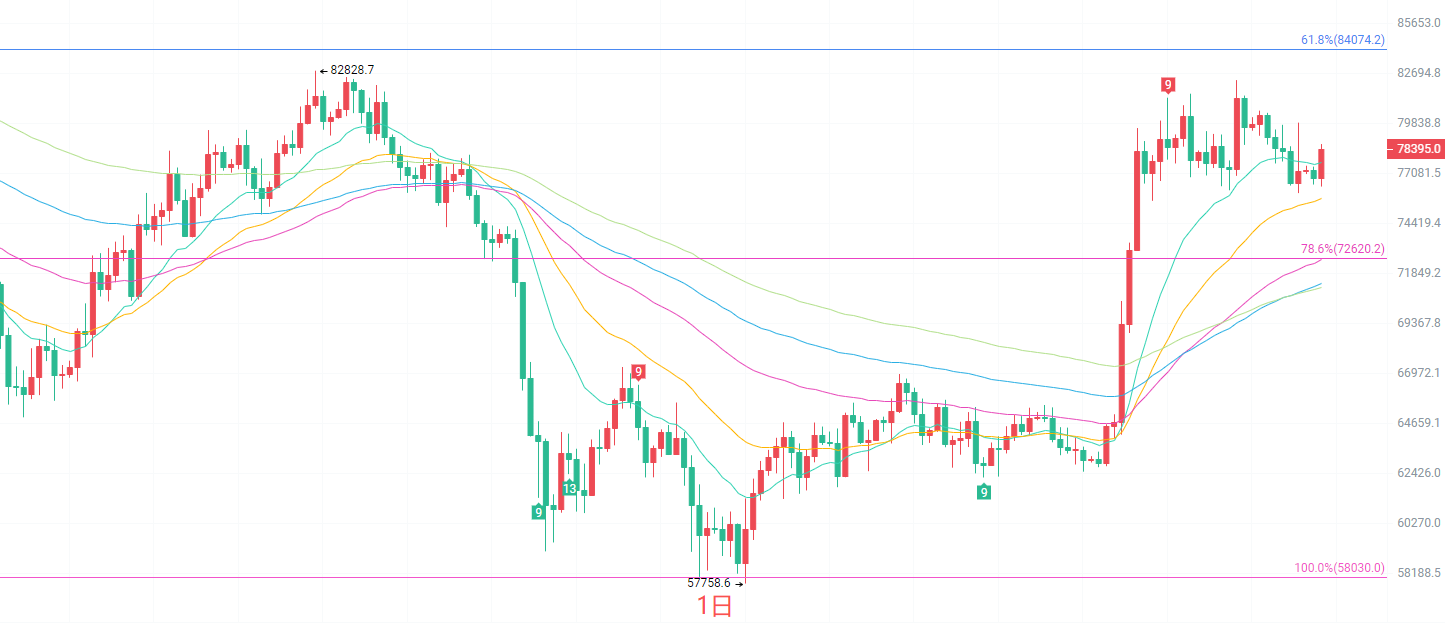
In the daily K-line, the mid-term bullish trend structure has not been broken. The previous high of 82828 forms a strong resistance level, while the EMA90 and EMA120 below form mid to long-term support. The MACD indicator shows a gradual contraction of red bars, and the DIF remains above the DEA. Bullish momentum is slightly weakening but has not formed a clear death cross; the Bollinger Bands are operating above the middle track, with the upper track at 80946 and the lower track at 75950. On the daily line, it is in a high position after rising, with a consolidation without reversal signals. The market is very likely to continue to fluctuate in a range in the short term. Only if it stands firm above 80900 is there a chance to test the previous high again; once it falls below 75950, the fluctuation pattern will be broken, initiating a deep correction.
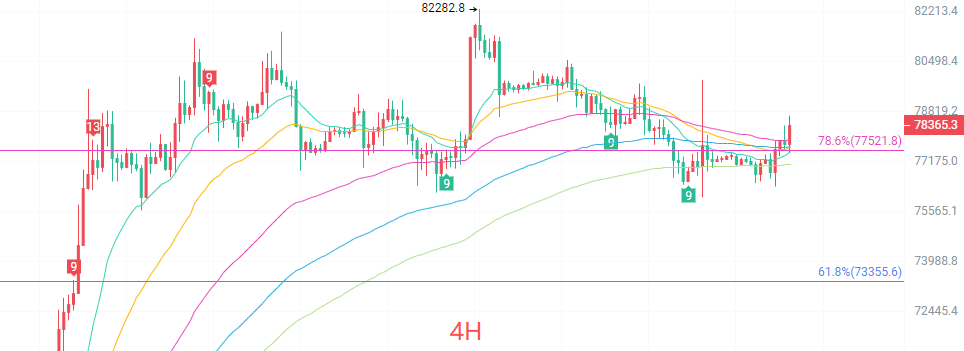
In the four-hour K-line, the short-term moving averages are flat, showing typical fluctuation characteristics. The key resistance above is 82282, which is also the phase high of this round of rising, having faced pressure multiple times before falling back. The support below rests around 77000, a position that has seen multiple rebounds recently. The 4-hour MACD red bars are shrinking, and the DIF is close to the DEA, indicating a weakening of short-term bullish momentum, with signs of dullness. The Bollinger Bands have started to converge, with the upper track at 78039 and the lower track at 76587, narrowing the fluctuation range, suggesting an approaching window for change. There is currently no unilateral trend at the 4-hour level, as the market fluctuates back and forth, with short-term volatility becoming increasingly tricky, leading to more false breakouts. Short-term operations should reduce positions and avoid chasing highs and cutting losses.
Short-term reference
Entering from 77500 to 77000 northwards, stop loss at 500 points, target looking at 80500 to 82000.
Entering from 80500 to 81500 southwards shows signs of stagnation, stop loss at 500 points, target looking at 80000 to 79000.
Specific operations are mainly based on real-time market data. For more details, you can consult the author. There may be a delay in article publication, so suggestions are for reference only, and risks are self-assumed.

Friendly reminder: The above content is solely created by the author of the public account. Advertisements at the end of the article and in the comments section are unrelated to the author. Please discern carefully, and thank you for reading.
免责声明:本文章仅代表作者个人观点,不代表本平台的立场和观点。本文章仅供信息分享,不构成对任何人的任何投资建议。用户与作者之间的任何争议,与本平台无关。如网页中刊载的文章或图片涉及侵权,请提供相关的权利证明和身份证明发送邮件到support@aicoin.com,本平台相关工作人员将会进行核查。