Crypto Circle Academician: Is the Bitcoin (BTC) bull market on 9.14 a continuation with shake-outs or a peak correction, does the market provide the answer? Latest market analysis and trading advice interpretation
The current price of Bitcoin is 77000. When trading, it's essential to distinguish between trends and fluctuations. Right now, it's clearly experiencing high-level shake-out fluctuations. Do not frequently open orders back and forth in the middle position; repetitive trading will only deplete your capital. In a fluctuating market, patiently waiting for points is much more important than rushing to enter. It's not necessary to participate in every segment of the market; only take opportunities with appropriate risk-reward ratios, hold your hands, and protect your stop-losses. Surviving longer in the market is far more important than making a quick profit in the short term.
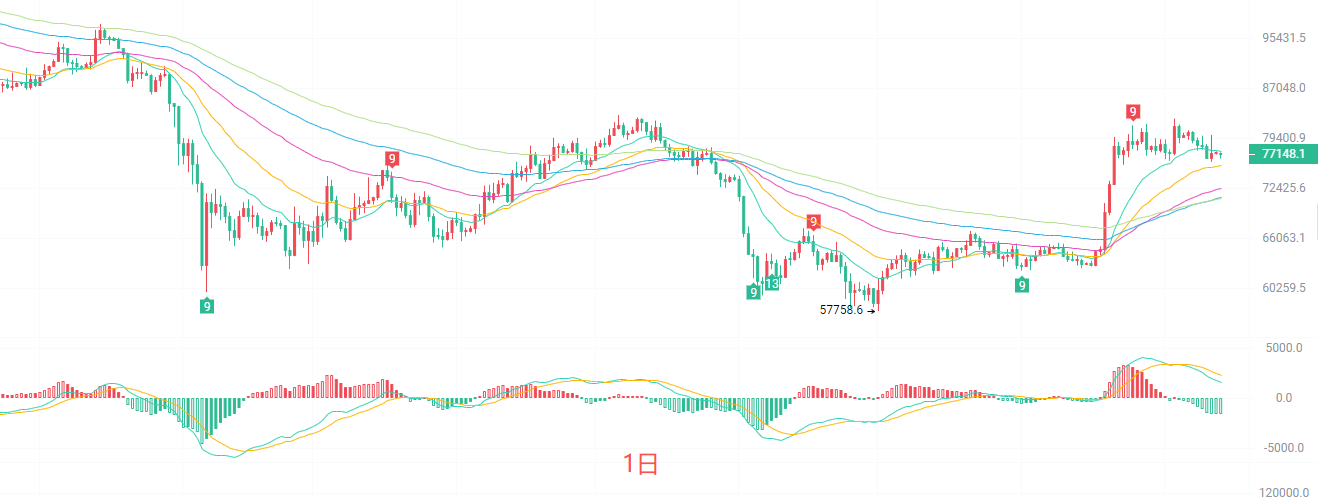
The daily candlestick chart shows a pullback near the short-term moving average with fluctuations. The MACD indicator DIF and DEA, red bars continue to shorten, bullish momentum is clearly weakening. The middle line of the Bollinger Bands is at 78464, the current price has already fallen below this middle line, with the upper line at 80934 and the lower line at 75994. The daily level has pulled back from a high position into a wide fluctuation; the bulls have lost strong upward momentum, with significant resistance above at around 80900, and the primary support below at around 75900. Do not blindly chase long positions until the daily close stabilizes above the Bollinger middle line.
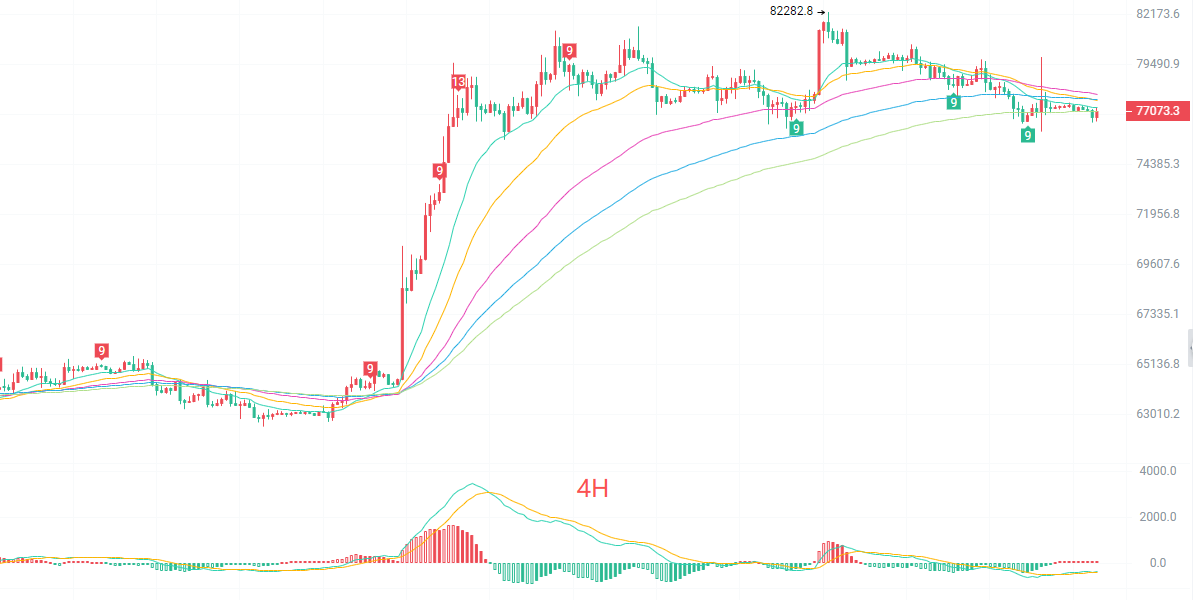
The four-hour candlestick chart has broken below the short-term moving averages, the moving averages have started to level off and turn. In the MACD, the DIF, DEA, and the MACD red bars are weak, indicating that the long and short forces are tending to balance out. The middle line of the Bollinger Bands is at 77715, the upper line at 87715, and the lower line at 76620. Recently, a double top resistance structure has formed, and in the short term, it is in a correction recovery phase. The first support below is at 76600; if that breaks, it will further test 75500, with pressure above concentrated at 77700. Only if it stabilizes at this position, there will be a chance for a short-term rebound.
Short-term reference
Buy from below 76500 to 76000 with a stop loss of 500 points, targeting 77700 to 79000.
Sell from above 79000 to 79500 with a stop loss of 500 points, targeting 78000 to 77000.
The specific operations should be based on real-time market data. For more information, you can consult the author. The article may have delays in publication; the advice is for reference only, and risks are borne by the reader.

Warm reminder: The above content is solely created by the author of this public account, and the advertisements in the comment section and at the end of the article are unrelated to the author. Please distinguish carefully, thank you for reading.
免责声明:本文章仅代表作者个人观点,不代表本平台的立场和观点。本文章仅供信息分享,不构成对任何人的任何投资建议。用户与作者之间的任何争议,与本平台无关。如网页中刊载的文章或图片涉及侵权,请提供相关的权利证明和身份证明发送邮件到support@aicoin.com,本平台相关工作人员将会进行核查。