Cryptocurrency Academy: 9.8 Bitcoin (BTC) in a volatile market is most likely to consume profits. How to clarify the contradictory signals of the big cycle and small cycle? Latest market analysis and operational advice interpretation.
The current price of Bitcoin is 79,500, at a high stage where subjective assumptions of tops and bottoms are most taboo. Do not be certain it will definitely rise or definitely fall; prioritize market signals. Many people make money in a big market, but end up losing in oscillating trades. If you don't understand, wait with no position; being out of the market is also part of trading. Returns and risks are always proportional; if you want high returns, you must bear the corresponding risks. Stick to your trading discipline, do not be swept away by market emotions, and survive to have the chance to wait for the next major market movement.
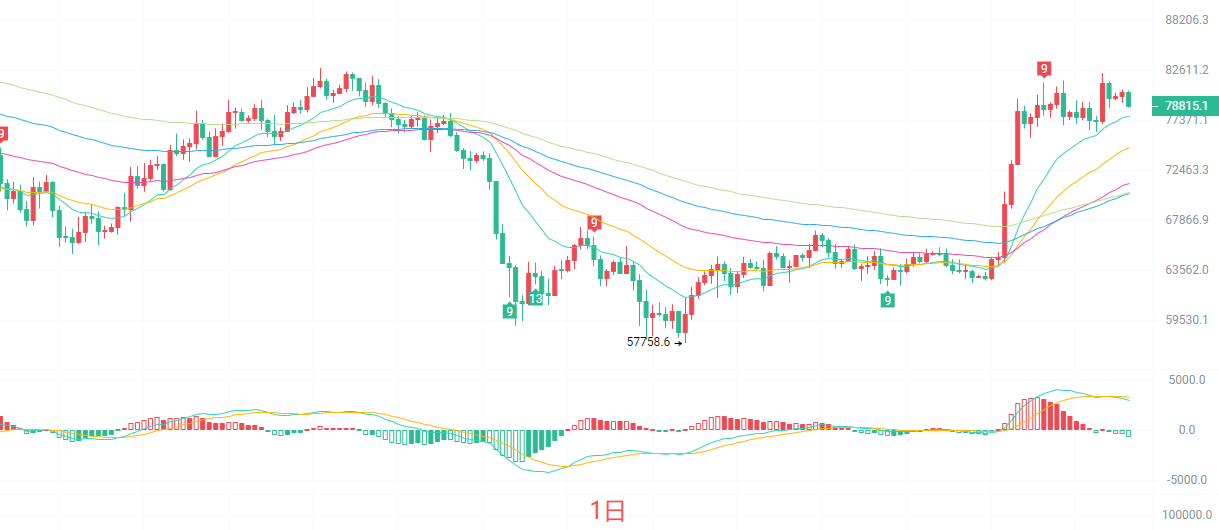
The daily K-line still maintains above multiple EMA moving averages, with medium and long-term moving averages pointing upwards, and the bullish structure of the big trend has not been broken. The MACD indicator's red bars continue to shorten, and the DIF has started to turn downward, indicating a significant weakening of bullish momentum, with signs of potential top divergence brewing. The upper band of the Bollinger Bands at 83,096 provides strong resistance, while the lower band at 72,799 offers important support. The daily line shows a K-line that rises and falls, indicating that the selling pressure above is gradually releasing. The short-term market has entered a high position oscillation phase and is no longer a one-sided brainless upward market.
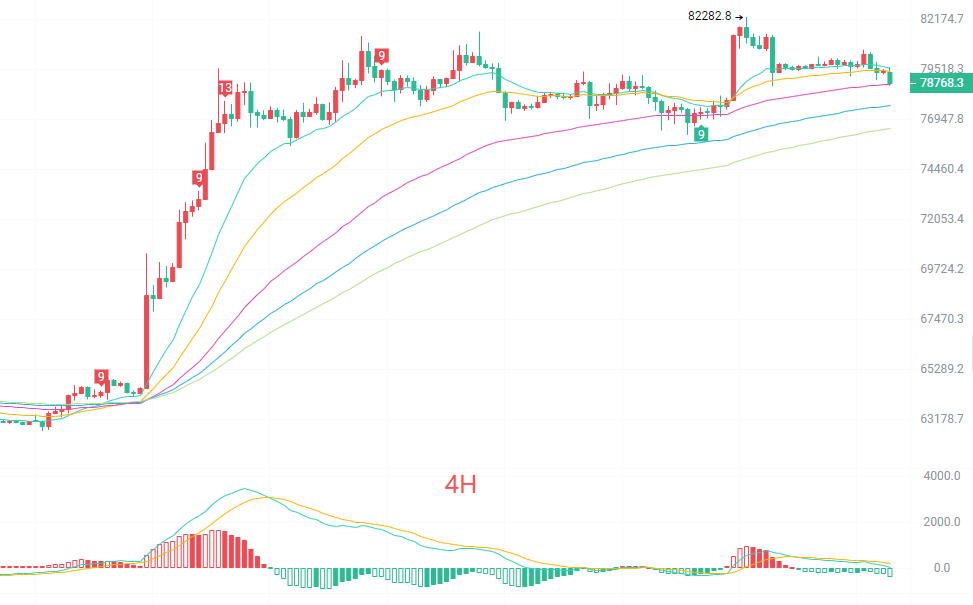
The four-hour K-line still stands above the EMA30 and EMA60 moving averages, maintaining a slightly bullish medium-term trend, but has short-term fallen below the EMA15 short-term moving average, indicating a weakening of the short-term bullish power. The 4-hour MACD continues to shrink, with red and green bars alternating, and both sides are beginning to contest, with the Bollinger Bands tightening and market volatility narrowing, as the market awaits a direction choice. The upper resistance is at 80,576, the upper band of the Bollinger Bands, and the lower support is at 78,901, the lower band of the Bollinger Bands. The 4-hour chart is currently in a pullback and repair phase after an increase; if the lower band support holds, the market is expected to rebound and test the previous high again; if it effectively breaks down below 78,901, it will further test the 77,600 area moving average support.
Short-term reference:
Move up from 79,000 to 78,500 with a stop loss of 500 points, aiming for 80,400 to 82,000.
Move down from 80,400 to 80,800 with a stop loss of 500 points, aiming for 79,000 to 78,300.
The specific operations depend on real-time market data, for more information details can be inquired from the author. The article publication has a delay; suggestions are for reference only, and risks are borne by the reader.

Warm reminder: The above content is only created by the author on the public account. The ads at the end of the article and in the comment area are unrelated to the author. Please be cautious and discern, thank you for reading.
免责声明:本文章仅代表作者个人观点,不代表本平台的立场和观点。本文章仅供信息分享,不构成对任何人的任何投资建议。用户与作者之间的任何争议,与本平台无关。如网页中刊载的文章或图片涉及侵权,请提供相关的权利证明和身份证明发送邮件到support@aicoin.com,本平台相关工作人员将会进行核查。