Crypto Community Scholar: Ethereum (ETH) reached a high of 2490, faced resistance, and has not seen a peak yet. How should the Ethereum market signals be interpreted? Latest market analysis reference.
The current price of Ethereum is 2490. The market will not always rise, nor will it always fall. After a large rise, fluctuations are normal. Do not let short-term candlesticks mislead your judgment. Now is the stage of waiting for direction. It's better to miss out than to make a wrong move. Do not fantasize about capitalizing on every wave of the market; preserve your capital and wait for higher certainty opportunities. In trading, in the end, it's about mindset and risk control. Maintain your mindset and execute according to your plan.
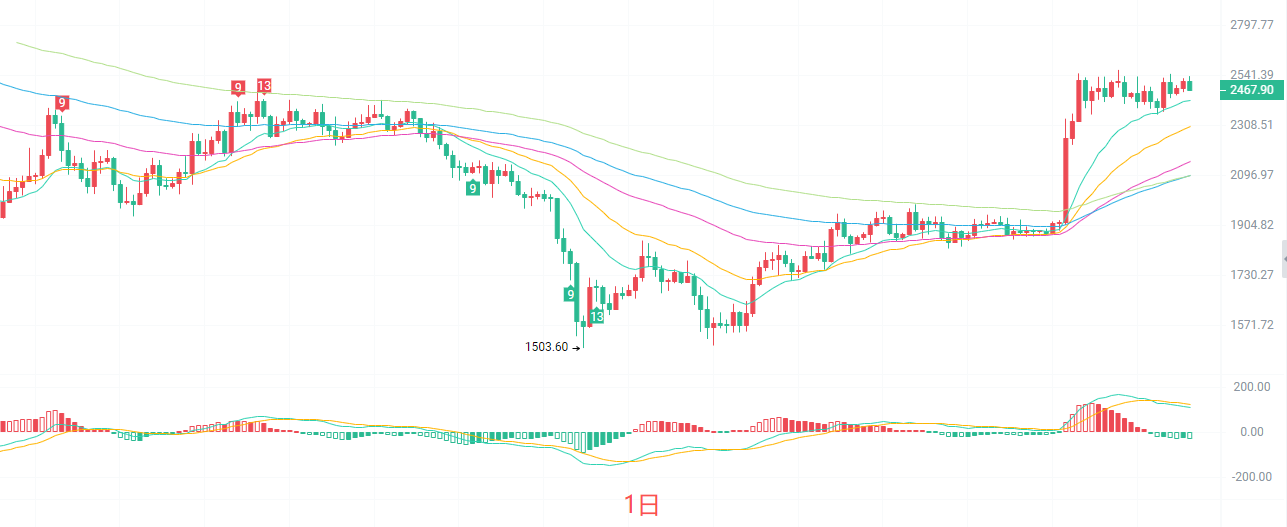
The daily candlestick chart has stabilized above the EMA15 in the short term, with EMA30 forming strong support. The overall moving average system maintains a bullish arrangement, and the medium to long-term trend is still biased towards bullish. The MACD indicator shows that the red bars are continuing to shrink, with DIF showing signs of turning down and approaching DEA, indicating that bullish momentum is gradually diminishing. The Bollinger Bands are opening upwards, and the price is fluctuating near the upper band. The upper band resistance is at 2575, and the lower band support is at 2318. No clear reversal signal has appeared on the daily chart, but the upward momentum is insufficient, likely entering a high-level consolidation pattern. The primary resistance above is in the range of 2560-2570.
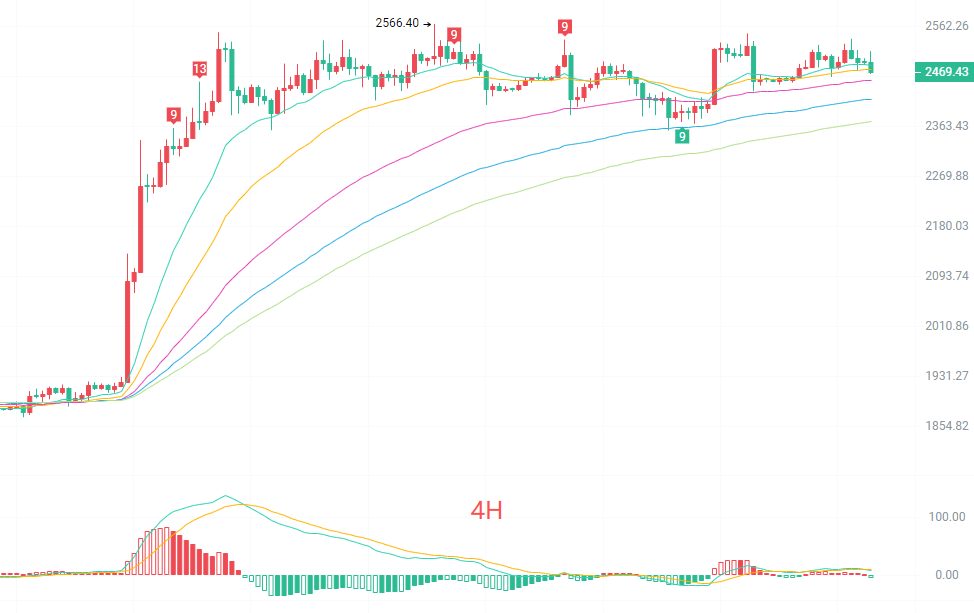
The four-hour candlestick chart shows back-and-forth movements around the EMA moving averages of 15 and 30 periods. The short-term moving averages intertwining indicates that the bullish and bearish forces are becoming balanced. The MACD has moved above the zero axis, the red bars have basically disappeared, and the DIF has crossed below the DEA, forming a death cross, which releases a short-term correction signal. The Bollinger Bands are starting to narrow, the range is tightening, with upper band resistance at 2523 and lower band support at 2436. If the support level of 2436 is broken, it will open up further correction space; if this support is maintained, it will continue to fluctuate within the range.
Short-term reference:
If 2440 to 2400 does not break to the downside, it can move upward, with a stop loss of 40 points and a target of 2510 to 2570.
If 2550 to 2566 faces resistance and moves down, with a stop loss of 40 points and a target of 2490 to 2440.
Specific operations should be based on real-time market data. For more information, please consult the author. The article publication may have delays, and it is suggested to refer to it for guidance at your own risk.

Kind reminder: The above content is solely created by the author. The advertisements at the end of the article and in the comments section are unrelated to the author. Please discern carefully, thank you for reading.
免责声明:本文章仅代表作者个人观点,不代表本平台的立场和观点。本文章仅供信息分享,不构成对任何人的任何投资建议。用户与作者之间的任何争议,与本平台无关。如网页中刊载的文章或图片涉及侵权,请提供相关的权利证明和身份证明发送邮件到support@aicoin.com,本平台相关工作人员将会进行核查。