The cryptocurrency market has given birth to a dedicated "opening bell."
Written by: Andjela Radmilac
Translated by: Luffy, Foresight News
At Coordinated Universal Time (UTC) 14:59:59, just like other electronic trading markets, Bitcoin perpetual contracts experience constant price fluctuations, with orders pouring in from global traders. But at the moment the clock strikes 15:00:00, the market's activity suddenly surges. The number of transactions skyrockets, funds rapidly change hands, and in the next 10 seconds, the price volatility significantly increases, all without any sudden news driving trading behavior.
At 15, 30, and 45 minutes past the hour, this trading pulse arrives as expected. Smaller similar market movements occur at 5-minute intervals and at the beginning of each minute, but the trading eruption at the top of the hour is the strongest. The cryptocurrency market is essentially a perpetual trading market, yet trading software divides it into countless micro trading periods.
Korean policy researcher Chan Kim and Peter Reinhard Hansen from the University of North Carolina documented this phenomenon in an academic paper. The research sample was drawn from the minute-by-minute transaction records of six major perpetual contracts on Binance from January 1, 2021, to October 31, 2024, covering Bitcoin, Ethereum, XRP, Solana, Dogecoin, and Cardano, spanning 1,400 complete non-stop trading days.
The research focused on perpetual contracts. Traders can bet on the rise and fall of assets through perpetual contracts, using leverage to amplify trading positions. Traditional futures contracts have a fixed expiration date, while perpetual contracts can be held indefinitely as long as the trader's margin is sufficient; long and short parties regularly swap funding to ensure that contract prices closely follow the spot index. When the price of a perpetual contract is higher than the spot index, bullish traders need to pay a funding fee to the bearish side; if the contract price is below the spot index, it is the bearish side that pays the fee to the bullish side.
Perpetual contracts account for a significant share of global cryptocurrency trading, giving this short-term pulse trading a wider market impact. The prices of perpetual contracts guide cross-exchange arbitrage, hedging, and market-making activities, so fluctuations in the futures market transmit to Bitcoin and other assets in the spot market.
The cryptocurrency market has given birth to a dedicated "opening bell"
If one charts an hour in a circular diagram, the 15-minute trading pulses become clearly visible. The graphs created by the researchers show peak volumes at four time points: 0 minutes, 15 minutes, 30 minutes, and 45 minutes, with trading volume and price fluctuations exhibiting a star-shaped distribution, where the vast majority of surges are concentrated within 10 seconds after the period opens.
Combining data from six contracts, the number of transactions in this 10-second window is 26% higher than during ordinary periods, dollar-denominated transaction volume increases by 32%, and absolute price fluctuation expands by 26%. The absolute return indicator measures the bidirectional price fluctuation space, with both increases and decreases becoming more pronounced in the 15-minute starting window.
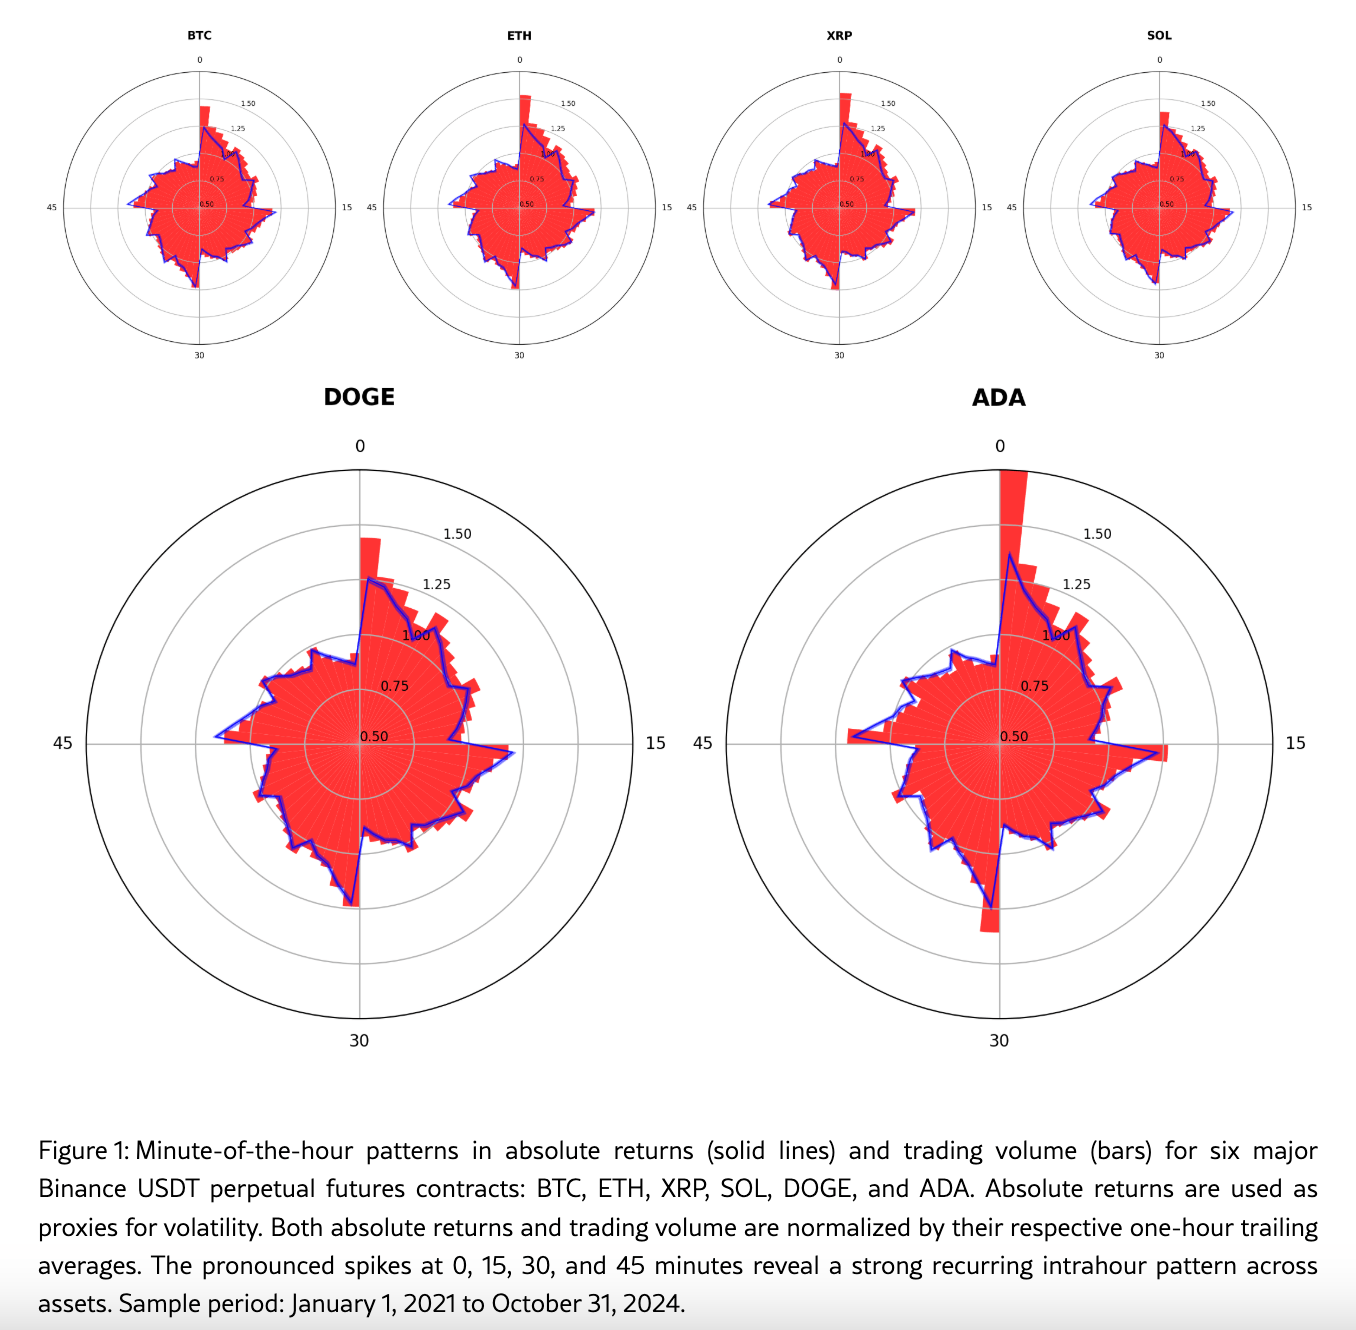
The polar coordinate chart displays the absolute returns and transaction volume patterns of BTC, ETH, XRP, SOL, DOGE, and ADA perpetual contracts at different minute nodes within an hour
No matter the disparity in market capitalization between the assets, this pattern holds steady. During the sample period, Bitcoin had an average daily transaction count of 1.54 million, with a contract trading volume of $14.58 billion; while Cardano had an average daily transaction count of about 290,000, with a trading volume of only $544 million, yet both displayed a highly consistent trading rhythm.
This consistency across different cryptocurrencies is the most important conclusion of this study: this trading pattern is born from market-wide trading mechanisms, not uniquely characteristic of a single token.
The vast majority of trading software formats uninterrupted price data streams into standardized candlestick charts, such as 1 minute, 5 minutes, or 15 minutes. A 15-minute candlestick summarizes the opening price, closing price, highest price, and lowest price for that period. This visualization tool facilitates manual observation of the market while providing standardized data units for quantitative programs.
At the end of each candlestick, various technical indicators are recalibrated, automated trading strategies refresh trading instructions based on the latest completed candlestick. Algorithms for splitting large orders execute remaining limit orders at time nodes; market makers adjust quoted prices based on predicted fund flows; faster quantitative systems position themselves in advance.
Once enough programs share the same set of time scales, the originally data-representation-only time periods eventually become part of the market itself. At the end of an otherwise unremarkable 15-minute period, trading suddenly surges as if the traditional exchange had just opened for business. The reason that the real opening bell in traditional markets triggers an explosion of orders is that traders wait for a long time after a market closure to submit concentrated orders. The cryptocurrency market, relying on a uniform candlestick period and software default settings, replicates this trading frenzy and cycles through it every 15 minutes without stopping.
Traces left by machine trading
Binance's transaction records can show the trading assets, transaction quantities, and prices, but cannot distinguish whether a given order comes from a human trader, a market-making institution, a liquidation engine, or other automated programs. Kim and Hansen search for indirect clues through order sizes.
Human traders tend to prefer neat integer price points and quantities, such as 0.1 Bitcoin or about $10,000 in order amounts, and do not deliberately calculate a series of lengthy and fragmented transaction values. In contrast, quantitative algorithms typically calculate order quantities based on volatility, available funds, current position exposure, or large order splitting targets, resulting in final order amounts that often appear erratic from a human perspective.
The researchers recorded the frequency of orders ending in zeros: during the initial seconds of the pulse trading, the proportion of organized amounts noticeably drops. The statistical sample specifically filtered out orders of sufficient size to avoid data bias from the exchanges' minimum order units, preventing the misjudgment of small orders as non-human transactions.
The more critical the trading node, the more pronounced the decline in the proportion of integer orders. At ordinary minute beginnings, the proportion of organized orders slightly decreases; at 5-minute nodes, the drop enlarges; at 15-minute nodes, it further declines, and the differential characteristics peak at whole hour marks.
Taking Bitcoin orders that satisfy double-zero statistical criteria as an example: during common minute openings, the proportion of integer orders deviates from normal by 0.04 standard deviations; at whole-hour marks, this deviation reaches 0.20, showing that the influence of the hour effect is five times stronger than during ordinary periods.
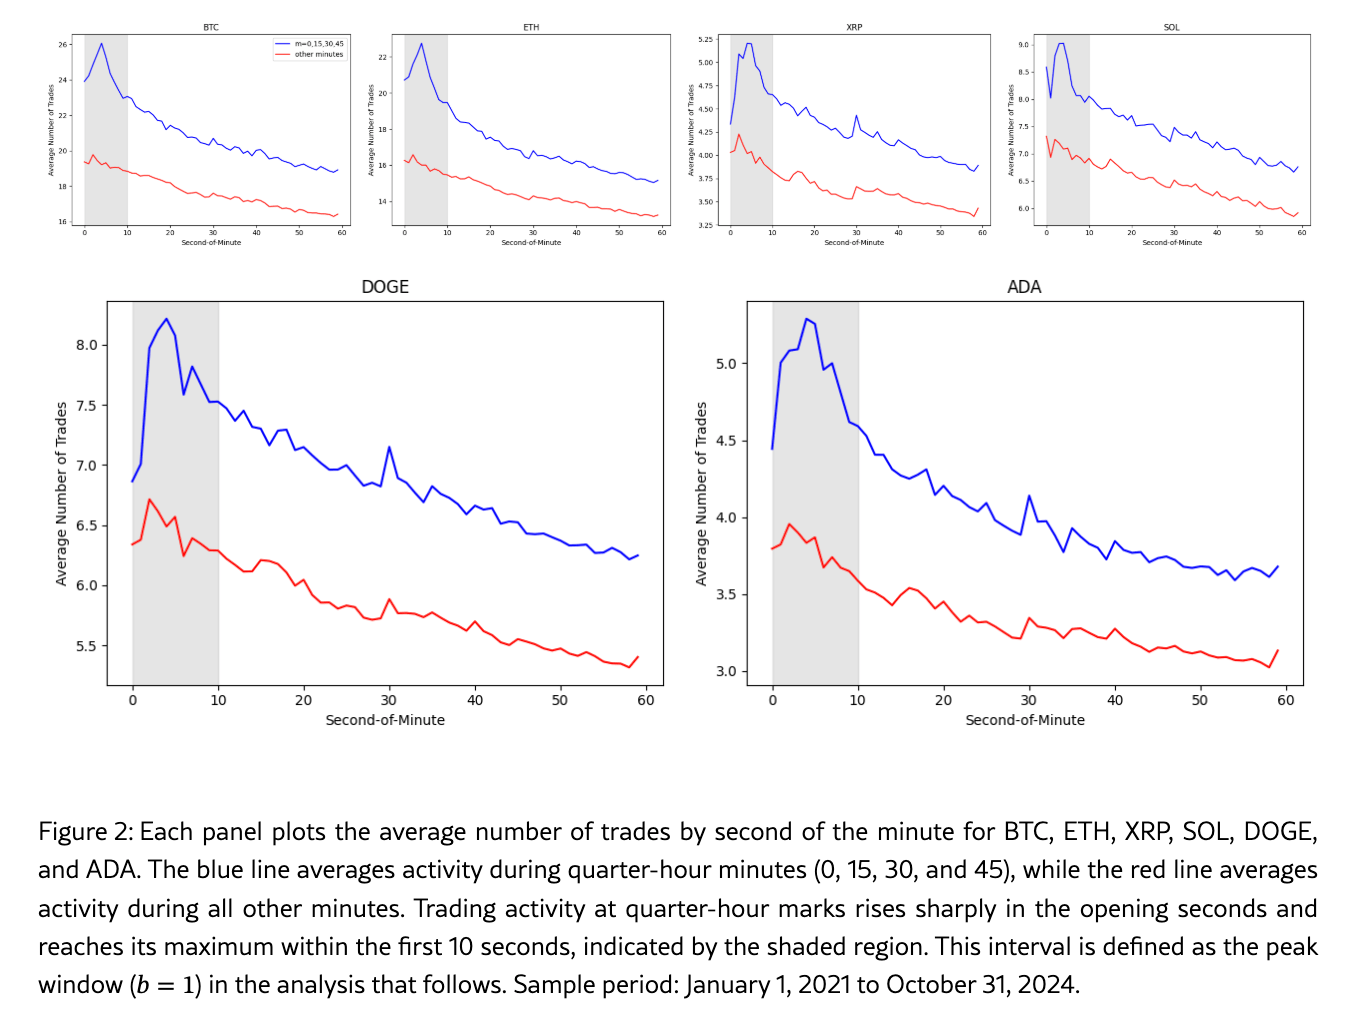
The chart shows the trading activity of six cryptocurrency assets surging in the 10 seconds before each minute and with higher average trading volume at 15-minute nodes
Standard deviation indicates the extent to which observed values deviate from the normal range; this value does not directly equate to the share of machine orders in trading. It merely confirms that during moments of heightened trading activity, the market no longer routinely submits integer orders, and this behavioral characteristic corroborates an increase in automated trading participation.
Relying solely on order size still does not determine the source of each order. Large institutional order splitting, forced liquidation orders, and funding rate arbitrage orders can also yield irregular transaction amounts. Therefore, the paper uses order characteristics as indirect evidence of quantitative trading activity.
The authors conducted multiple control experiments to rule out the possibility of other periodic events causing pulse trading. Within the sample period, Binance settled funding rates at UTC 0:00, 8:00, and 16:00; even after removing these three time windows, the 15-minute pulse effect remained significant; even removing all whole-hour observation data, the market characteristics at 15, 30, and 45 minutes still existed. An independent analysis of Bybit exchange data yielded highly similar market patterns.
Contrast experiments demonstrate that this is a widely occurring electronic collaborative trading behavior. Traders could have defined any trading period, but exchange data, chart parameters, and common technical indicators guide numerous trading programs to lock in the same time boundaries. The most focused on whole hour and quarter past time points also see peak capital concentration.
Predictable price signals are no match for trading fees
After confirming that pulse trading has cyclical characteristics, the research team further validates whether the market data before the 15-minute opening can predict the price direction within 10 seconds of the opening.
A rolling prediction model reads the previous 15-minute return data, combines it with classic volume price indicators, and uses available market information at the time to conduct out-of-sample predictions.
The backtesting results for the six contracts show that the model’s accuracy in determining up or down direction reaches 56.6%; the mean goodness-of-fit for out-of-sample tests is 3.4%, indicating that the model can only explain a small portion of the return volatility in those 10 seconds; the area under the curve scores 0.60 (0.5 represents random guessing; 1.0 indicates perfect prediction).
In a high-noise market at the 10-second level, these limited values prove that this trading pattern indeed possesses repeatable signal value. However, this pattern cannot be transformed into a simple and stable profit strategy, as the price fluctuations resulting from predictions are minimal. Strictly following model signals to execute trades at every 15-minute node means that the average gross profit per trade, before deducting fees, is only 0.51 basis points, equivalent to 0.0051%; a $10,000 principal trading once yields an approximate gross profit of $0.51.
During the sample statistical period, Binance’s maker fee stands at 5 basis points, while taker fees are 2 basis points. A $10,000 take order incurs an opening cost of around $5, and closing requires paying fees again; however, the average gross profit from the model is less than one-tenth of the single opening fee.
The profit potential is extremely slim, and the core value of this dataset reveals the significant gap between statistical predictability and the actual profits that ordinary traders can capture. Market patterns may be able to be repeatedly verified with rigorous data, but short-term volatility returns are insufficient to cover basic trading costs. This is also why highly automated markets display identifiable market patterns yet cannot easily yield arbitrage profits.
Market makers and large institutions can still leverage the conclusions of this study to optimize their trading strategies. Institutions providing liquidity with two-sided limit orders can widen the bid-ask spread during the 10-second pulse explosion; when predicting one-sided inflows, they can lower order sizes. Institutions executing large order splits can place orders avoiding the crowded time nodes to reduce slippage losses from their own orders.
The market movement in the first 10 seconds of the 15-minute window also contains signals for longer-term market trends. If the buy volume from proactive buy orders exceeds that of sell orders within the quarter-hour node, this order imbalance often continues to push prices higher in the next 4 to 12 hours; conversely, if sell orders are dominant, the medium to long-term market faces pressure.
Order imbalance represents the difference in the volume of proactive buys and sells relative to total transaction volume, measuring which side's capital momentum is stronger.
On a 4-hour dimension, the medium to long-term market largely inherits the funding flow signal from earlier 15-minute nodes; extending to 8-hour and 12-hour dimensions enhances the explanatory power of traditional volume price indicators. This market logic confirms that quantitative programs utilize 15 minutes as a unified signal node to digest the accumulated trading information of the entire market.
This long-term conclusion must be handled cautiously. The 4-hour, 8-hour, and 12-hour return observation windows overlap, meaning that a single large wave of market movement can appear across multiple sets of statistical data. Although the authors employed a block-bootstrap sampling method suitable for non-independent data to address bias, aggregated transaction records still cannot determine whether an order contains private information, responds to the same public news, or if price fluctuations merely result from market makers handling large one-sided orders.
Setting aside complex statistical models, the underlying logic is straightforward. The cryptocurrency market has eliminated the closing bell to achieve around-the-clock continuous trading; yet APIs, candlestick periods, and automated trading strategies create numerous mini opening moments throughout the day.
Every 15 minutes, thousands of independently operating trading programs reach the same time node. In just a few seconds, this market, designed to be uninterrupted, resembles a mass of traders rushing through the same door.
免责声明:本文章仅代表作者个人观点,不代表本平台的立场和观点。本文章仅供信息分享,不构成对任何人的任何投资建议。用户与作者之间的任何争议,与本平台无关。如网页中刊载的文章或图片涉及侵权,请提供相关的权利证明和身份证明发送邮件到support@aicoin.com,本平台相关工作人员将会进行核查。


