Good morning, teammates. This morning there are two pieces of news to pay special attention to. One is about 4000 BTC being transferred on the Liquid Network sidechain, with a message on the chain claiming to be a white hat. This is a typical abnormal event, and while it may not directly crash the market in the short term, market sentiment will become sensitive as a result. The other is that an old giant whale from eight years ago has awakened, with 1260 BTC worth over 100 million. Once this level of chips moves, the potential selling pressure is like a sword hanging over our heads. The combination of these two events indicates that the chips at this position are starting to loosen, and short-term operations must prioritize risk control.
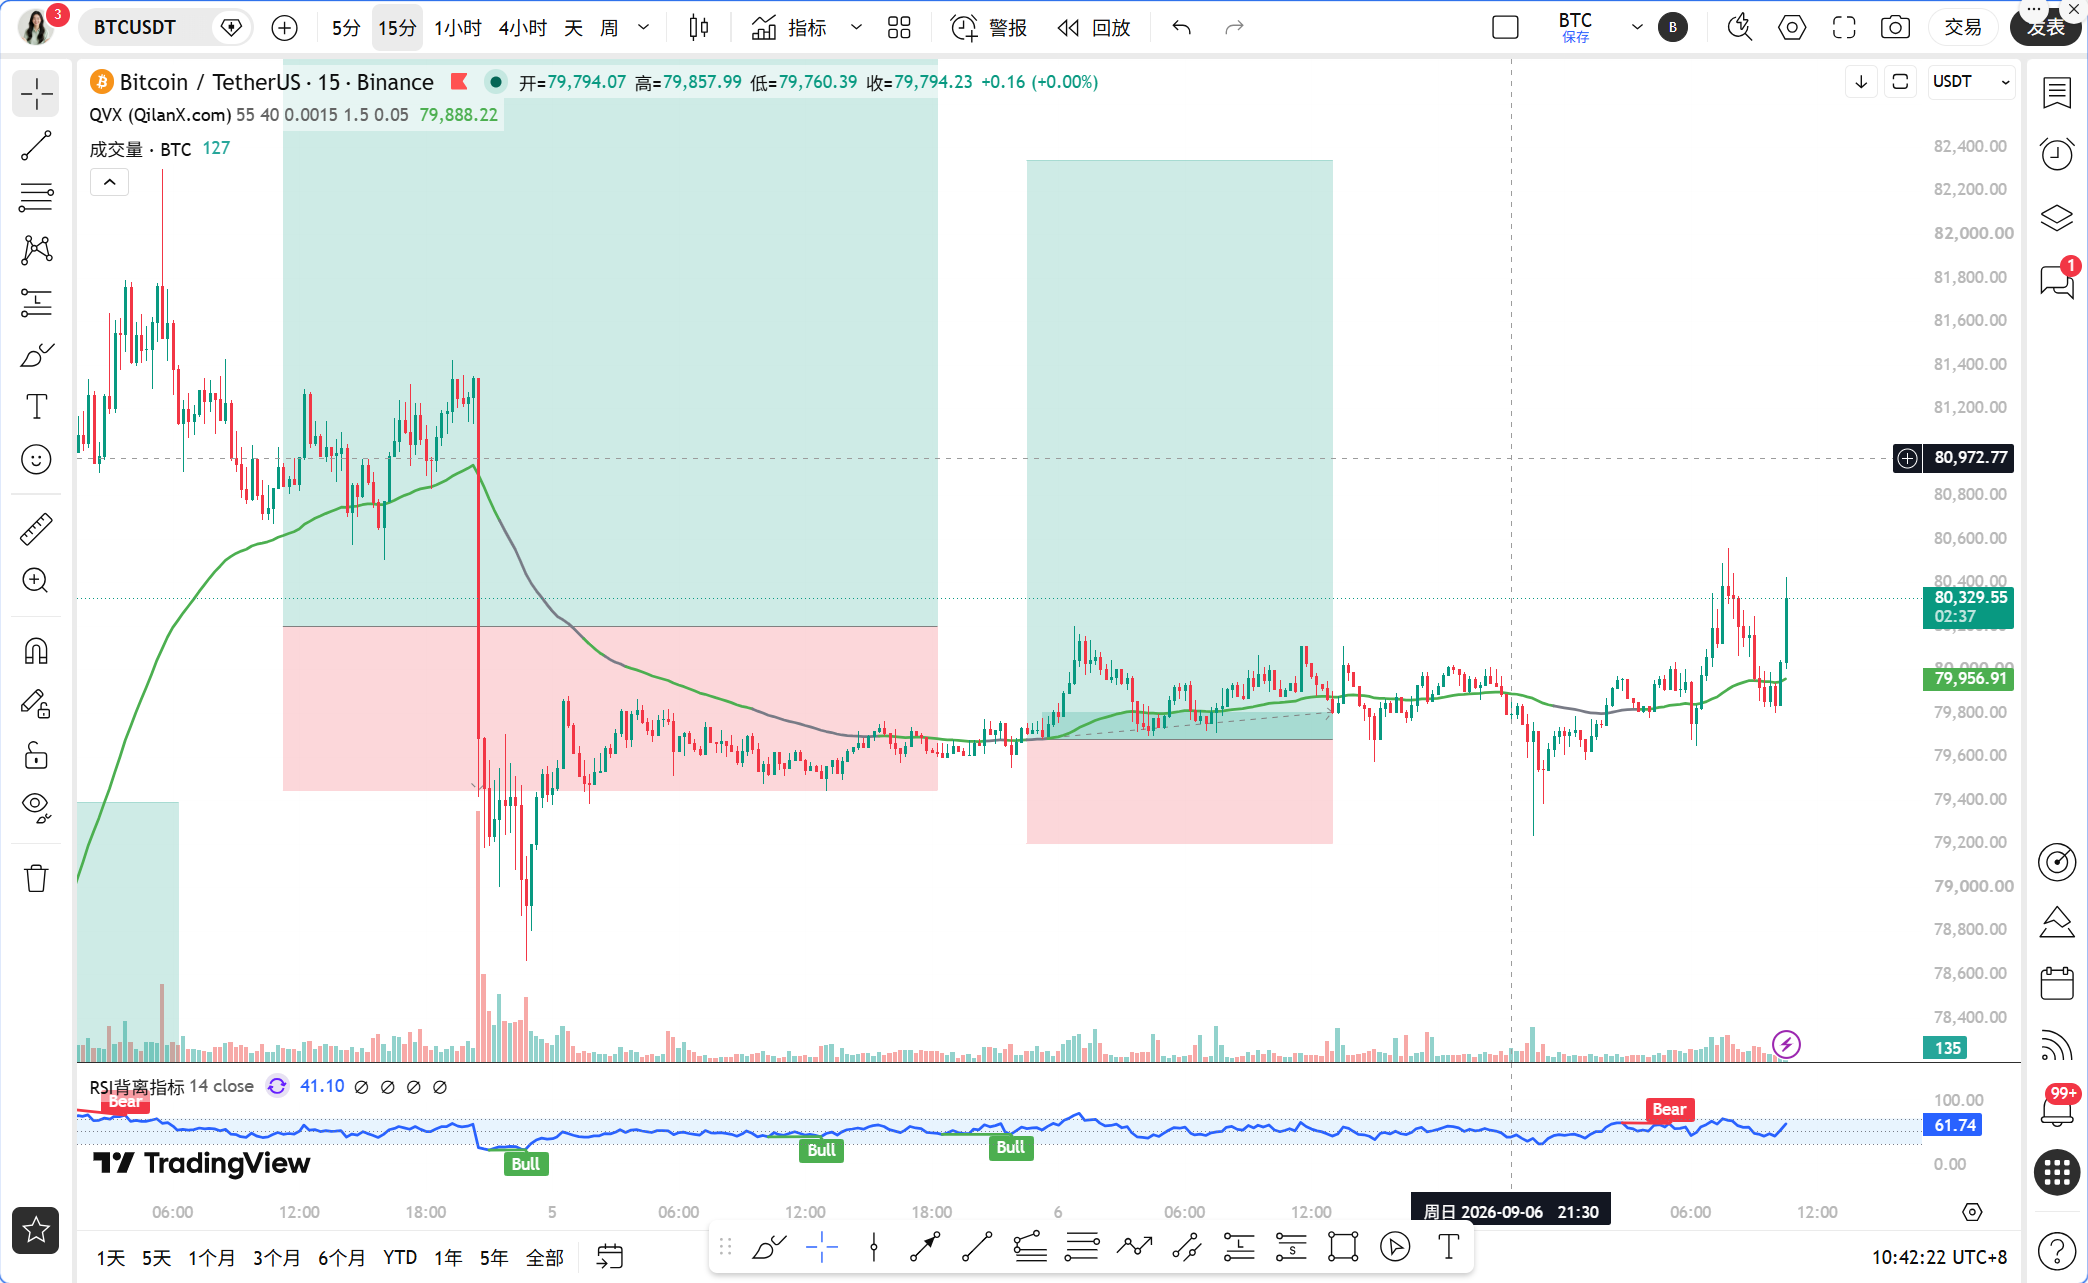
The current time is September 7th, 10:42 AM, with BTC quoted at 80326 USDT, a 24-hour decline of 0.14%, basically in a horizontal state. The price is running above 80,000, but it does not feel solid, as both bulls and bears have been pulling back and forth at this position. The Fear and Greed Index is at 71, indicating that the market is in a greedy range, which often leads to sharp declines for purging when such sentiment is present, so everyone should be aware of this.
Looking at the daily level, MA5 is at 80286, MA10 at 79070, and MA30 at 73286, with the moving averages still in a bullish arrangement, indicating that the mid-term trend has not deteriorated. However, the MACD histogram is negative at 185.57, and both DIF and DEA are becoming dull at high levels, indicating that the upward momentum is diminishing. The RSI is at 54.8, neutral but slightly strong, with neither overbought nor oversold conditions. The issue on the daily chart is the lack of strength in the upward movement, as the trapped positions and profit-taking positions above 80,000 are waiting for opportunities to escape.
The 4-hour level is more intuitive, with MA5 at 80026, MA10 at 79935, and MA30 at 79461, where the price is closely sticking to the short-term moving averages. The MACD histogram is negative at 22.03, and DIF is below DEA, indicating that the 4-hour level has entered an adjustment rhythm. The RSI is at 62.42 and has dropped from high levels, indicating there is still room for further decline. If the 4-hour level cannot hold above 79500, the next support to look for is near 78500.
The 1-hour level is currently the most crucial observation window. EMA55 is at 80025, and the current price is at 80326, just above EMA55. MA5 is at 80161, MA10 at 80019, and MA30 at 79908, where the short-term moving averages are closely entwined, indicating that the 1-hour level has no clear direction. The MACD histogram at 44.27 is positive, and DIF is above DEA, showing a slight bullish short-term momentum, but not strong enough. The RSI is at 58.73, neutral but slightly strong.
At the 15-minute level, MA5 is at 79995, MA10 at 80036, and MA30 at 80006, where the moving averages are completely intertwined. The MACD histogram is negative at 8.22, and DIF is below DEA, indicating short-term retracement pressure. The RSI is at 54.39, neutral. The 15-minute level presents a typical disordered fluctuation, with no operational value.
Now, let's use the Qinglan TPV system to verify the signal. The core rule is that the 1-hour EMA55 serves as the boundary line for long and short positions, with the current EMA55 at 80025 and the price at 80326 above EMA55. However, the oscillation auxiliary data shows that in the past 8 one-hour candles, the closing price was greater than EMA55 4 times and crossed it 3 times. The current price is 0.38% away from EMA55. This data fully meets the oscillation determination threshold, with at least 3 closing occurrences above and crossing occurrences greater than or equal to 2. Therefore, the 1-hour level is qualitatively determined as an oscillation market, so do not actively go long or short, only provide ideas for range operations.
Specifically looking at the patterns, there has been no consecutive 1-hour K-line closing price that has steadied above EMA55, nor any long lower shadows or bottom formations indicating stable support. Although the MACD histogram has been consecutively positive, there has not been a consecutive two-cycle shortening characteristic indicating momentum exhaustion. Long conditions are not met. On the short side, the price has not been under pressure below EMA55 and similarly does not meet conditions. Thus, the conclusion given by the TPV system is to wait and observe, taking action only once the direction is clear.
In terms of on-chain data, BTC's market share is at 59.24%, still at a high level, indicating that funds are rotating within BTC and have not flowed significantly into altcoins. The Fear and Greed Index at 71 indicates that greedy sentiment is dominant, which historically makes this position prone to corrections. Additionally, the news of Jiang Zhuoer's liquidation of BTC is worth noting; he indicates that there is a dense liquidation area around 76000 dollars, and if this position is touched, it may trigger a chain reaction. The probability of the Federal Reserve raising interest rates by 25 basis points in September has reached 58.6%, and the tightening expectations are putting pressure on BTC's valuation, which is a macro variable that needs to be continuously tracked in the mid-term.
Regarding key attack and defense positions, the first resistance level above is at 81000, where the intensity of the liquidation for short positions reaches 470 million dollars. Once it breaks through, it will trigger concentrated liquidations of short positions and propel prices upward rapidly. The second resistance level is at 82000, near the previous rebound high point. The first support level below is at the round number of 80000, which is also the position of the 1-hour EMA55; if this position is lost, it will trigger stopping loss orders for short-term bulls. The second support level is at 79500, a dense support area of the 4-hour MA10 and MA30. The third support level is at 78500, an important structural position at the 4-hour level. The last defensive line is at 77000, corresponding to the upper edge of the liquidation area pointed out by Jiang Zhuoer.
Regarding trading ideas, Sister Qinglan provides everyone with a clear framework. The current 1-hour level is determined as oscillating; therefore, do not chase gains or losses, focusing primarily on high selling and low buying within the range. The bias is towards bullish but do not actively chase longs, waiting for the price to confirm support after pullbacks before entering. Conditions for entry focus on two positions: the first is the range between 79500 and 80000; if the price pulls back here and shows a bottom formation or long lower shadow at the 1-hour level, and the MACD histogram shows a continuous two-cycle shortening, you can try going long with a small position, controlling it to within 20%. Place the stop-loss at 79200, which is 300 points below the lower edge of the entry range, to prevent false breakouts. The first target is set at 81000, and after breaking through, the next target is 82000. The second entry condition is if the price breaks through 81000 and stabilizes, this position has high short liquidation intensity. After the breakout, there might be an accelerated trend, enabling a long position, with a stop-loss set at 80600 and a target of 82500 to 83000. If the price directly falls below 79200, it indicates that the lower edge of the oscillation range has been effectively broken, and all long positions should exit, flipping to short with targets at 78500 and 77000, with a stop-loss at 79800.
In terms of risk alerts, currently, it is in a greedy region combined with the awakening of giant whales and sidechain anomalies; any news impact could lead to spikes in prices, so strict stop-losses are essential to ensure safety.
Follow Qinglan's crypto classroom to seize more trading opportunities! Welcome to visit the official website www.qinglan.org
📊 Qinglan TPV trading strategy backtesting reference
🕒 Last backtesting time 09-07 07:00:01
Total analysis: 3870 Backtests: 3866 Accuracy rate: 79% (3055/3866)
免责声明:本文章仅代表作者个人观点,不代表本平台的立场和观点。本文章仅供信息分享,不构成对任何人的任何投资建议。用户与作者之间的任何争议,与本平台无关。如网页中刊载的文章或图片涉及侵权,请提供相关的权利证明和身份证明发送邮件到[email protected],本平台相关工作人员将会进行核查。