Cryptocurrency Expert: Can the rebound of Ethereum (ETH) at 9.4 continue? Analyzing the divergence patterns of Ethereum's cycles? Latest market analysis reference
The current price of Ethereum is 2490. After a strong surge, has the main force finished buying? NO! The market has begun to enter a phase of oscillation and tug of war, which is the norm. After a big increase, the market has clearly intensified in divergence; some believe the bullish trend has been established, and any pullback is an opportunity to enter, while others think the short-term gains have been overstretched and a deep pullback could come at any time. The market will never move according to everyone’s expectations; the only thing to do is to choose the right position to enter and hold on tight. If you, like me, entered around 1700 and 1650, don’t rush to exit; if you haven’t entered yet, continue reading the article content.
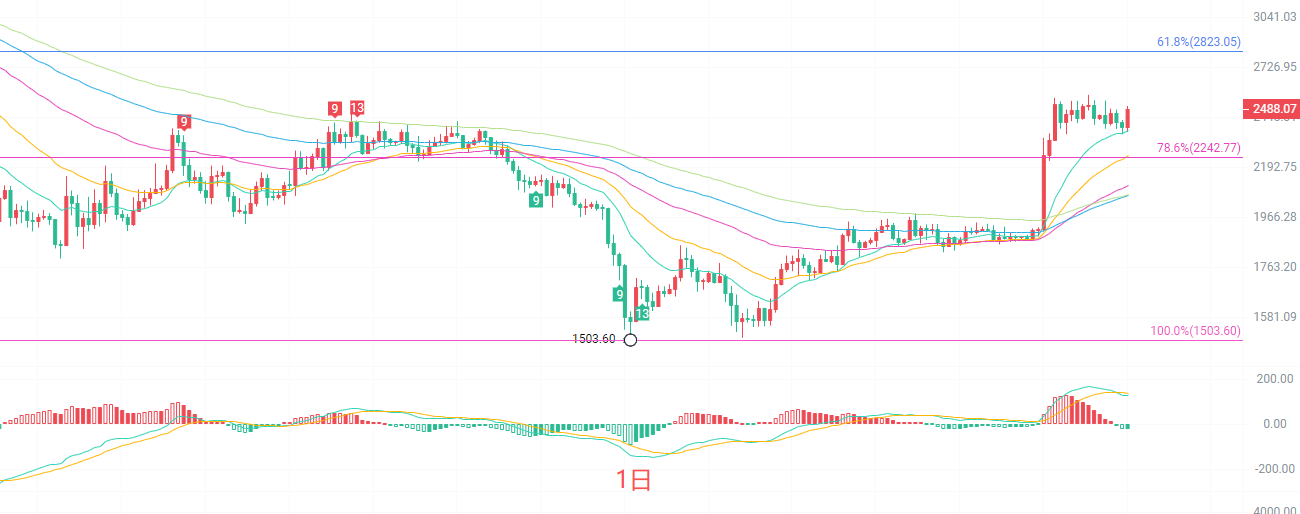
The daily K-line has touched the Fibonacci 78.6% level and is running above 2242, keeping the overall bullish structure intact. Multiple EMA moving averages have all turned upwards, and the price is firmly above the moving averages of all cycles, with strong support forming on the mid-to-long-term moving averages. However, the bullish momentum of the MACD indicator is beginning to gradually weaken, with the red bars continuously contracting, and the upper Bollinger Band is forming short-term pressure, indicating that after continuous increases, the bullish strength has been somewhat exhausted, and there is a demand for short-term pullback to digest. The strong resistance on the daily chart looks towards the 26382660 range, with the first support below at 2242. If this position holds, the larger-scale rebound trend will not be broken; if it effectively falls below, the market will further pull back towards around 2070.
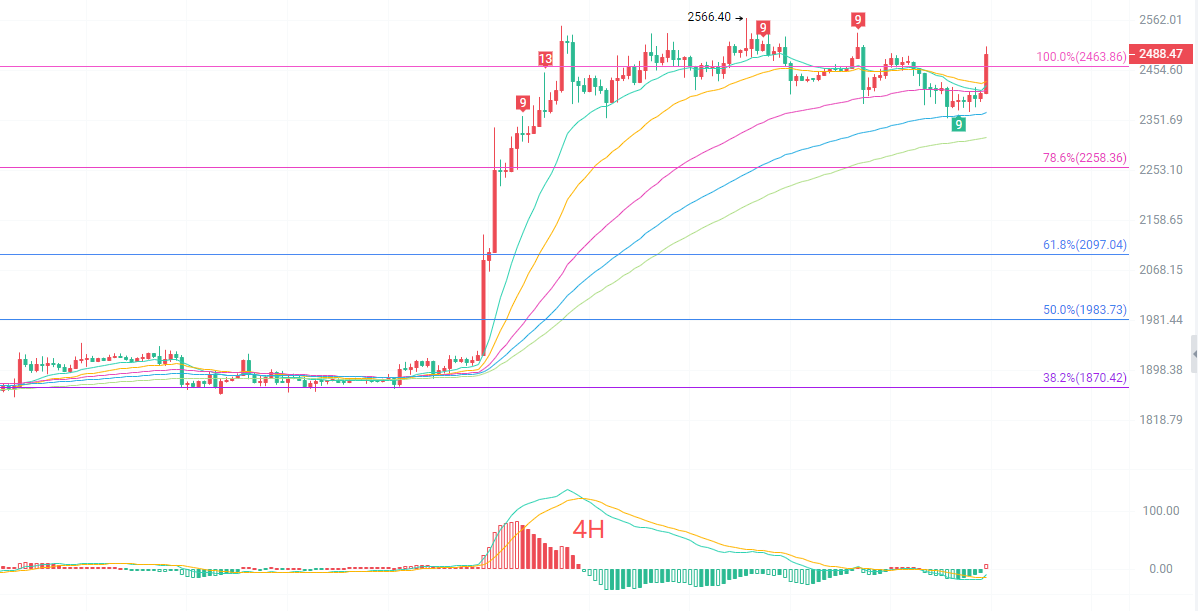
The four-hour K-line rebounded again after pulling back to the key Fibonacci 100% level near 2463. The short-term EMA moving average system still maintains a bullish arrangement, but the short-term K-line repeatedly touching the upper Bollinger Band has faced pressure; the MACD dual lines have turned downward at highs, and bullish volume continues to shrink, showing a top divergence warning signal. The four-hour chart shows that bullish upward momentum is not as fierce as in previous stages, and the market is likely entering a high-level range-bound oscillation mode. Upper pressure is at 25602566, and the key support below is 2356, which is the 78.6% pullback level and also the short-term bullish lifeline. If it holds here, the oscillation will be biased towards strength; if it breaks below, it will open up space for further downward pullback.
Short-term reference:
If the lower range of 2350 to 2360 does not break, move upwards, with a stop loss of 40 points, targeting 2550 to 2630.
If the upper range of 2560 to 2566 shows stagnation and moves south, with a stop loss of 40 points, targeting 2460 to 2360.
Specific operations should mainly rely on real-time market data. For more detailed information, you can consult the author. There may be delays in the article release; suggestions are for reference only, and risks are borne by oneself.

Friendly reminder: The above content is solely created by the author of the official account. Advertisements at the end of the article and in the comments section have no relation to the author. Please discern carefully; thank you for reading.
免责声明:本文章仅代表作者个人观点,不代表本平台的立场和观点。本文章仅供信息分享,不构成对任何人的任何投资建议。用户与作者之间的任何争议,与本平台无关。如网页中刊载的文章或图片涉及侵权,请提供相关的权利证明和身份证明发送邮件到support@aicoin.com,本平台相关工作人员将会进行核查。