Average daily net inflow of $290 million into ETFs struggles to support secondary trading, and the market falls back into the range.
Written by: Glassnode
Translated by: AididiaoJP, Foresight News
After the short squeeze in mid-August, the market briefly surged, but Bitcoin quickly stalled below the long-term overhead resistance. Sovereign bond yields reached a new high in this round, with secondary ETF turnover remaining weak, and prices fell back into a clear range.
Key Points Overview
- The rebound driven by the short squeeze in August pushed spot prices to around $80,000, then encountered anticipated overhead resistance.
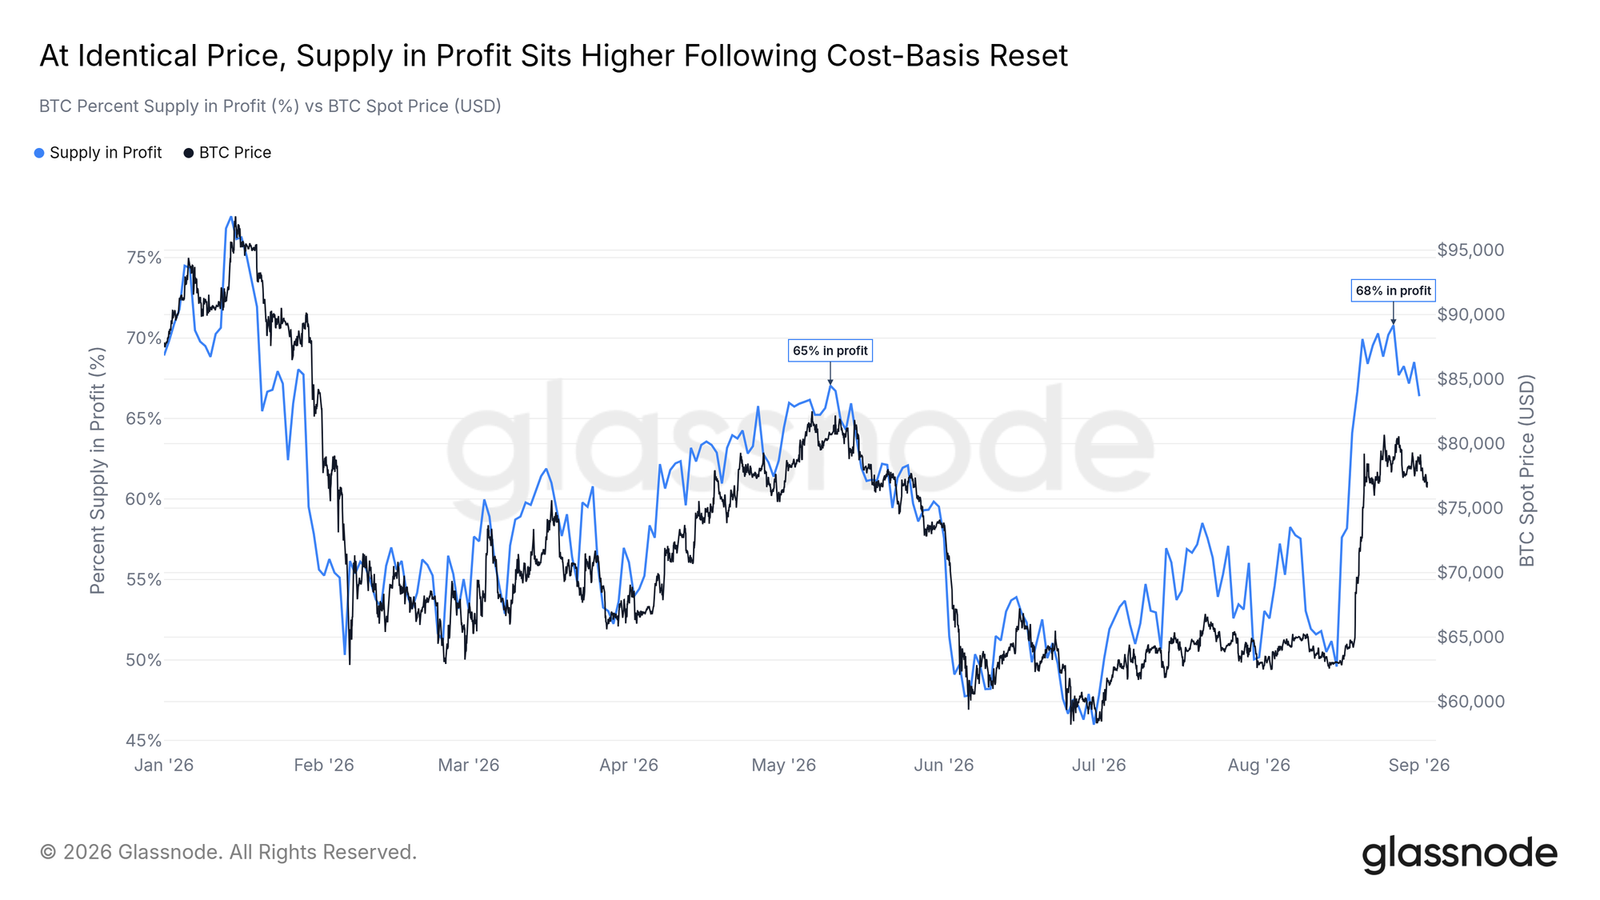
- When prices retraced to the same position as in May, the on-chain profit supply rose from 65% at that time to 68%, with potential selling pressure heavier after summer chip redistribution.
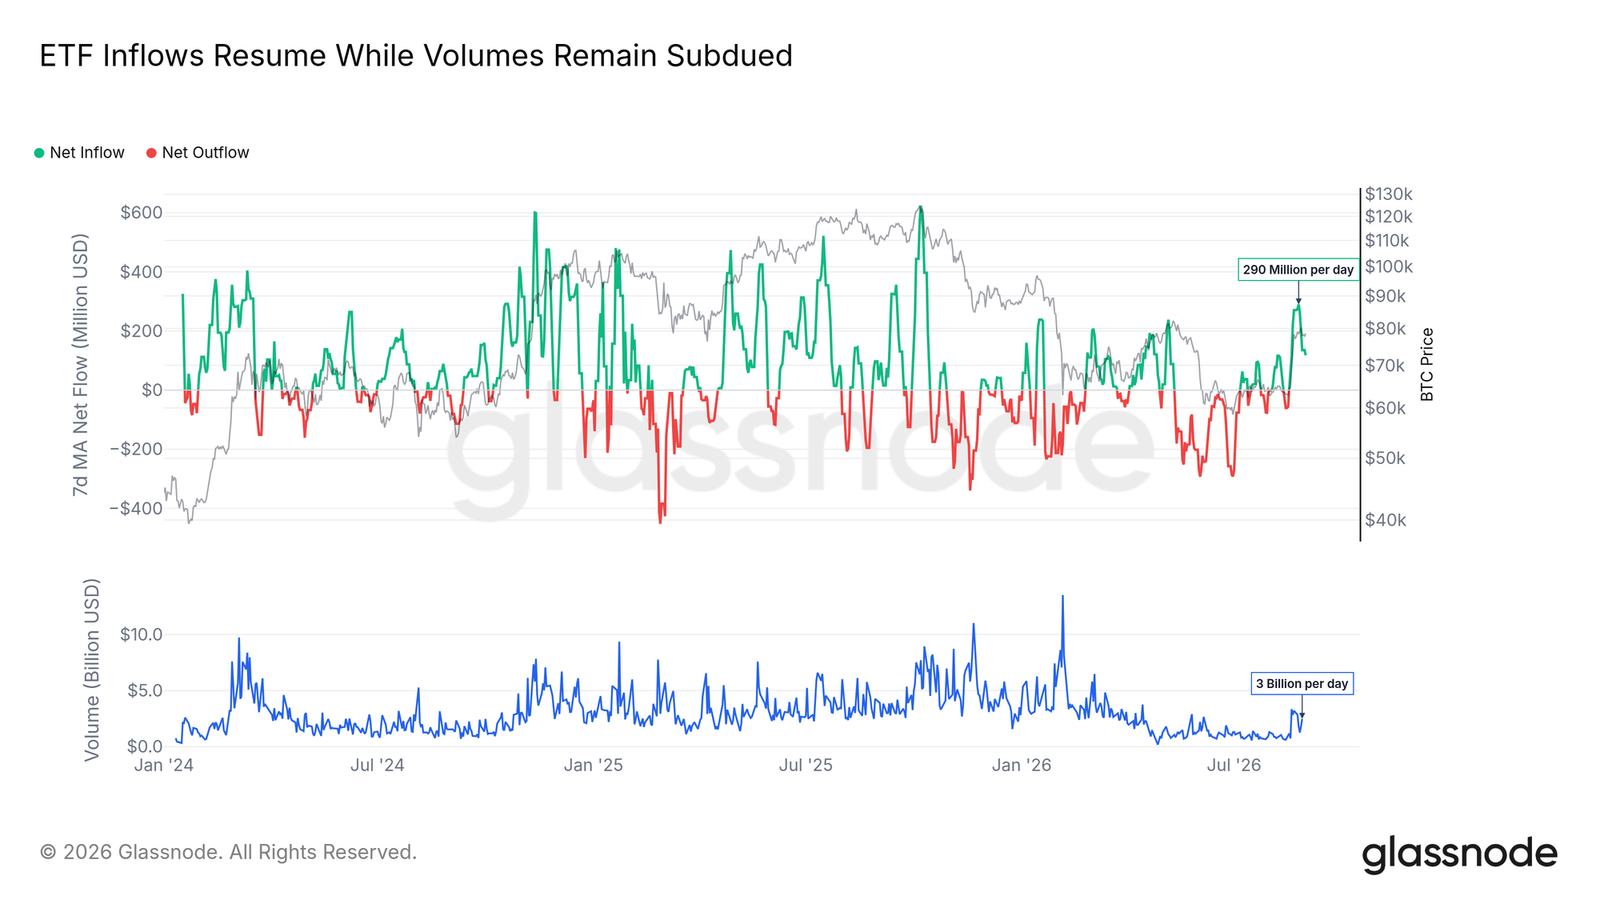
- The spot Bitcoin ETF peaked with an average daily absorption of $290 million, but secondary market daily trading still hovers around $3 billion, resembling a pulse driven by news lacking sustained momentum.
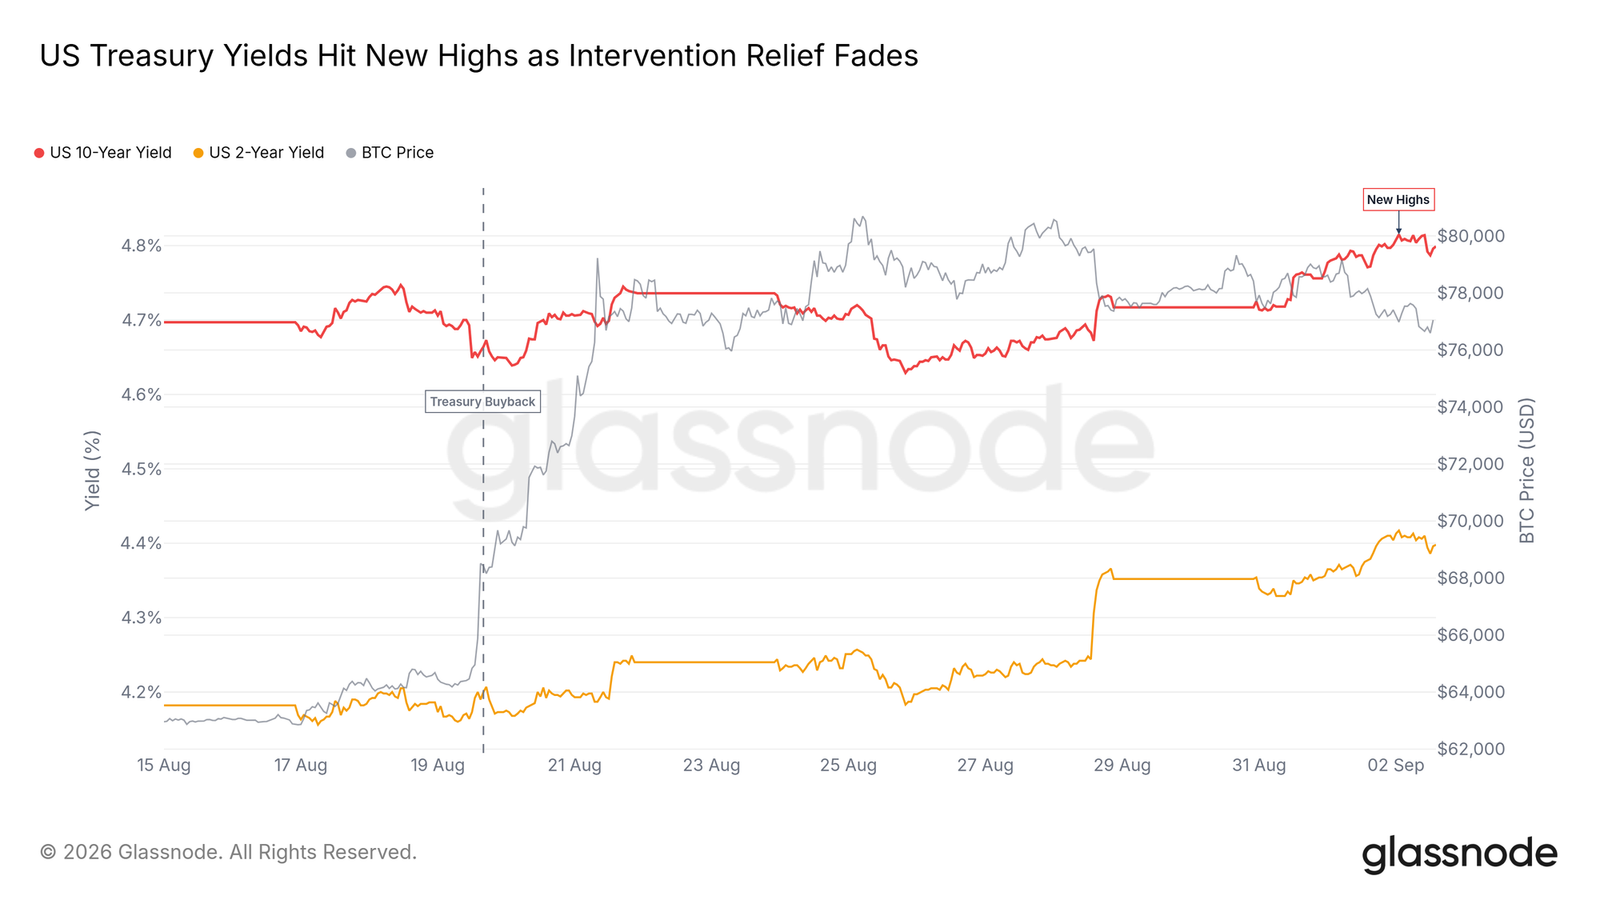
- Renewed macro pressure: The yield on 10-year U.S. Treasury bonds rose to 4.8%, quickly erasing all the relief from the Treasury's repurchase in just eight trading days.
- Short-term options skew recedes as sentiment cools down; around $14 billion in open interest barriers form with the September 25 quarterly expiration.
After the Squeeze: Rejected at the Wall
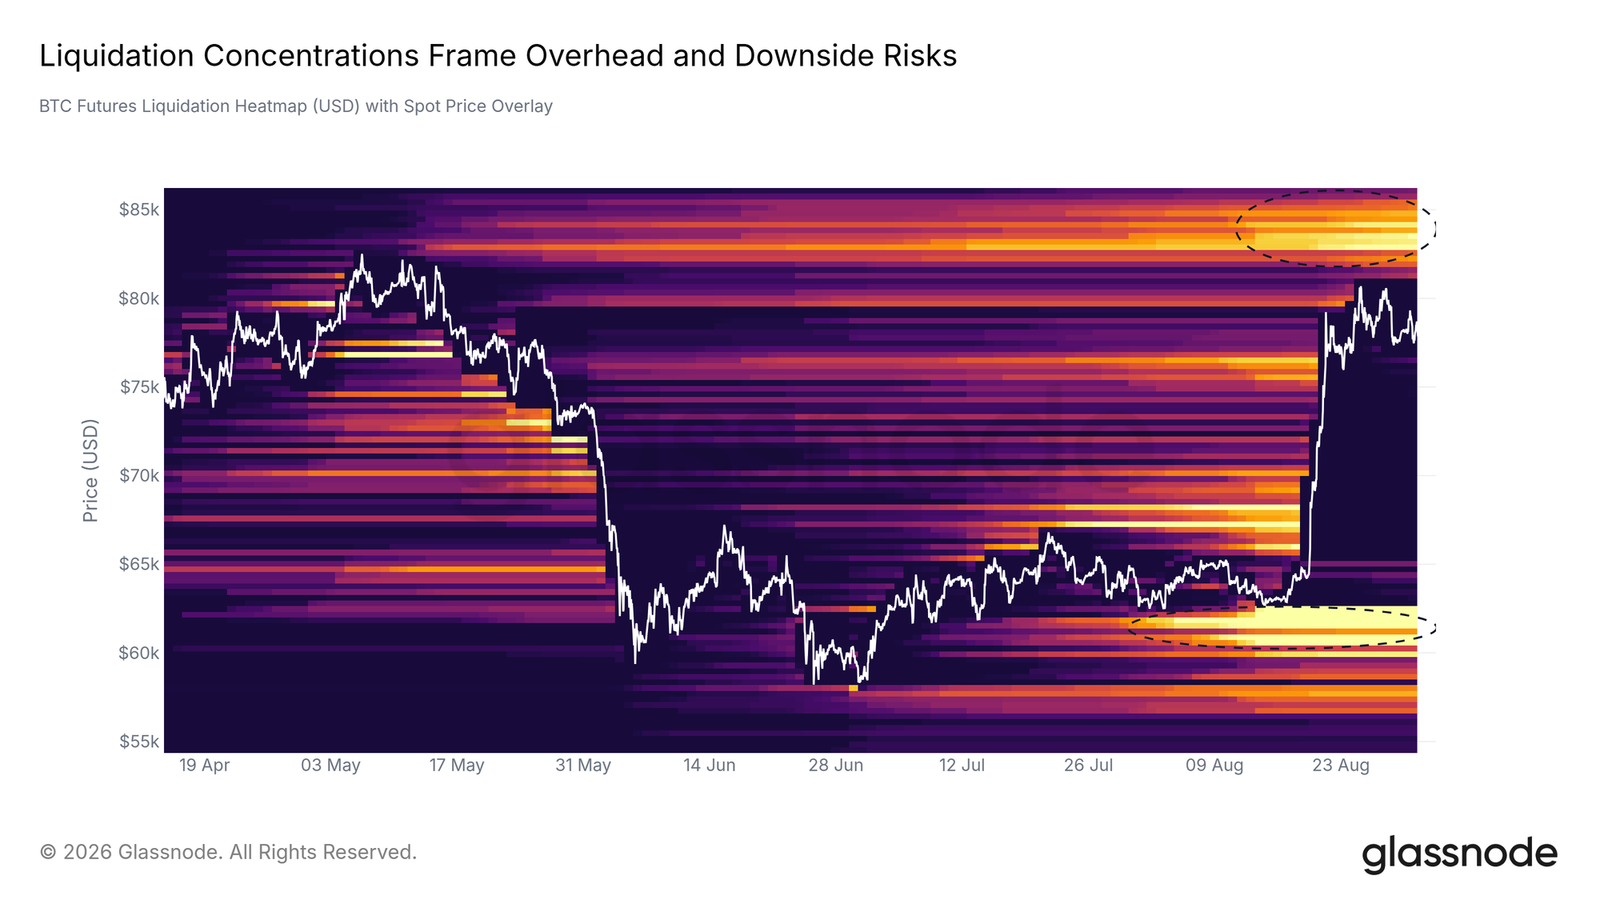
The previous weekly report pointed out: The short squeeze on August 19 eliminated a significant amount of leverage, but the upward momentum hit a dense overhead structure. This scenario played out last week. After the price surged to $80,000 on August 27, it met continuous supply, falling back to around $76,000 and triggering a series of long liquidations.
The futures liquidation heatmap shows that prices are stuck between two structures above and below. The upward pulse consumed the short positions along the way but did not reach the concentrated short liquidation zone at $83,000-$86,000; below the spot, the long liquidation fuel at $60,000-$63,000 remains intact. Currently, the price is trapped between these two boundaries.
On-chain Supply: Profit Sitting at the Top
The hidden friction in this rally lies within the overall network's profitability structure. In May, when Bitcoin was around $78,000, about 65% of the supply was in profit; by the end of August, when the spot returned to the same price level, the profit proportion had risen to 68%.
The change comes from summer accumulation—the cost basis for short-term holders has been reset to around $71,000. While the nominal price remains the same, it can activate a larger batch of already profitable chips, and once the spot tests previous highs again, potential selling liquidity will be thicker.
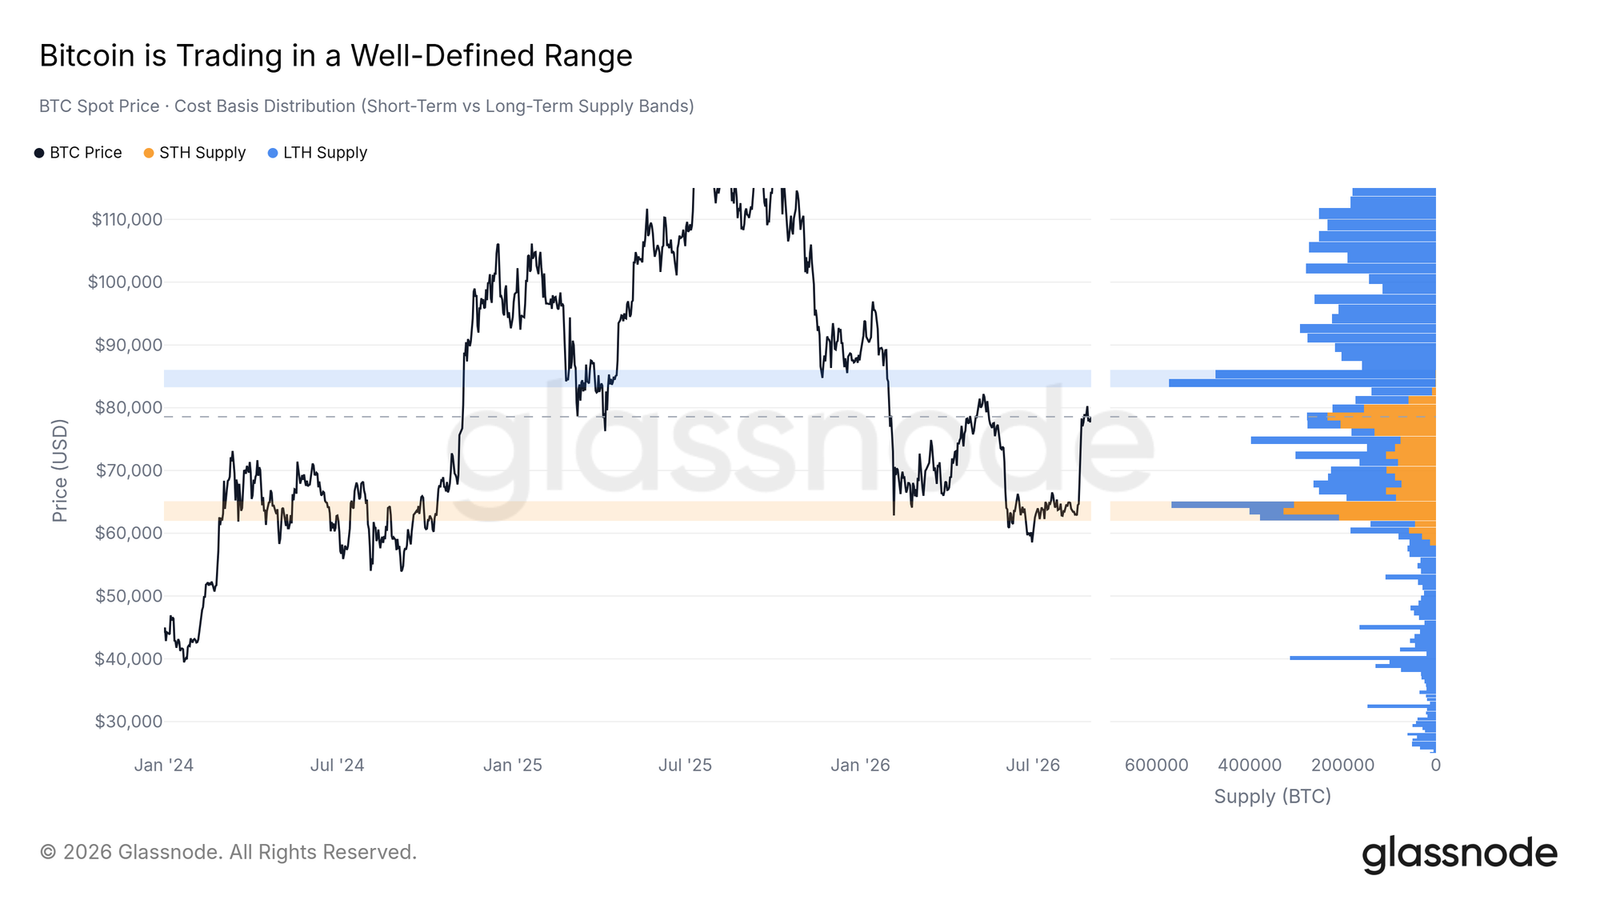
By overlaying the on-chain cost model with chip distribution, the range boundaries are clear: below the spot, summer consolidation has formed a solid accumulation bottom at $62,000-$65,000; above, long-term holders have accumulated large positions at $83,000-$86,000. The spot remains locked within these two ranges.
Institutional Channel: Lack of Turnover
The U.S. spot Bitcoin ETF continuously attracted funds during the rally, with a 7-day average net inflow rising to $290 million daily. However, secondary trading is quieter: ETF daily trading volume remains around $3 billion, significantly lower than during the previous expansion phase. Driven by single policy news but lacking broader market speed of inflow, this often corresponds to local turning points—once the catalyst passes, prices tend to retrace.
Macro Background: Rebound in Sovereign Yields
The broader environment quickly tightens again. On August 19, news of Treasury repurchases briefly pushed the yield on 10-year U.S. Treasuries down to around 4.6%, but it swiftly reversed. Over the following eight trading days, the yield returned to 4.8% and hit a new high in this round. The rapid retracement indicates that sovereign debt pressures remain the primary driver of the global discount rate.
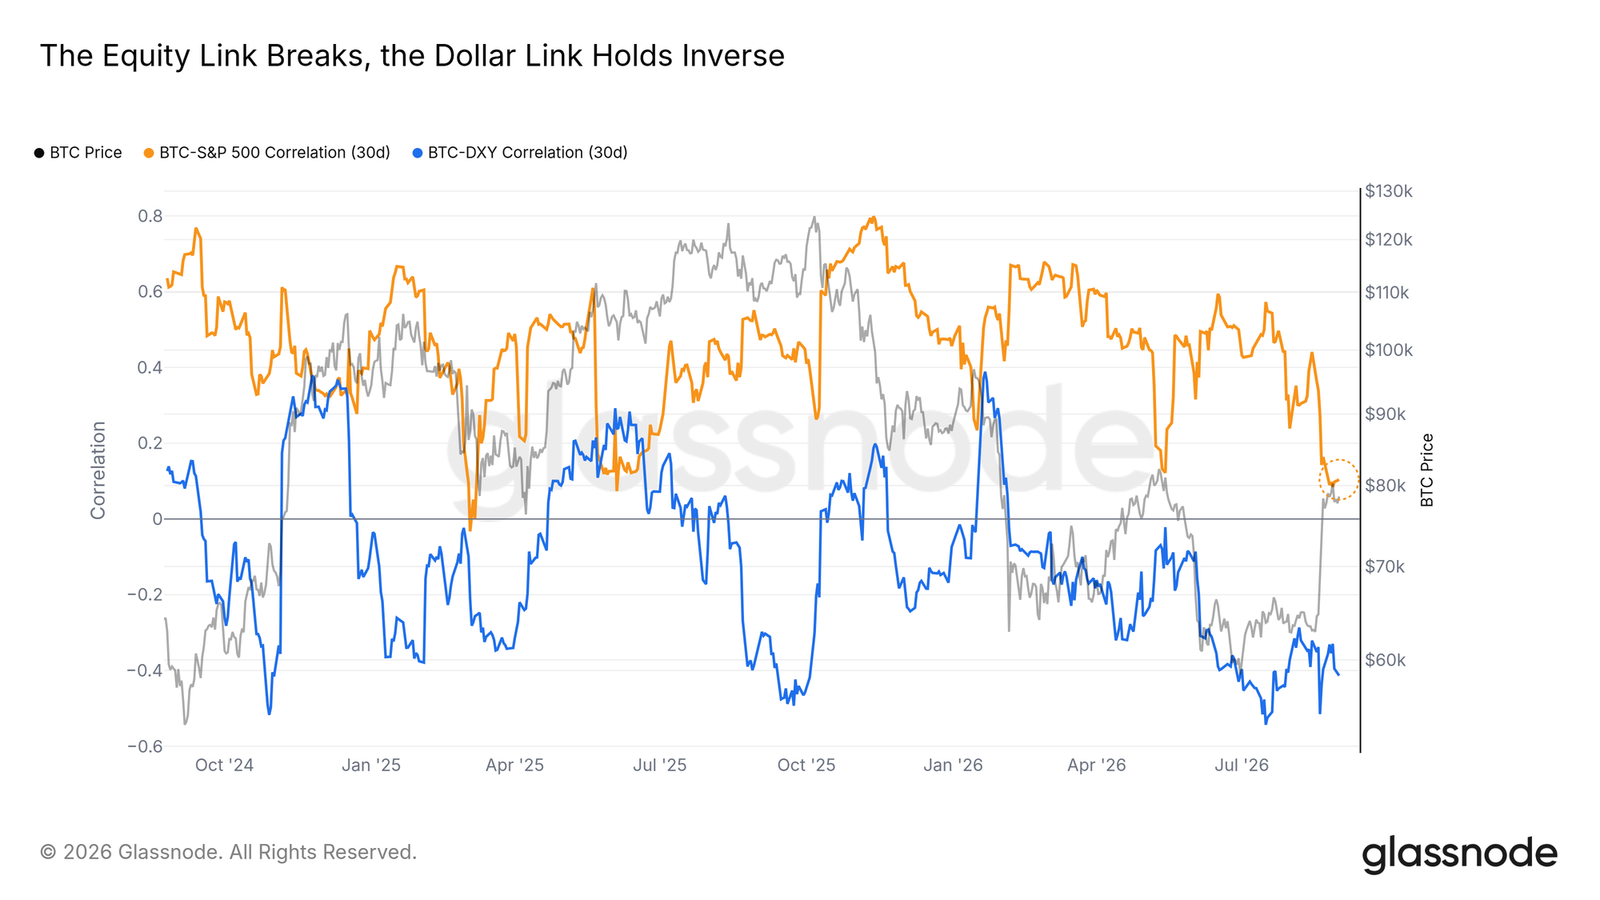
In the early stage of the rebound, Bitcoin briefly decoupled from traditional stock indices, with U.S. stocks trading sideways. Over the last 30 trading days, the correlation coefficient between Bitcoin and the S&P 500 slid towards zero. Historically, sudden decoupling during periods of sovereign debt sell-offs is often short-lived, resembling a local exhaustion rather than an institutional shift.
Derivatives and Expirations: Sentiment Receding from Exuberance
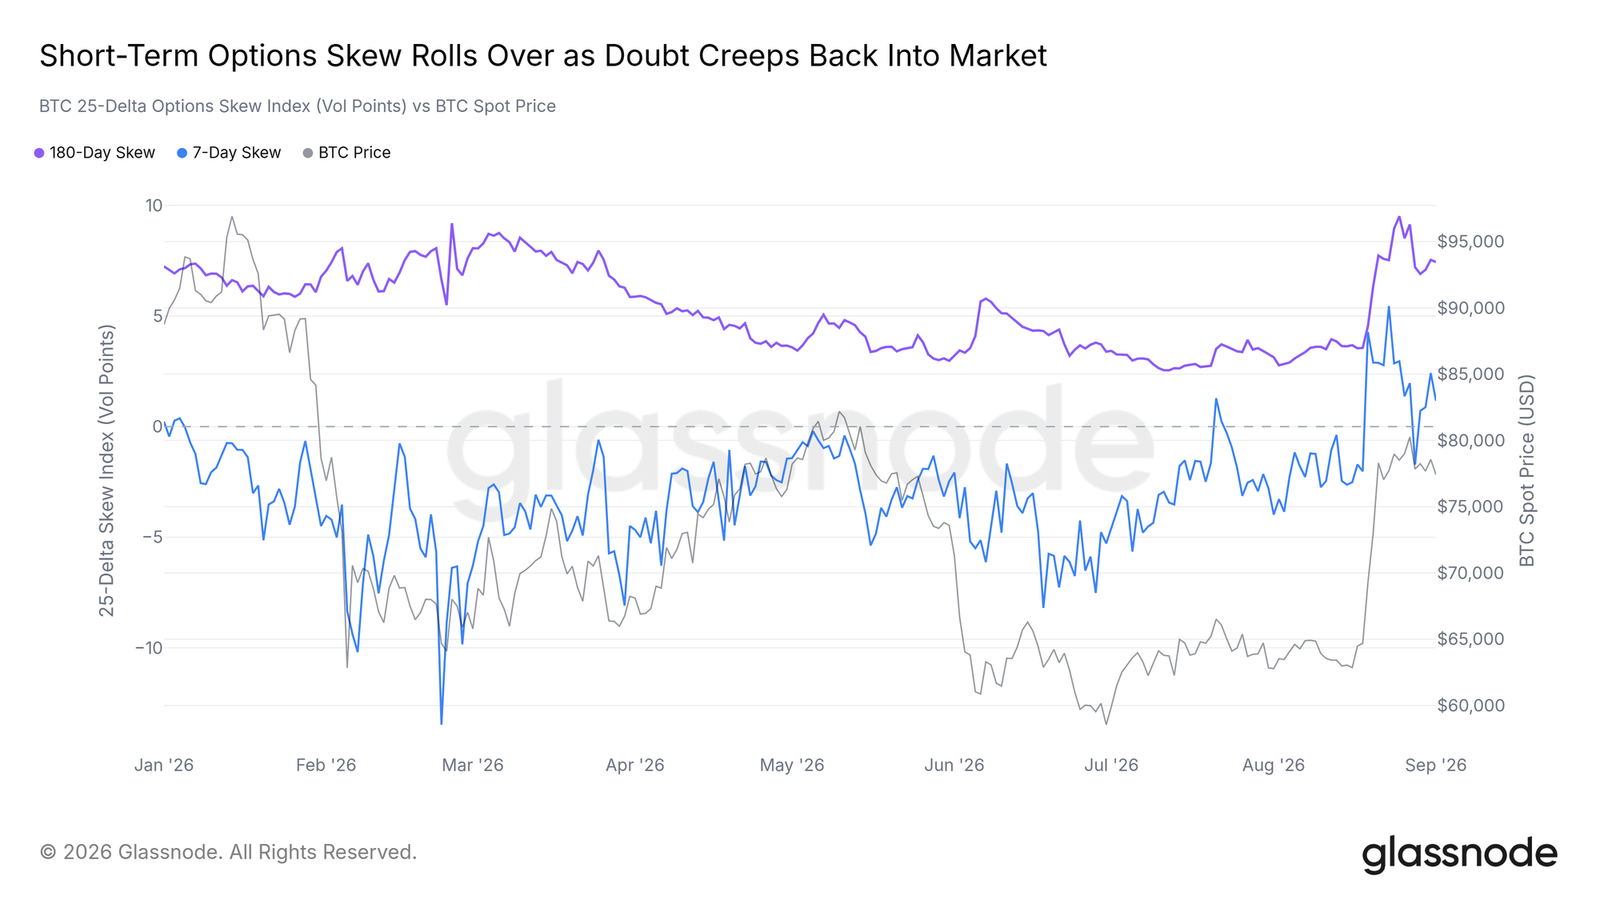
The options market recorded a psychological twist over the past two weeks. The 7-day 25-delta skew index surged sharply during the squeeze, reflecting the market's eagerness for bullish options; after the resistance held, the indicator quickly reverted to the mean, approaching neutrality. The 180-day skew remained stable throughout, indicating that short-term enthusiasm is cooling down, but the structure of long-term options demand has not dispersed.
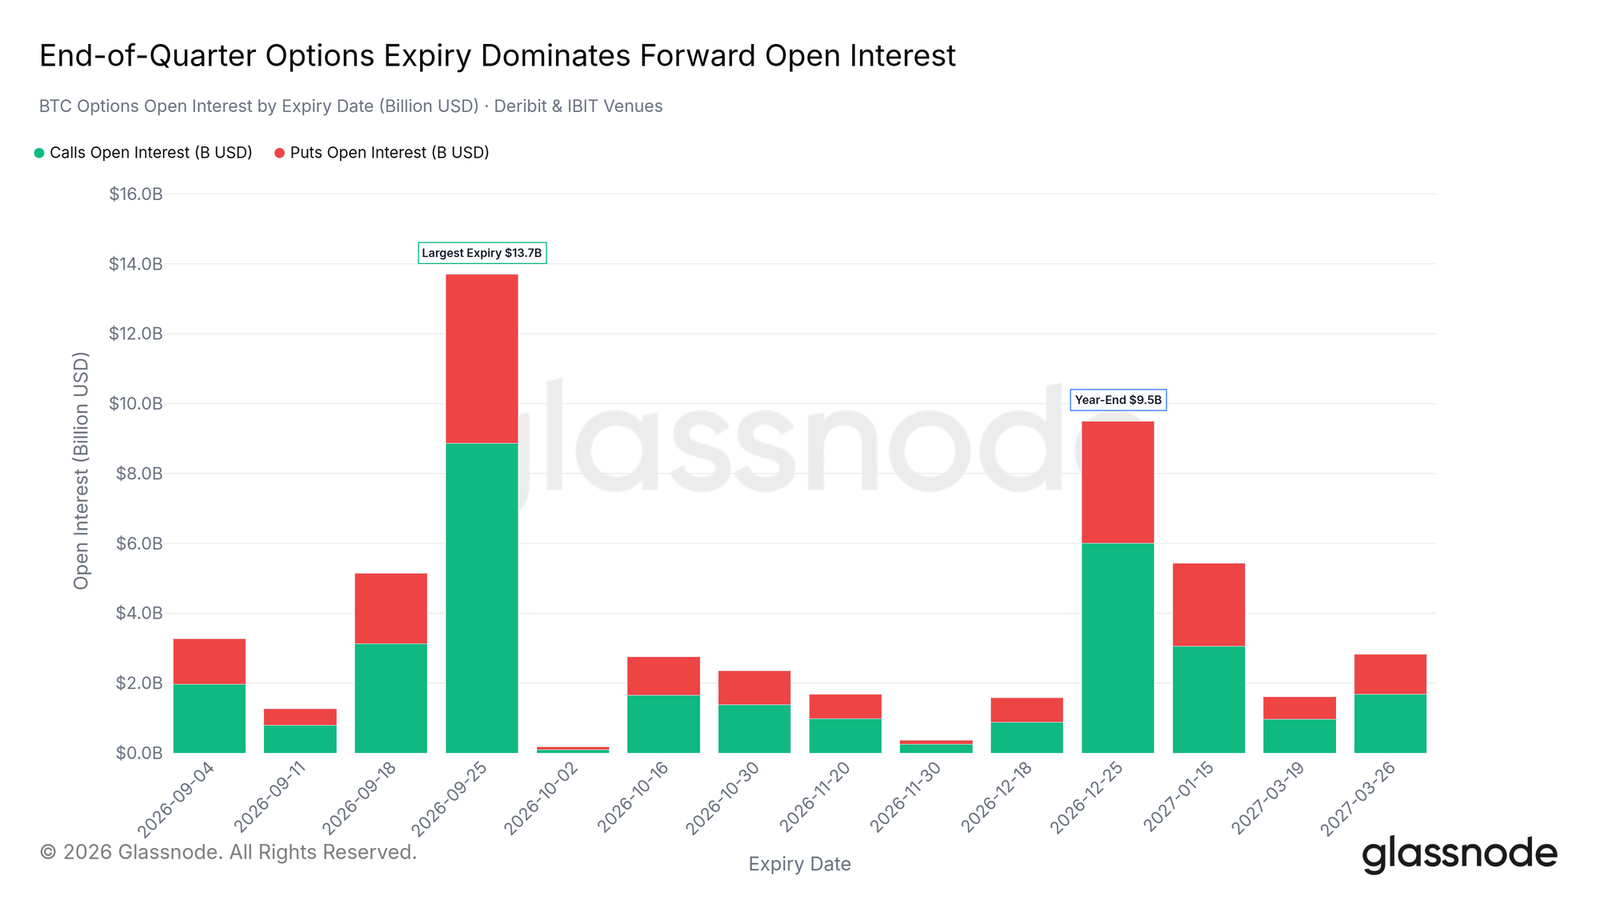
The long-term options landscape is dominated by the quarterly expiration on September 25, with a total of about $14 billion in open interest at Deribit and IBIT. A considerable amount of positions are concentrated around exercise prices above $80,000, and the approaching quarterly expiration will serve as an important anchor for volatility and positions in the coming weeks.
Conclusion
The repair rebound after the short squeeze stops below the supply zone of $83,000-$86,000. At the same price level, network profitability is higher, sovereign bond yields have set a new periodic high, and the options market has returned to neutrality—all indicating that the market remains confined within the existing range. Before the upper ceiling is digested, the structural bottom at $62,000-$65,000 serves as the main downward reference.
免责声明:本文章仅代表作者个人观点,不代表本平台的立场和观点。本文章仅供信息分享,不构成对任何人的任何投资建议。用户与作者之间的任何争议,与本平台无关。如网页中刊载的文章或图片涉及侵权,请提供相关的权利证明和身份证明发送邮件到support@aicoin.com,本平台相关工作人员将会进行核查。


