Cryptocurrency Academy: The 9.3 Bitcoin (BTC) wash trading trap is unfolding, breaking down the underlying truth of Bitcoin's long and short game? Latest market analysis and operational suggestions.
The current price of Bitcoin is 77300, the market is repeatedly tugging back and forth, and the long and short game is extremely fierce. Watching the price jump up and down, many people are getting swept up in stop losses, becoming increasingly hesitant in their operations. The most frightening aspect of a bull market is chasing after spikes and cutting losses; the market will not always move unidirectionally upward, and a pullback as a form of wash trading is normal. Do not let short-term fluctuations disturb your mindset; understanding the structure and maintaining your positions and stop losses is much more important than frequent back-and-forth trading. Currently around 77000, is it a pullback to gather strength or a peak retreat? Technical signals have already provided some clues; let’s objectively break down the current situation.
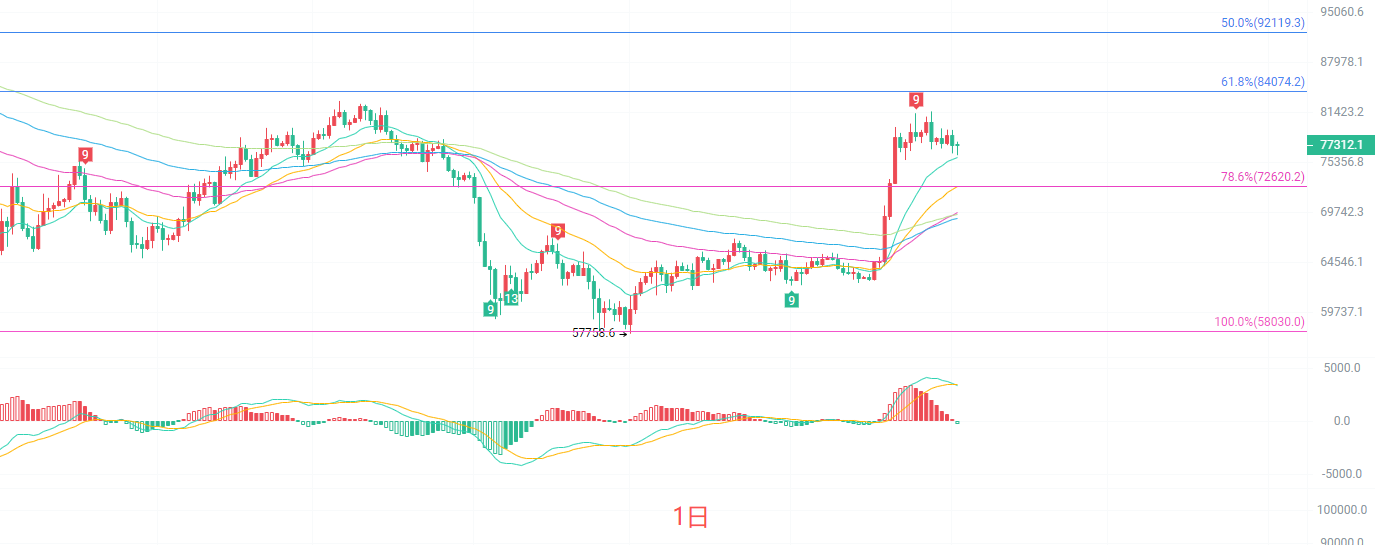
The daily K-line is firmly standing above the EMA15 and EMA30 moving averages, and the medium to long-term moving averages are still trending upward. The Fibonacci 78.6% position at 72620 has formed crucial support, with strong resistance above at 84074. The MACD indicator's red bars are continuously contracting, and there are signs that the DIF is turning downward and approaching the DEA, indicating that bullish momentum is gradually weakening. The Bollinger Bands have begun to converge, with prices falling from the upper band to operate above the middle band. On the daily scale, it shows a high-level oscillation pattern after rising, without a clear reversal signal, but the momentum to continue breaking upward in the short term is insufficient, and it is highly likely to repeatedly test the support below while waiting for a directional choice.
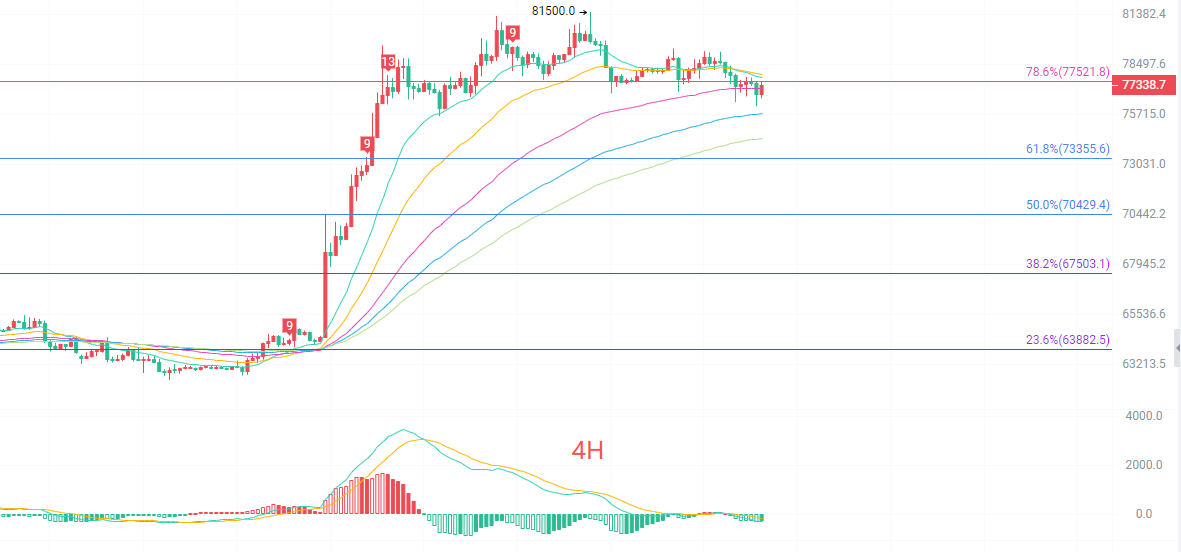
The four-hour K-line has fallen below the EMA15 moving average, and the short-term moving averages are starting to flatten, indicating weakening short-term bullish strength. The key resistance above is at 82828, and the Fibonacci 78.6% position at 77521 is near the current price, forming nearby resistance. The first support below is at 73355, with further strong support at 70429. The 4-hour MACD has moved above the zero line, with the red bars nearly exhausted, presenting a potential risk of forming a death cross. The Bollinger Bands have transitioned from expansion to contraction, with prices oscillating around the middle band. The four-hour level is in a high-level adjustment and consolidation stage, leaning toward weak oscillation in the short term. If it cannot re-establish above 77521, it may further test the support range downward.
Short-term references:
Buy from 74000 to 73400 with a stop loss of 500 points, targeting 77500 to 80000.
Sell from 77500 to 78200 with a stop loss of 500 points, targeting 76500 to 75500.
Specific operations should be based on real-time market data. For more information, you can consult the author. The article publication may have delays; suggestions are for reference only, and risks are at your own expense.

Friendly reminder: The above content is solely created by the author of the public account. The advertisements at the end of the article and in the comments section are unrelated to the author. Please be cautious in distinguishing them. Thank you for reading.
免责声明:本文章仅代表作者个人观点,不代表本平台的立场和观点。本文章仅供信息分享,不构成对任何人的任何投资建议。用户与作者之间的任何争议,与本平台无关。如网页中刊载的文章或图片涉及侵权,请提供相关的权利证明和身份证明发送邮件到support@aicoin.com,本平台相关工作人员将会进行核查。