Academician from the cryptocurrency circle: The upward momentum of Ethereum (ETH) has gradually weakened since September 3, and the risk of a pullback for Ethereum should not be ignored? Latest market analysis reference
The current price of Ethereum is 2392, fluctuating downwards. Those who chase higher prices are afraid of being stuck at the top as soon as they enter the market, while those holding onto their chips worry about quickly giving back the profits they have earned, and those who are out of position fear missing out on the next round of the market. The market is always like this; greedy when it rises, panicking when it falls. Instead of gambling on direction based on feelings, it is better to calm down and understand the market signals, planning the support, resistance, and stop-loss clearly, not allowing the market's emotions of ups and downs to lead the way. Trading until the end is not about occasional windfall profits, but about risk control and trading discipline.
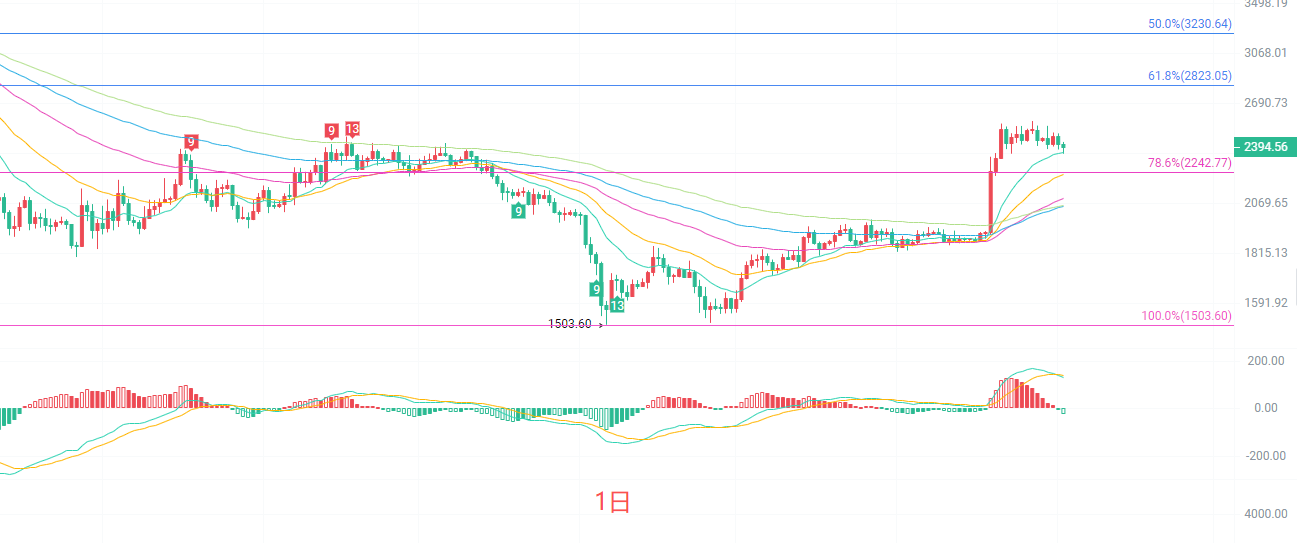
The daily K-line is currently testing near the short-term moving averages, with the EMA15 moving average at 2363 becoming an important short-term support level. The MACD indicator's bullish bars continue to shrink, with the DIF turning downward, and bullish strength is gradually being consumed. After the Bollinger Bands opened, the upper band is under pressure, and the price has not managed to stabilize at the upper edge of the Bollinger Bands. The key resistance above is in the range of 2440 to 2480, which is the pressure zone of the high point of this rebound. The first support below is 2242, which is the Fibonacci 78.6 level. If this level fails, the structure of this rebound will be damaged, and the market will open up more room for a pullback, entering a key window of long-short contention at the daily level.
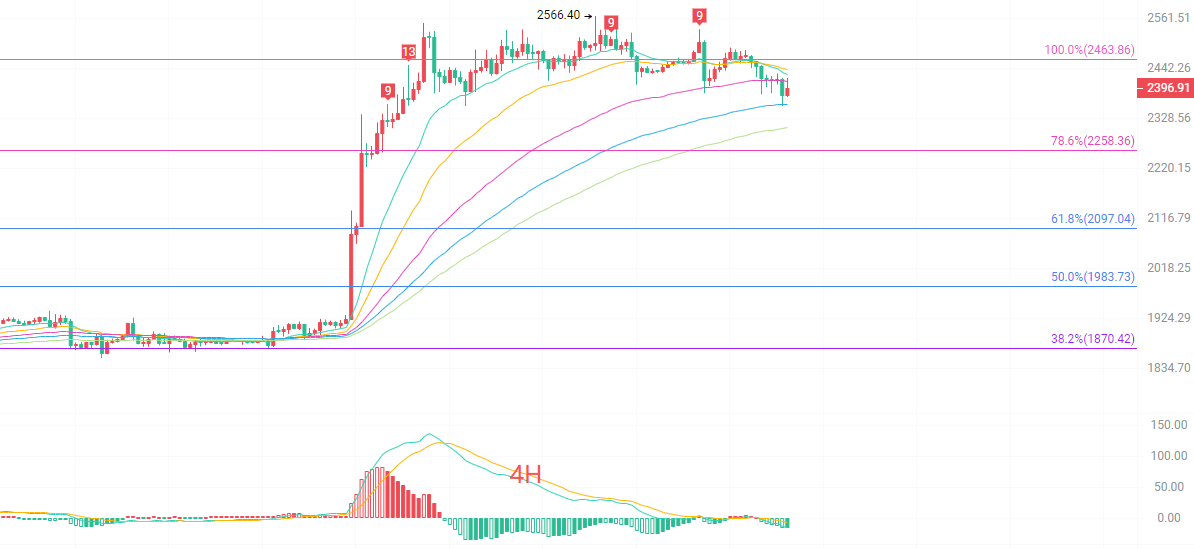
The four-hour K-line has fallen below the EMA15 and EMA30 short-term moving averages, with the short-term trend turning slightly bearish, and the moving averages transitioning from upward divergence to entangled. The MACD continues to operate below the zero axis, with bearish momentum being maintained. The middle line of the Bollinger Bands at 2442 is forming strong resistance, having failed to stabilize after multiple rebounds. The Fibonacci 78.6 position at 2258 is an important defensive support at the four-hour level. The current price is closely following the lower Bollinger Bands, with a slight possibility of a minor rebound to repair moving averages in the short term, but the rebound is more viewed as an opportunity to short under pressure. Only by re-establishing above 2442 can the short-term bearish pattern of the four-hour chart be reversed, otherwise, there are still risks of further declines after the rebound.
Short-term reference:
Do not break the support of 2255 to 2265 below if moving upwards, stop loss at 40 points, target at 2340 to 2380.
Do not break the resistance of 2430 to 2445 above if moving downwards, stop loss at 40 points, target at 2340 to 2300.
Specific operations are primarily based on real-time data from the market; more detailed information can be consulted with the author. The publication of the article has a delay, and it is recommended for reference only, risks are borne personally.

Friendly reminder: The above content is solely created by the author of the official account; the advertisements at the end of the article and in the comments section are unrelated to the author. Please discern carefully, thank you for reading.
免责声明:本文章仅代表作者个人观点,不代表本平台的立场和观点。本文章仅供信息分享,不构成对任何人的任何投资建议。用户与作者之间的任何争议,与本平台无关。如网页中刊载的文章或图片涉及侵权,请提供相关的权利证明和身份证明发送邮件到support@aicoin.com,本平台相关工作人员将会进行核查。