Large investors accumulating positions while retail investors flee, who is footing the bill for the bull market?
Written by: Ashrith Rao
Translated by: Saoirse, Foresight News
Last week, the Bitcoin price surged to $81,500, indicating a shift in market sentiment. However, a closer look at the data reveals that the current market is highly reliant on leverage and has not formed a clear trend, with investor confidence remaining shaky.
The data paints a striking picture: in just seven days, the total market capitalization of cryptocurrencies skyrocketed from $2.21 trillion to $2.64 trillion. According to ChainCatcher, the previously sluggish daily trading volume of $40 billion soared to $162 billion. Grayscale's Bitcoin Trust saw call options volumes surpass one million contracts for three consecutive trading days, setting a historical high of 1.58 million contracts. Traders betting on a favorable market have increased their investments, with the 25-Delta call skew turning positive for the first time since October 2025. It seemed as though the bulls were enjoying a comprehensive victory.
Then, an attack occurred on Matrak Island. On Sunday, Iran retaliated against the U.S. for striking Iranian rocket launch sites near the Strait of Hormuz and launched missiles at a U.S. military base within Jordan.
Bitcoin plummeted sharply from Sunday’s high, falling below $77,000. This rapid decline triggered massive sell-offs, resulting in a loss of dozens of billions in cryptocurrency market value. Approximately $400 million in long leveraged positions were forcibly liquidated. The geopolitical turmoil is the apparent main cause, but that is just a superficial interpretation.
The core argument of this article: what is referred to as a 'recovery' is fundamentally shaky.
Macroeconomic Background
Even before the weekend conflict erupted, the Federal Reserve had already signaled its policy outlook. At the Jackson Hole Economic Symposium, Fed Chairman Kevin Warsh hinted that if inflation does not fall back to the 2% target, further interest rate hikes cannot be ruled out.
The market reacted sharply. The probability of a rate hike in September rose to 56.9%. In just one trading day, the yield on the 2-year U.S. Treasury bond increased by 12.8 basis points, reaching 4.36%.
Such macroeconomic headwinds can significantly impact risk assets, and the Iranian attack incident occurred against an already fragile broader backdrop.
The chain reaction is clear: the market is worried about oil supply in the Strait of Hormuz, pushing oil prices up to $90 per barrel, reigniting inflation concerns. Investor risk aversion has increased, further reinforcing rate hike expectations and strengthening the dollar. Cryptocurrency volatility is extremely high, bearing the brunt of market shocks.
Internal Structural Divergence in the Market
Internal market indicators are also sending warning signals.
This is a turning point that warrants caution. The market capitalization of stablecoins is the most reliable indicator of new fiat money inflow into the crypto ecosystem, and currently, this indicator has virtually no fluctuations. Only USDC has shown slight growth.
Data from ChainCatcher shows that we no longer see the stablecoin expansion seen in the bull market of 2024-2025, when USDT’s market cap surged from $120 billion to $196 billion. This round of market rise is not due to new funds entering but rather existing funds reallocating positions using leverage.
As the weekend approached, the crypto fear and greed index reached 62, placing it in the greed zone. This suggests that after Bitcoin rebounded 31% from its low, the future outlook is not optimistic. When investors heavily bet on resistance levels and fall into greed, they expose themselves to various risks. The behavior of large and ordinary retail investors is extremely divergent. In less than 60 days, large holding addresses accumulated 46,420 Bitcoin; in just seven days, large investors bought approximately 39,000 Bitcoin.
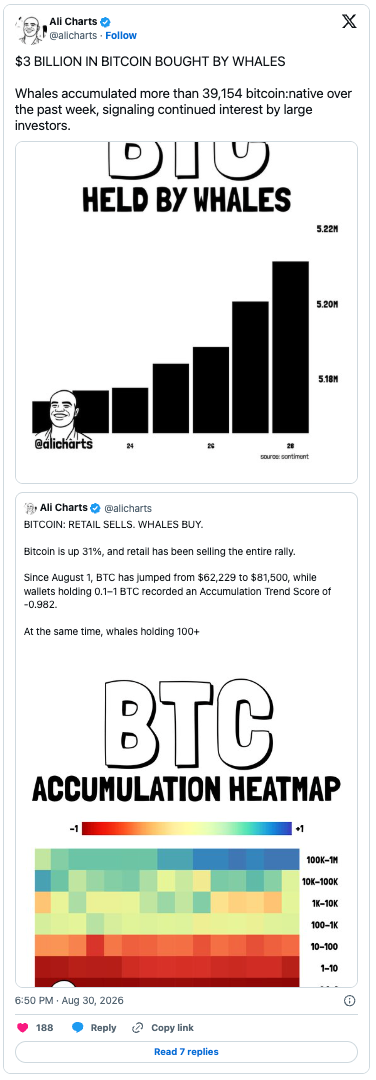
Ordinary investors holding 0.1-1 Bitcoin saw their cumulative trend score reach -0.982, nearly indicating a full sell-off. While large investors continue to accumulate positions, small and medium investors are exiting the market.
This is not a signal of market strength. The article suggests that this round of upward movement is a strategic operation by large investors aimed at shaking out newcomers and those lacking conviction.
The True Test
When this article was published, Bitcoin was priced around $77,600.
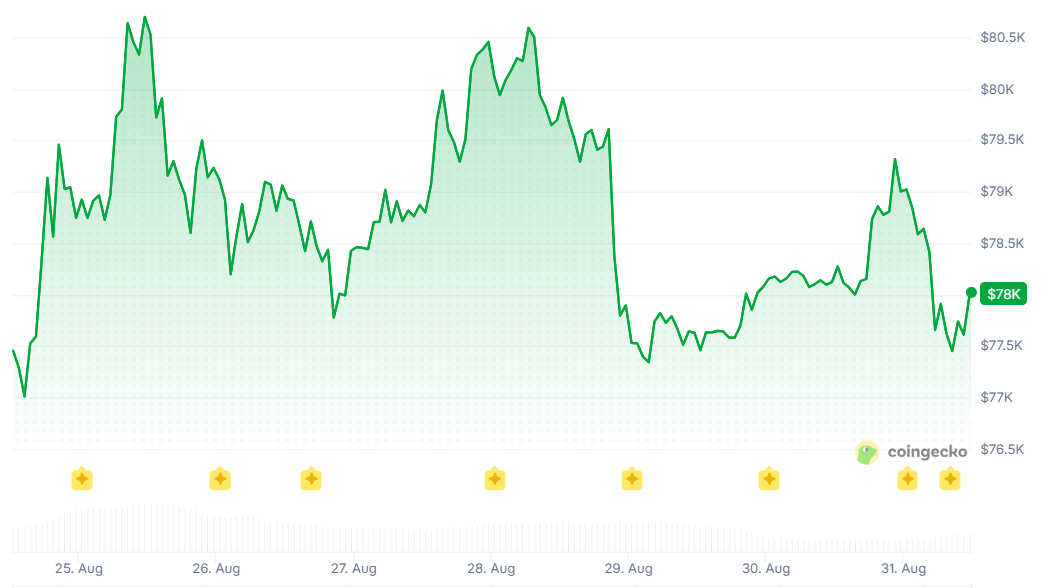
Source: CoinGecko
TradingView data shows that the price has already dropped below the key resistance range of $78,000-$82,000, which was previously seen as an important pressure point. Short-term support looks at $76,000-$77,000; if this support is breached, the market could test $70,000-$72,000.
SoSoValue data indicates that the buying interest in put options remains low, with the options market still leaning towards optimism. However, the real test will come after the U.S. market opens, to see if Bitcoin ETFs can draw in new capital.
Spot Bitcoin ETFs had seen significant net inflows for nine consecutive days, but last Friday saw outflows of $202 million. If this trend continues, it indicates that the real buying interest from institutions is not sufficient.
The current market trend is driven by leveraged derivatives rather than real spot demand. The daily average trading volume of $109 billion looks impressive, but if the scale of stablecoins does not expand simultaneously, the trading volume lacks substantive meaning. This round of increase is likely just a short-term pulse, not a return to the sustained capital inflow seen between August 2024 and October 2025.
Other Technical Indicator Signals
TradingView’s combined moving averages, oscillators, and pivot points provide a buy signal for Bitcoin technical analysis for the upcoming week.
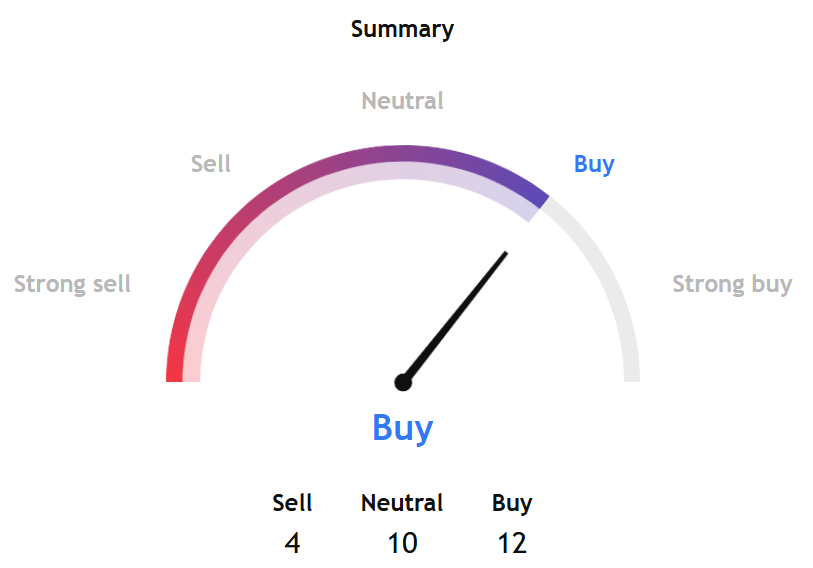
Source: TradingView
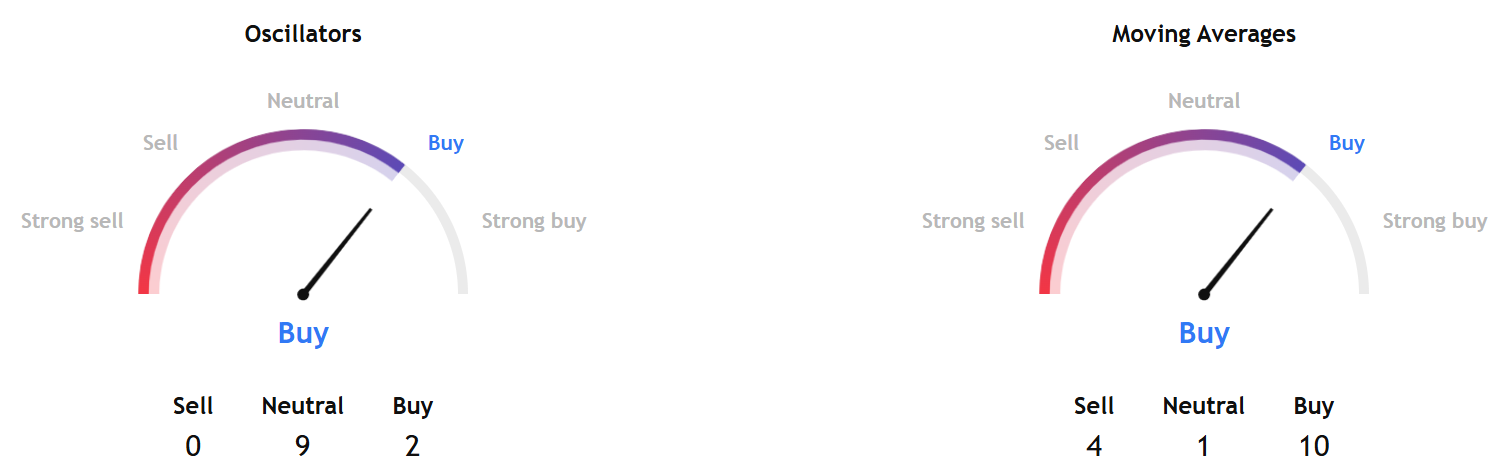
Short-term and long-term indicators are also suggesting a buy.
Additionally, InvestTech's algorithm has a comprehensive rating of "positive," but the 1-6 week outlook is rated as "weakly positive."
The institution pointed out: "Bitcoin is currently operating in a near-level oscillatory channel, indicating that the market will continue in its current direction. Support below is at $63,000, and resistance above is at $80,400. Volume is positively balanced, with higher volume on up days and decreasing volume on down days, providing support to the price. After a significant previous increase, the RSI indicator has already surpassed 70."
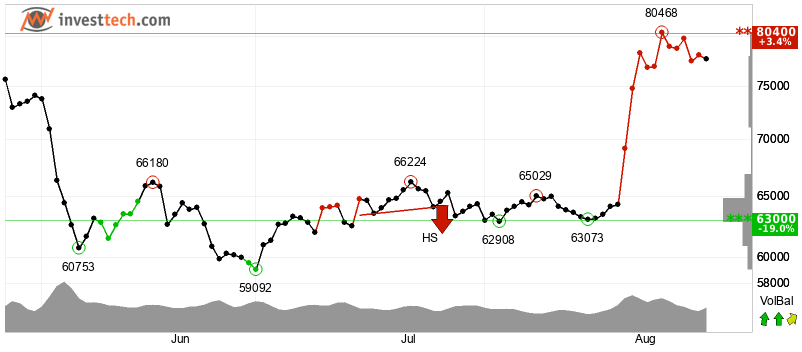
Source: InvestTech
InvestTech added: "The upward momentum of the cryptocurrency is sufficient, and there is a possibility of further ascent. However, for major assets, an RSI at high levels represents overbought conditions, posing a risk of a pullback. In summary, the short-term technical outlook is only slightly tilted towards the positive."
免责声明:本文章仅代表作者个人观点,不代表本平台的立场和观点。本文章仅供信息分享,不构成对任何人的任何投资建议。用户与作者之间的任何争议,与本平台无关。如网页中刊载的文章或图片涉及侵权,请提供相关的权利证明和身份证明发送邮件到support@aicoin.com,本平台相关工作人员将会进行核查。


