Author: Jake Pahor
Compiled by: Blockchain in Plain Language

I came back after fishing for a week to find that my workplace had its busiest week since January.
Not busy with trading, but busy with various paperwork. Everyone is rushing to open accounts, complete identity verification, and deposit funds, while at this time Bitcoin has posted a weekly rise of 22.8%, the largest weekly increase since March 2023. A few weeks ago, I wrote that the time to prepare is before the market takes off. This week, that statement is no longer just theoretical.
Now, the entire market is focused on a key position. Tonight's content is about this position: the three historical instances where bear markets ended here and the one case of a false breakout that fooled everyone.
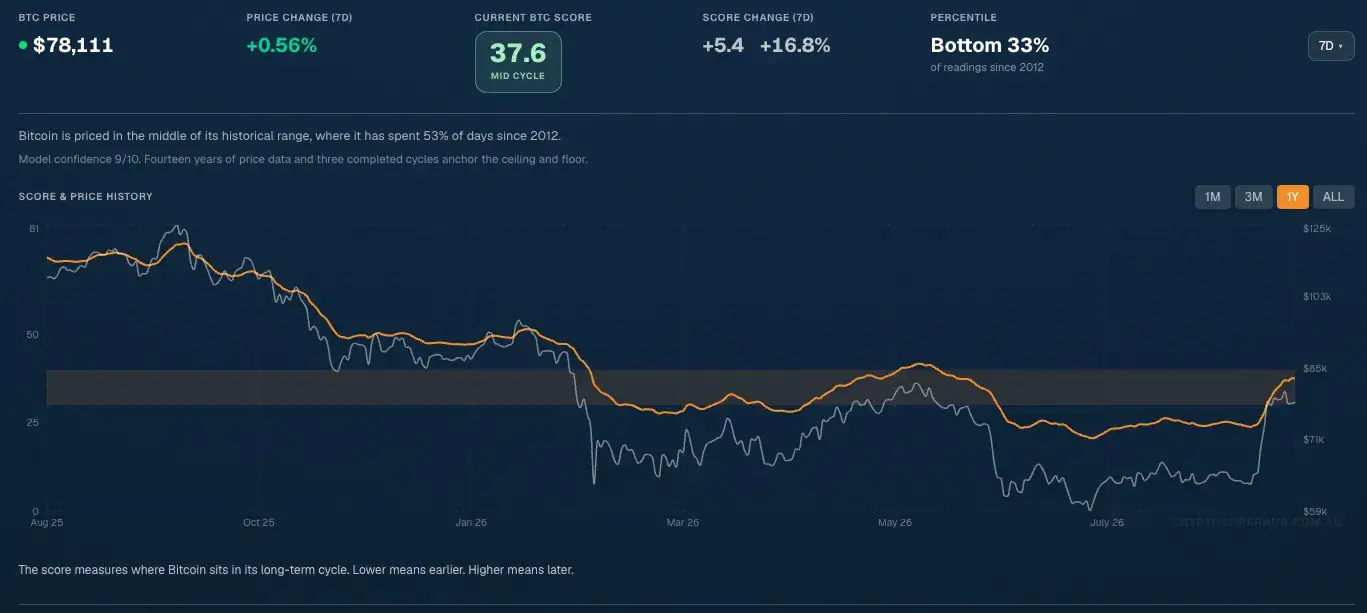
Currently, the CSH indicator score is 37.6, which is in the mid-cycle, up 5.4 week-on-week. In practical terms, this means: my plan stopped buying on August 22, when the indicator broke above 30 after being below 30 for 79 consecutive days. This is not my subjective judgment but a plan executed according to established rules.
CSH Risk Dashboard
CSH Indicator: 37.6, mid-cycle, weekly +5.4 (+16.8%)
Percentile level: in the last 33% of all readings since 2012
Bitcoin: $78,153 (AUD $109,002),up +0.47% this week after a significant increase of 22.8% last week
It has been 327 days since the peak in October; the lowest point of this bear market so far was $58,551 on July 1, with a maximum drawdown of 53.1%
The CSH indicator has been at 30 or below for 115 days during this bear market, all within the range of 20-30, the indicator score has never fallen below 20. Changes brought by the readings: above 30, my periodic buying paused; once it drops back below 30, systematic dollar-cost averaging will resume; falling below 20 will trigger cash reserves to gradually buy the dip. Indicator changes, plan responses, and I went fishing.
Has this happened before? Testing the 50-week Moving Average
Bitcoin's 50-week moving average (MA) is approximately $81,000. The price retreated after hitting this level on Friday and is currently fluctuating about 3% below it. If you have experienced a couple of cycles in the crypto market, you will understand why everyone is focused on it: in a bull market, this level is support for every pullback rebound; while in a bear market, this is resistance where all rebounds fail.
Therefore, I checked the complete historical data for the indicators since 2012 (total 5,322 days) and pulled out the data for each bear market bottom. There are a total of 3 instances: 2015, 2018-19, and 2022-23. I want to find an honest answer to the question that half of the trading desks have been asking me this week: has this happened before?
What happened next?
Here are the patterns presented by the historical data.
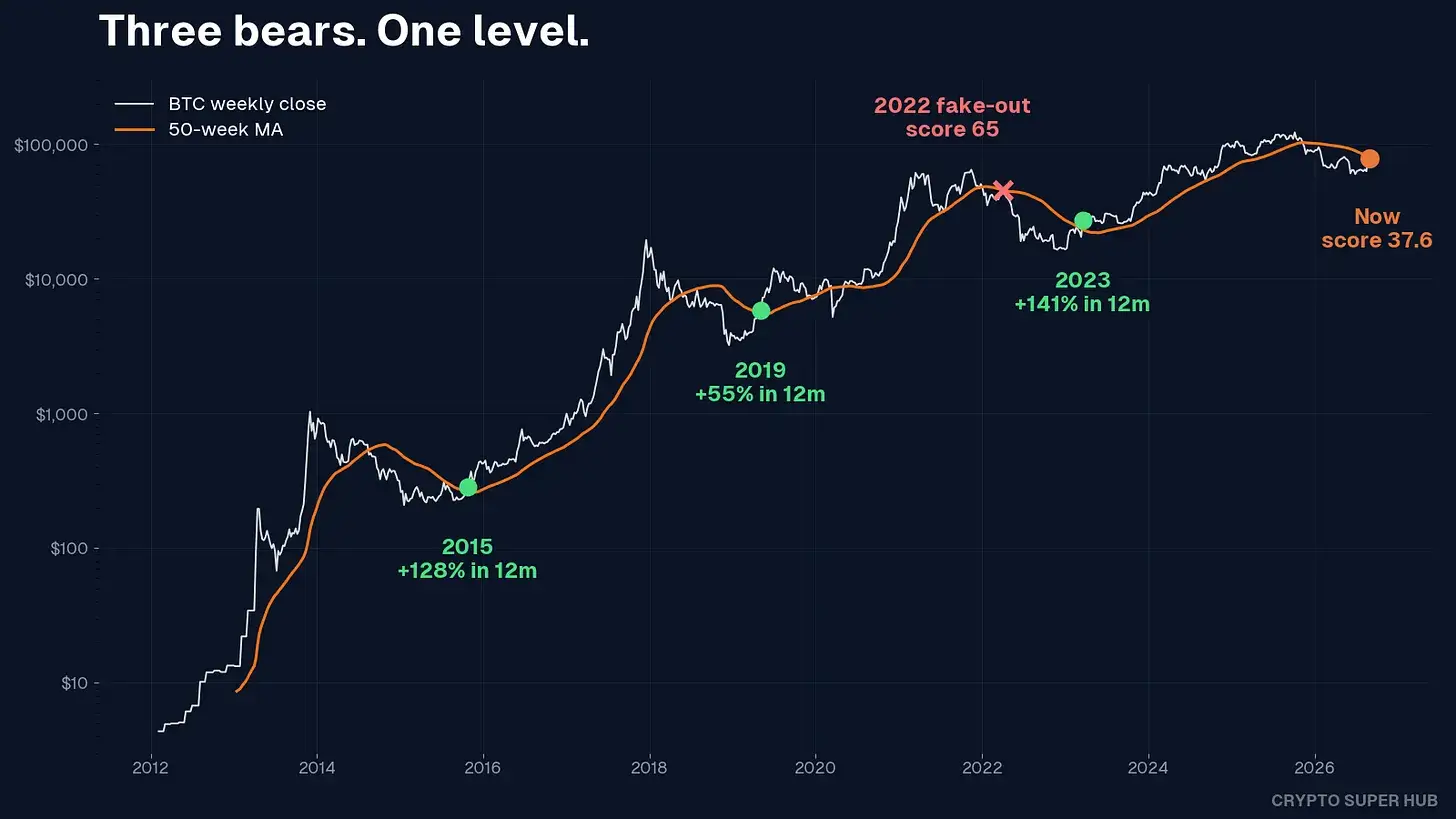
All three previous bear markets ended in the same way: after bottoming, the weekly close successfully stood above the 50-week moving average.
October 25, 2015.
May 19, 2019.
March 19, 2023.
Three different bear market cycles, three completely different macro environments, yet appeared with exactly the same signal. In all three cases, the same three things occurred afterwards: in the following six months, the weekly price never closed below the 50-week moving average again; the bear market bottom was never touched again; and 12 months later, Bitcoin was up 55%, 128%, and 141% respectively compared to the closing price when it recovered the moving average.
Another unexpected detail: the last week when it recovered the moving average on March 19, 2023, there was a +32.1% weekly bullish candle. And what has been the maximum weekly increase since then? It is last week’s +22.8%. The market's current rhythm is already clear enough, worth pointing out loudly.
Now let’s look at the part that most analyses tend to overlook.
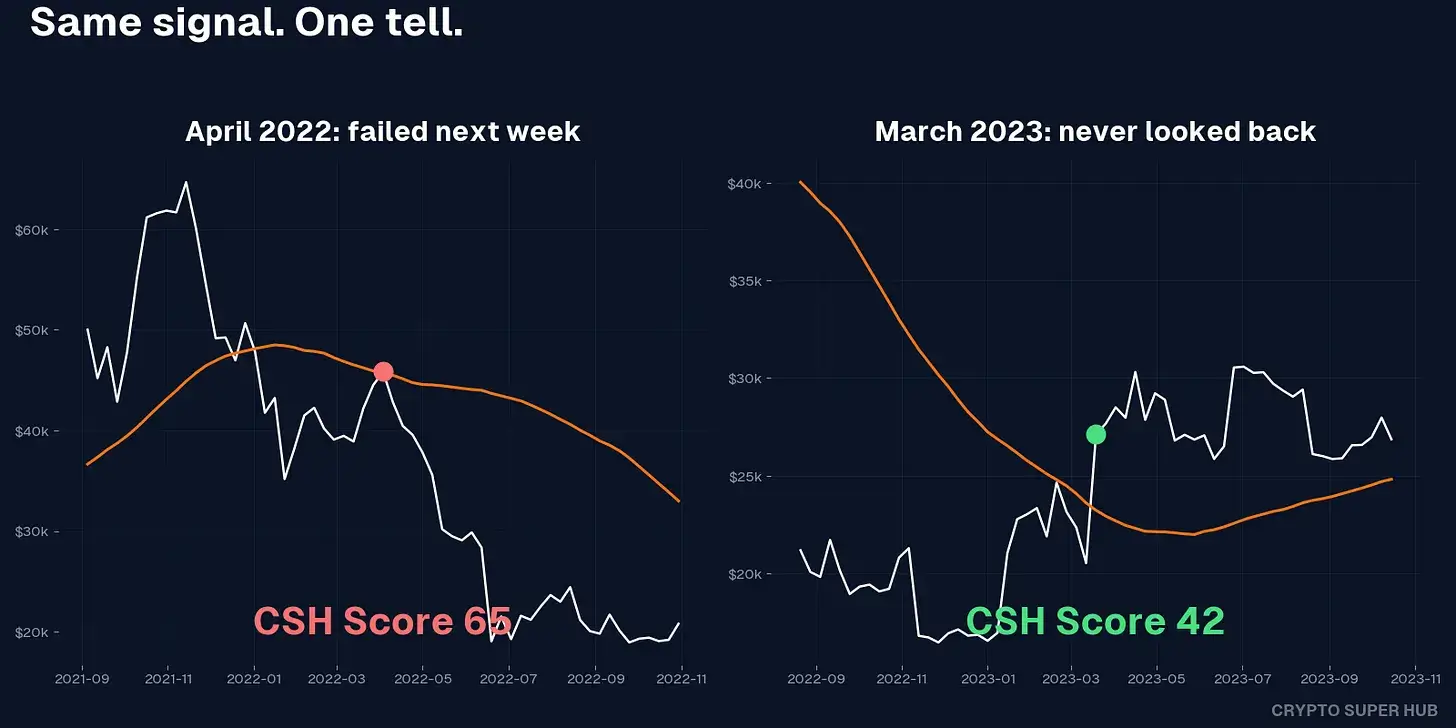
In the entire historical dataset, there has only been one false signal: April 3, 2022. At that time, there was a weekly close above the 50-week moving average during the bear market, but the following week it fell back below and ultimately the bottom appeared after 7 months, the price then plummeted by 64%.
The difference between that false signal and the three real reversals lies not in the price chart, but in the underlying indicator scores. When the weekly close above the moving average in April 2022, the CSH indicator was as high as 65.4, having not experienced any real panic capitulation, and the price was still relatively expensive in its own cycle. In contrast, the three real recoveries started after the indicator scored bottoms at 22.1, 14.6, and 2.3, with scores for the week of recovery being 47.5, 41.9, and 19.5.
Current situation: score 37.6, having previously bottomed at 20.6. This aligns perfectly with the historical characteristics of a genuine reversal and not a false breakout. So has the bottom really been established? Before everyone gets overly excited, there are two sincere warnings to note, which have been troubling me.
First, this bear market still has some indicator characteristics that have not been met. This is the shallowest bear market correction in history (53%, while previous corrections were 75% to 83%), and the CSH indicator has never dropped below 20. However, the 2018-19 bear market also bottomed without ever dropping below 20. “The final panic squat” is just a common rule, not an absolute law.
The second is time span. The first three real recoveries occurred 284, 141, and 118 days after the bottom was reached respectively. If July 1 was indeed the bottom, we are currently only at day 60. Bitcoin has never transitioned from the bear market low to stabilize at the 50-week moving average at such speed historically. A quick speed does not mean it is impossible; it just does not fit well with historical patterns.
What is the conclusion? The core signal that ended the previous three bear markets has not yet been truly established: the weekly candle successfully closes above the 50-week moving average and holds steady in the following weeks. But we have already seen the precursor patterns: deep indicator basing, violent rebounds from the bottom, and prices vigorously breaking through key resistance levels. My personal subjective judgment (purely a personal view, not an absolute data conclusion): my current stance is 50-50 between bulls and bears, and this is the most optimistic I've been about the market since the decline from the top. The core value of strictly executing a plan is: even if I consider it 50-50, I won't become paralyzed, because strategies for both outcomes have been predetermined.
Jake's Workbench
This week I actually did: nothing. To be honest, this is what I am proud of.
In the past 7 months, whenever the CSH indicator was between 20 and 30 (a total of 115 days), the system plan has been steadily dollar-cost averaging into Bitcoin. When the indicator crossed above 30 on August 22, the dollar-cost averaging automatically stopped. I have kept cash reserved for buying the dip if the indicator falls below 20, even if that moment may never come. If this is indeed the bottom, I have already filled my entire buying window through automated strategies; if this is not the bottom, the rules for the next decline have already been established.
I also calculated a set of data that thoroughly verifies the effectiveness of this method. Since the peak in October, comparing two strategies with the same amount of funds: the average buying cost for blind dollar-cost averaging daily was $76,551; while buying only on days when the indicator is at or below 30 resulted in an average cost of $64,759. With the same amount of funds, the latter obtained 18.2% more Bitcoin. The only difference is: the latter had a clear written definition of "cheap" before using the funds.
Another thing in the workbench: the “My Plan” feature has launched CSV import, and I am the first test user. I imported all the records of my personal retirement fund (SMSF) buying Bitcoin since August 2024 and compared them to historical indicators. The result found that before establishing this system plan, a quarter of the buying funds were chased in when the CSH indicator was above 70. Wednesday's article will provide an unreserved review of these lessons.
News Briefs
Jackson Hole Conference releases hawkish signals. New Federal Reserve Chair Kevin Warsh stated in his first keynote address on Friday that inflation is still too high (PCE annual rate at 3.7%, annualized at 4.1% over six months, according to the data provided), and opened the door for interest rate hikes. According to CME data on August 28, the futures market's expectation of a rate hike in September jumped overnight from 35% to about 59%, essentially entering a coin toss stage of uncertainty.
Key date reminder: August CPI data will be released on September 11, with the Federal Reserve's rate decision set for September 16. If the Federal Reserve chooses to raise rates, this will mark the first liquidity tightening that the crypto market has faced since the 2022 bear market, which warrants high vigilance. Other market performances: Gold pulled back 3.2% this week, the US stock market remained basically flat, and the VIX fear index operated steadily at a low of 14.4. The factors that drove Bitcoin higher over the past two weeks are clearly not a broad risk appetite explosion across all asset classes.
Outlook for the Coming Week
This week's core question is only one: Can Bitcoin stand steady at the 50-week moving average, or will it face strong resistance and retreat?
Path One: Bitcoin successfully closes above the 50-week moving average and holds steady. This is the key confirmation signal that ends the previous three bear markets, at which point I will fully turn bullish.
Path Two: faces severe retreat after a strong rally. Every bear market rally since 2013 has failed at this resistance level; if this happens, the price is expected to again test the lower boundary of the range.
Friday evening's US non-farm payroll data is the only major scheduled event with enough weight to determine this trend.
Both paths have clear instructions in my trading plan: if the indicator is below 30, restart dollar-cost averaging; if it drops below 20, increase positioning gradually; if the weekly close successfully stays above the 50-week moving average, I will publicly confirm and adjust my stance from 50-50 to fully bullish.
Conclusion
This week let's talk about something different. Over the past few weeks, I have handed over all the annoying tedious tasks to Claude and turned repeatable work into automated timed tasks. This includes client call records, invoice organization, and a full set of weekly data extraction, permanently saving me a lot of time each week.
This aligns perfectly with the underlying logic established in the CSH system: identify the decisions you need to make repeatedly, write down clear rules, and let the system run automatically. Whether it's daily chores or buying Bitcoin, written rules will always beat emotional intuition.
So here’s a small suggestion: write down the 5 most tedious daily tasks you have, throw the list to AI, and ask how to automate it; start building it this week. The ultimate value of doing so is not just the time saved, but to release your cognitive bandwidth, allowing you to focus on higher-leverage strategic decisions — whether it's your trading plan, position layout, or the next investment, while the system handles all the remaining trivialities.
Article link: https://www.hellobtc.com/kp/du/09/6429.html
Source: https://cryptosuperhub.substack.com/p/3-bear-markets-ended-at-this-line
免责声明:本文章仅代表作者个人观点,不代表本平台的立场和观点。本文章仅供信息分享,不构成对任何人的任何投资建议。用户与作者之间的任何争议,与本平台无关。如网页中刊载的文章或图片涉及侵权,请提供相关的权利证明和身份证明发送邮件到support@aicoin.com,本平台相关工作人员将会进行核查。


