Author: Jake Pahor
Translation: Deep Tide TechFlow
Deep Tide Introduction: Bitcoin is approaching the 50-week moving average again, and historically, all three bear markets ended here. This article analyzes the veracity of this signal using complete data since 2012, providing a comparison of current scores with historical cases, serving as a valuable review for investors trying to determine the bottom.
I returned from a week of fishing to find my desk the busiest it has been since January.
Not busy trading, but busy with paperwork. People rushed to open accounts, pass verification, and deposit funds, while Bitcoin rose 22.8% that week, marking the largest single-week increase since March 2023. A few weeks ago, I wrote that the time to get organized was before the market kicked off. This week, that became a reality.
Now the entire market is watching one position. Tonight’s content is about this position: the bear market has ended here three times before, and once it misled everyone.
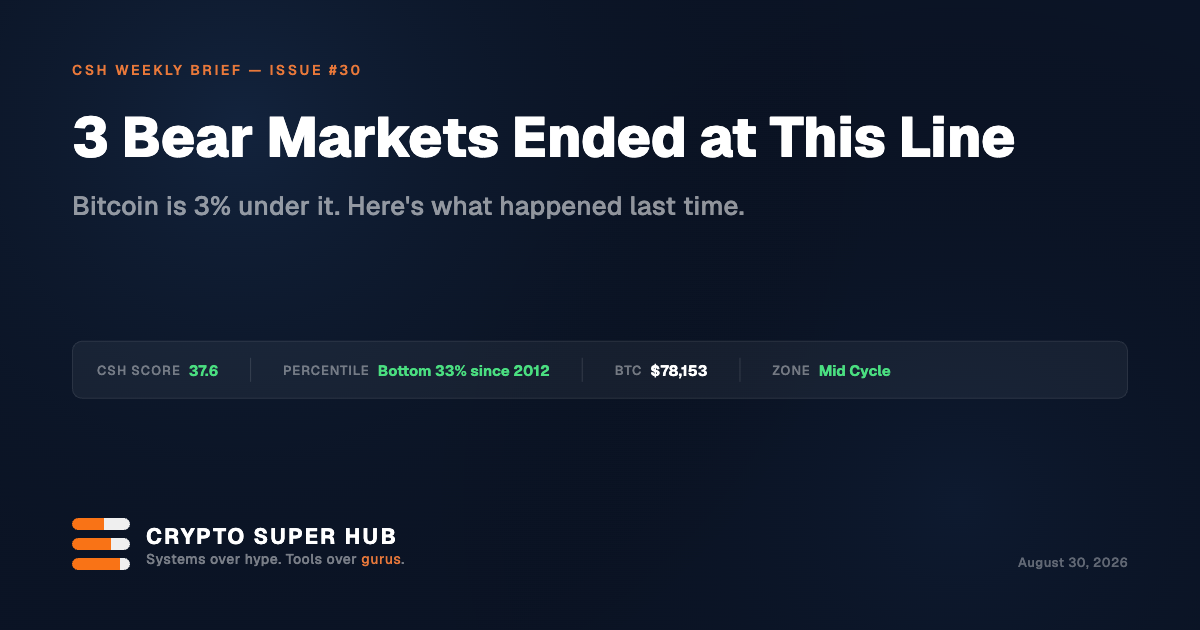
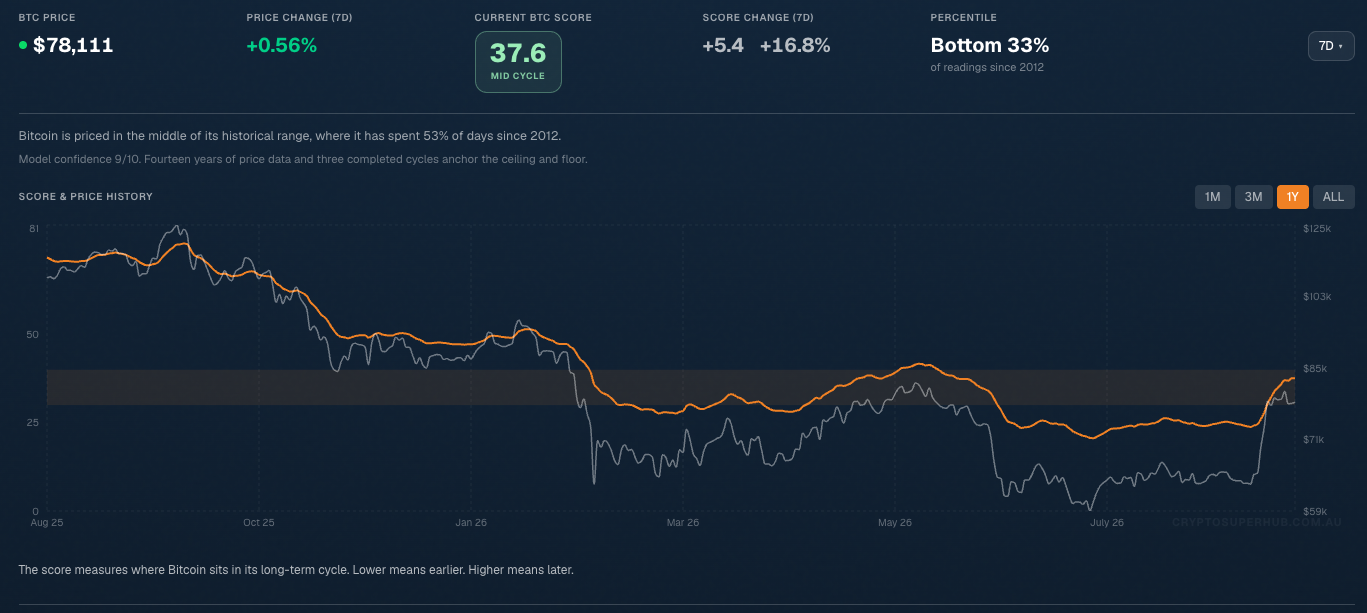
The current CSH score is 37.6. It’s at the mid-point of the cycle, rising 5.4 this week. The actual meaning is: my plan halted purchases on August 22 when the score rose above 30 after being below 30 for 79 consecutive days. This is not my judgment; it is the execution of the rules as they were written down.
Check today’s score position
CSH Risk Dashboard
CSH Score: 37.6, mid-cycle, this week +5.4 (+16.8%)
Percentile: at the lowest 33% of all readings since 2012
Bitcoin: $78,153 (AUD 109,002), after +22.8% last week, this week +0.47%
It has been 327 days since the peak in October; the current bear market low was $58,551 on July 1, a decline of 53.1%
This bear market has had a CSH score below 30 for 115 days, all within the 20–30 range, and the CSH score has never dropped below 20
Score changes mean: when above 30, I pause regular purchases; when back below 30, it resumes mechanically; below 20, the cash position activates. The score has moved, and the plan provides answers; I've gone fishing.
Has it happened before? 50-week Moving Average Test
The 50-week moving average for Bitcoin is currently about $81,000. The price touched this line on Friday and then fell back down 3%. If you’ve experienced one or two cycles in the crypto market, you’ll know why everyone is focused here: during bull markets, this position is where pullbacks bounce; during bear markets, it is the place where rebounds end.
So I scoured the complete score history, going back to 2012 for a total of 5,322 days, pulling out every instance where the bear market ended. There have been three in total: 2015, 2018–19, and 2022–23. I want to answer honestly the question asked by half of the trading desk this week: Has this happened before? What happened afterward?
Here are the answers that history provides.
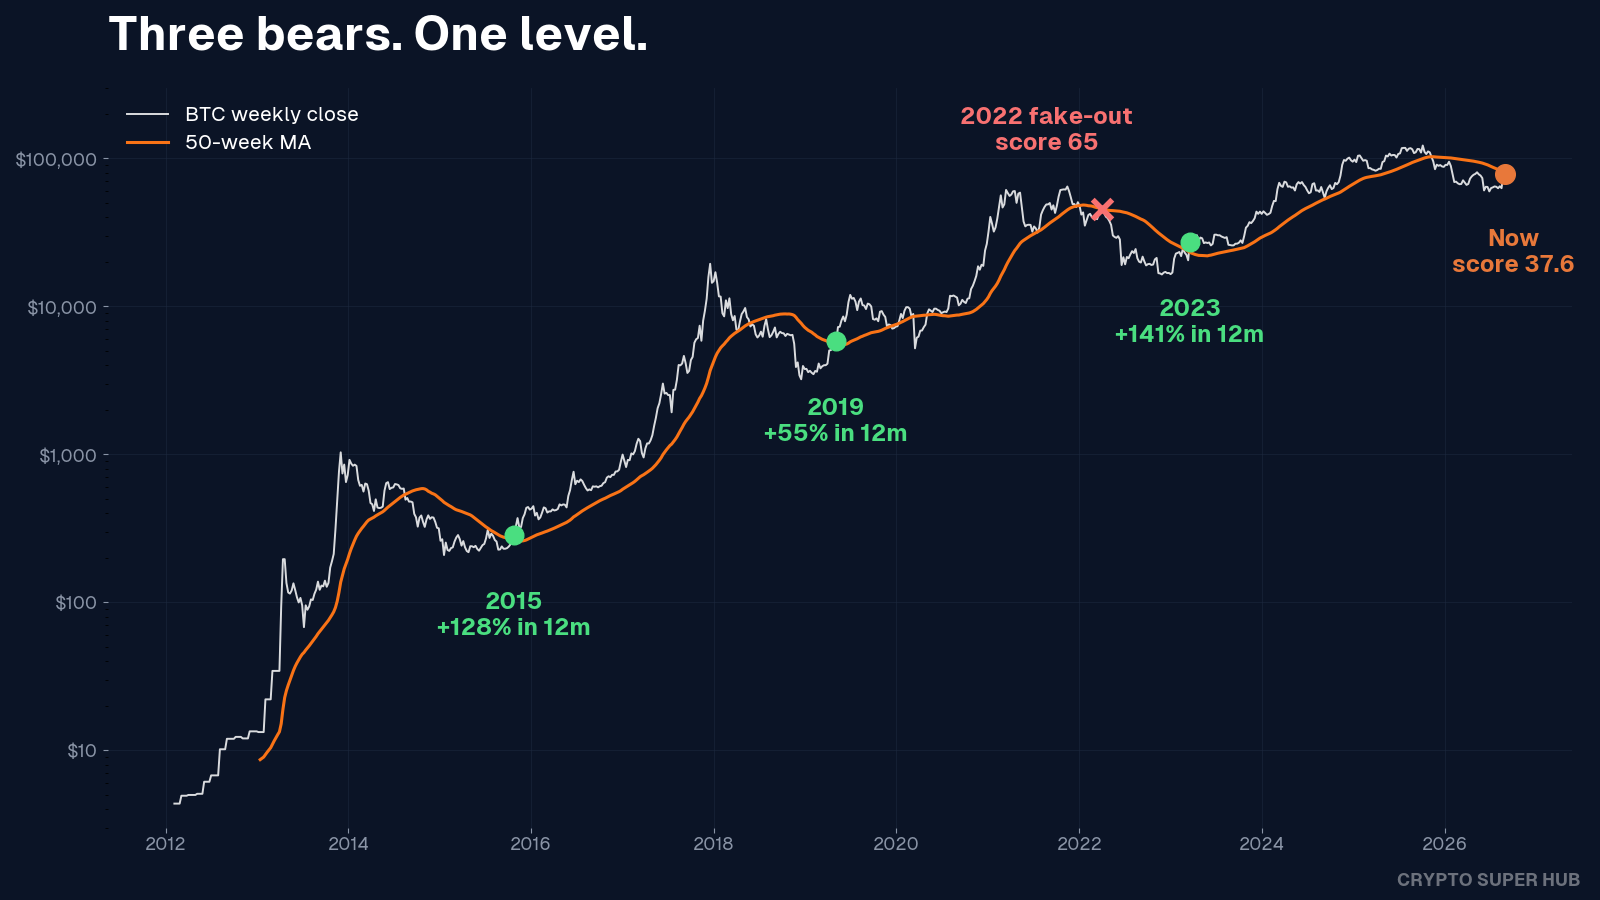
The last three bear markets all ended in the same way: the first weekly close above the 50-week moving average after hitting a low.
October 25, 2015.
May 5, 2019.
March 19, 2023.
Three different bear markets, three different worlds. The same signal. All three have a common follow-up: in the following six months, the price never had a weekly close below that line. The bear market lows were never touched again. Twelve months later, Bitcoin rose 55%, 128%, and 141% from the closing price that reclaimed that line.
There’s also a detail I did not anticipate: on March 19, 2023, the most recent week of recovery, the weekly candlestick rose +32.1%. What has been the biggest single-week increase since then? It is last week's +22.8%. The market resonates so loudly it’s worth saying out loud.
Now let’s talk about the part most analysis skips.
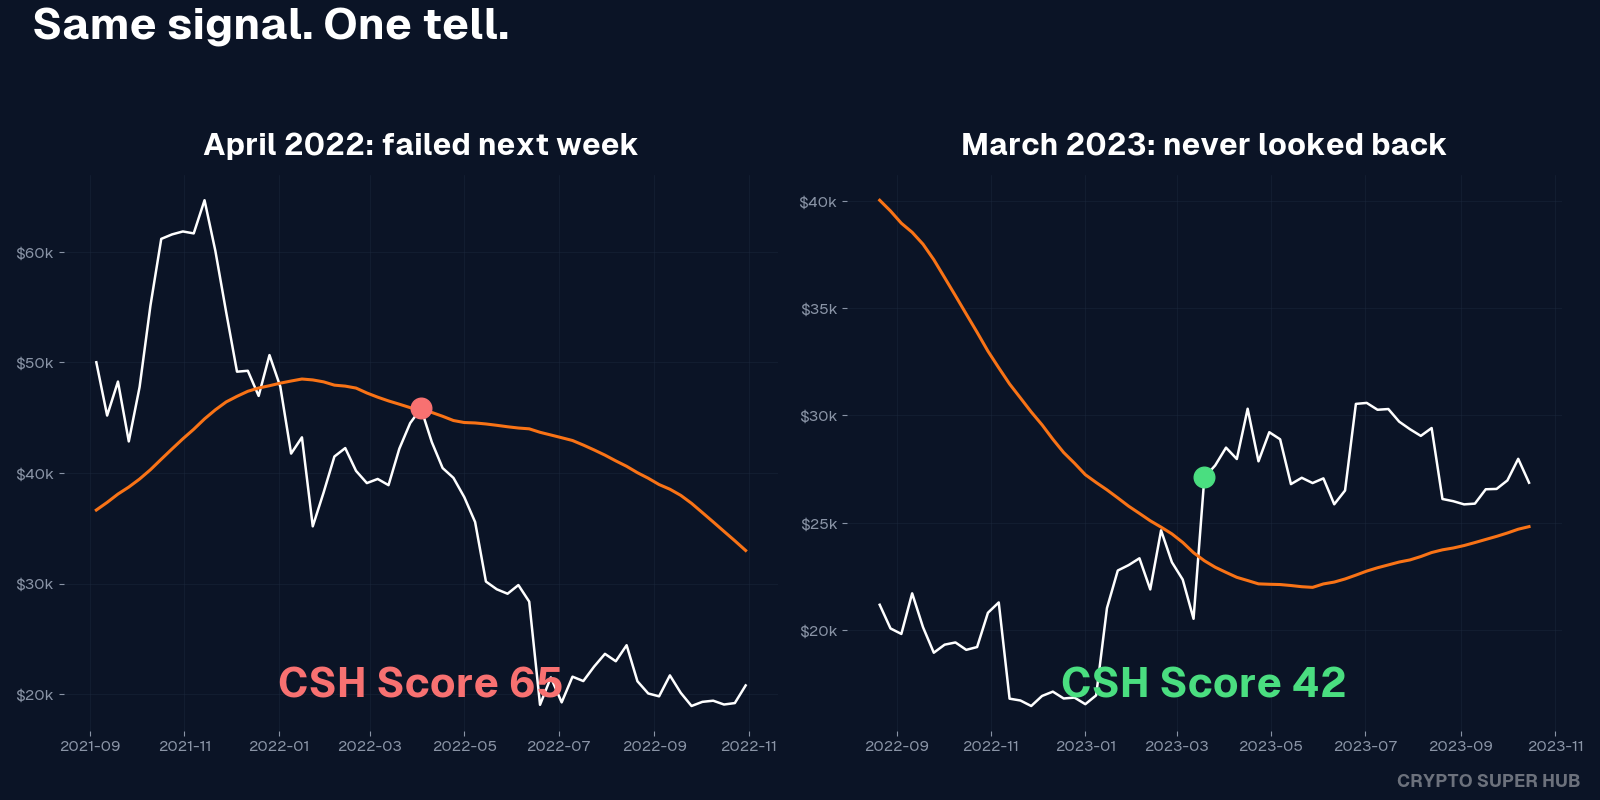
In the entire dataset, there has only been one false signal. On April 3, 2022: a weekly close above the 50-week moving average occurred mid-bear market. The following week, it failed, and the final low came seven months later, down by 64%.
The difference between that false breakout and the three true breakouts is not in the price chart but in the score. At the closure in April 2022, the CSH score was 65.4, with no capitulation selling behind it; the price was still expensive relative to its cycle. The three true recoveries came from score bottoms of 22.1, 14.6, and 2.3, with the recovery week scores being 47.5, 41.9, and 19.5.
Today: score 37.6, rebounding from a low of 20.6. This is the pattern of a true signal, not a false signal.
So has the bottom been confirmed? Before anyone gets excited, I have two honest reminders, which are also what makes me uneasy.
First, this bear market still has unchecked options. This is the shallowest retracement in history, 53%, while previous ones were 75% to 83%, and the CSH score has never fallen below 20. However, the bear market of 2018–19 did not see a reading below 20 before the bottom reversal. "The final washout" is a pattern, not a law.
Second, time. The three genuine recoveries occurred 284 days, 141 days, and 118 days after hitting a low. If July 1 was the low, we are now on day 60. Bitcoin has never moved so quickly from a bear market low to a weekly close stabilizing above the 50-week moving average. Fast is not impossible, but it doesn't align with historical patterns.
What does this mean? The signal to end the last three bear markets has yet to appear: a weekly close above the 50-week moving average, and it needs to hold in the following weeks. What has appeared is the groundwork: a very deep score low, a violent surge from the low, and the price just topping that position. My own judgment—this is just a judgment, not the data speaking—I'm about 50/50, this is the most bullish I've been since the top. And the entire purpose of executing the plan is that a 50/50 stance won't paralyze me. Both outcomes already have directives.
Jake’s Workstation
This week, what I actually did: nothing. I say this with pride.
The plan scheduled the purchase of Bitcoin for seven months, buying every day during the 115 days that the CSH score was between 20 and 30. When the score rose above 30 on August 22, it stopped. I still hold cash reserved for when the score is below 20, a condition that may never materialize. If this is the bottom, I’ve already filled the entire window in automatic mode. If not, the rules for the next decline are already set.
I also calculated a number that made the whole approach clear. Taking the same amount since the peak in October, buying in two ways. The average cost of daily purchases is $76,551. Buying only on days when the score was 30 or below yields an average cost of $64,759. The same money got me 18.2% more Bitcoin, the only difference being that the latter buyer had already written down the definition of "cheap" before taking action.
Another thing in the workstation: My Plans has launched a CSV import feature, and I’m the first user. I imported every Bitcoin purchase of my SMSF since August 2024, reviewing my history against the scores. A quarter of my purchases occurred when the CSH score was above 70. All were before we established this plan. Wednesday’s article will have a complete review, including all the dishonorable aspects.
The Jackson Hole meeting turned hawkish. Newly appointed Federal Reserve Chairman Kevin Warsh stated in his first keynote speech on Friday that inflation is too hot (PCE at 3.7% year-over-year, 4.1% six-month annualized, according to his data), and opened the door for interest rate hikes. According to CME Group data from August 28, the futures market raised the probability of a September rate hike from 35% to about 59%. It can be treated as a coin toss.
Key dates: August CPI will be announced on September 11, and the Fed will decide on September 16. If there’s a rate hike, this will be the first time the crypto market faces tightening since the 2022 bear market. Worth noting.
On other fronts: gold retreated 3.2% this week, the stock market remained flat, and the VIX slept at 14.4. What drove Bitcoin over the past two weeks was not a surge in risk appetite for all assets.
This week there’s only one question: will Bitcoin hold near the 50-week moving average or be harshly rejected?
Path one: Bitcoin weekly closes above the 50-week moving average and stabilizes. This is the signal to end the last three bear markets, and I will turn bullish.
Path two: a sharp retreat. Every bear market since 2013 has ended bounce at this position, and I expect another move down to the lower range.
Friday night’s US employment report is the only significant event that will determine this.
Both paths have corresponding operations in my plan. When the CSH score is below 30, regular purchases resume. Below 20, layered increases are heavier. If the weekly closes above the 50-week moving average and stabilizes, I will clearly state it and change my position expression from 50/50 to bullish.
This week is a bit different. In the past few weeks, I’ve handed off every task I dislike to Claude, automating the repeatable ones. Client call records, receipts, our entire week’s data collection. Several hours of my week have permanently disappeared.
The idea established by CSH is the same. Identify the decisions you repeatedly make, write down the rules, and let the system run. Whether it's administrative tasks or buying Bitcoin, written rules outperform spontaneous decisions.
So the challenge is: write down your five most disliked tasks, feed the list to AI, and ask which ones can be automated. Build one this week. The reward isn’t just getting time back. It’s freeing up your brain to handle high-leverage decisions, plans, positions, the next investment, leaving the rest to the system.
To be continued next Sunday.
Crypto Super Hub is for general informational and educational purposes only. It does not constitute financial advice and does not take into account your goals, financial situation, or needs. Cryptocurrency is highly volatile, and you may lose money. Past performance does not guarantee future results. Please do your own research before investing, and consider consulting a licensed financial advisor. We hold Bitcoin ourselves, so please assume we have biases.
Thank you for reading. Share with those who may find it valuable.
免责声明:本文章仅代表作者个人观点,不代表本平台的立场和观点。本文章仅供信息分享,不构成对任何人的任何投资建议。用户与作者之间的任何争议,与本平台无关。如网页中刊载的文章或图片涉及侵权,请提供相关的权利证明和身份证明发送邮件到support@aicoin.com,本平台相关工作人员将会进行核查。


