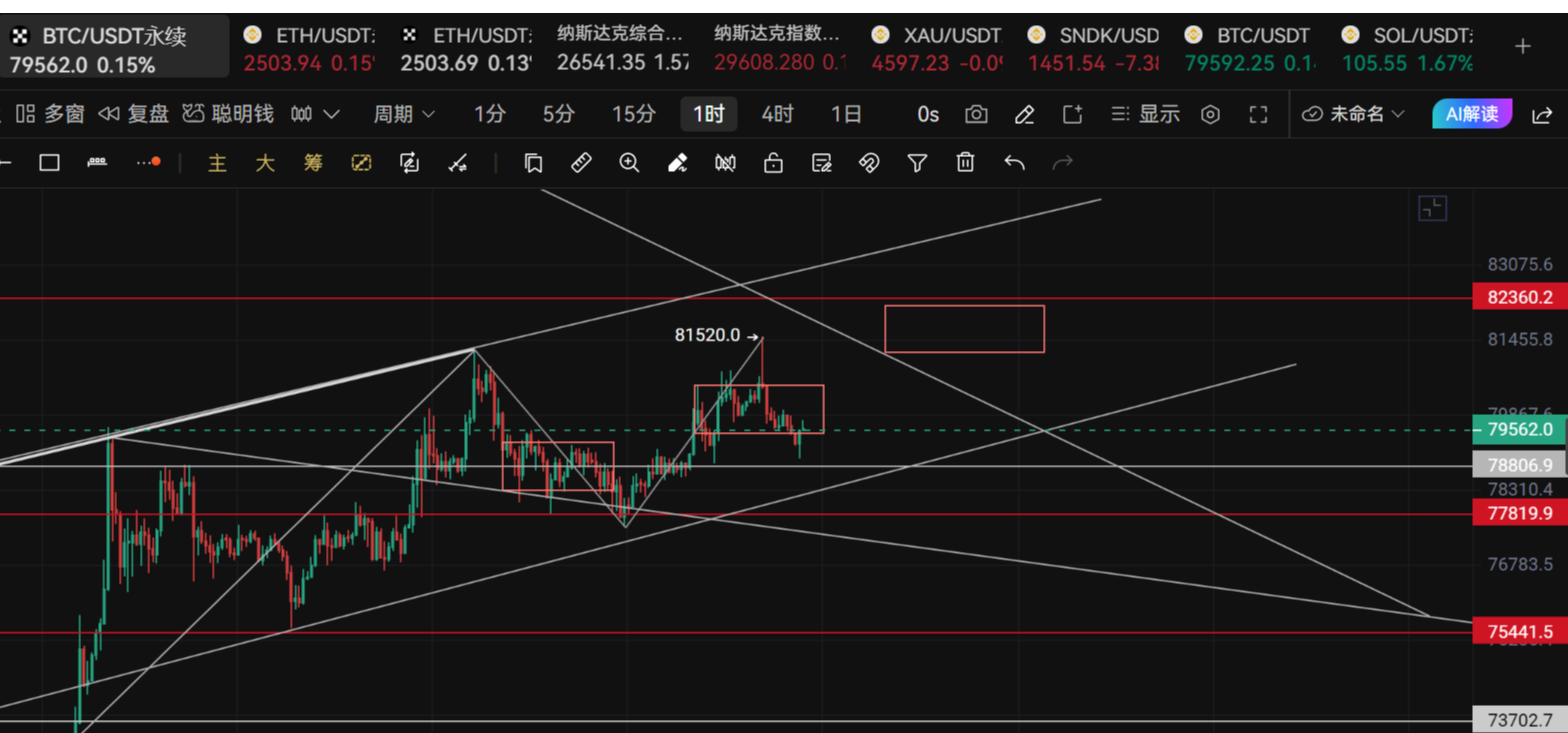
Crypto Circle Academic: The unilateral trend of Bitcoin (BTC) ended on August 29, what are the survival rules for trading under high volatility? Latest market analysis and operational suggestions interpreted
The current price of Bitcoin is 2490, and the market has started to enter a phase of volatile reshuffling. Many friends are anxious to chase the high prices as soon as they see the rise, only to encounter a pullback right after entering the market, getting swept back and forth, and their mindset is directly crushed. In a bull market, it's not just about buying with closed eyes to make money; the pullback after the rise tests the patience of those holding positions. Now BTC is near 78750, with clear divergence at high levels, with some people believing the rise has not ended and others thinking it's about to peak and retrace.
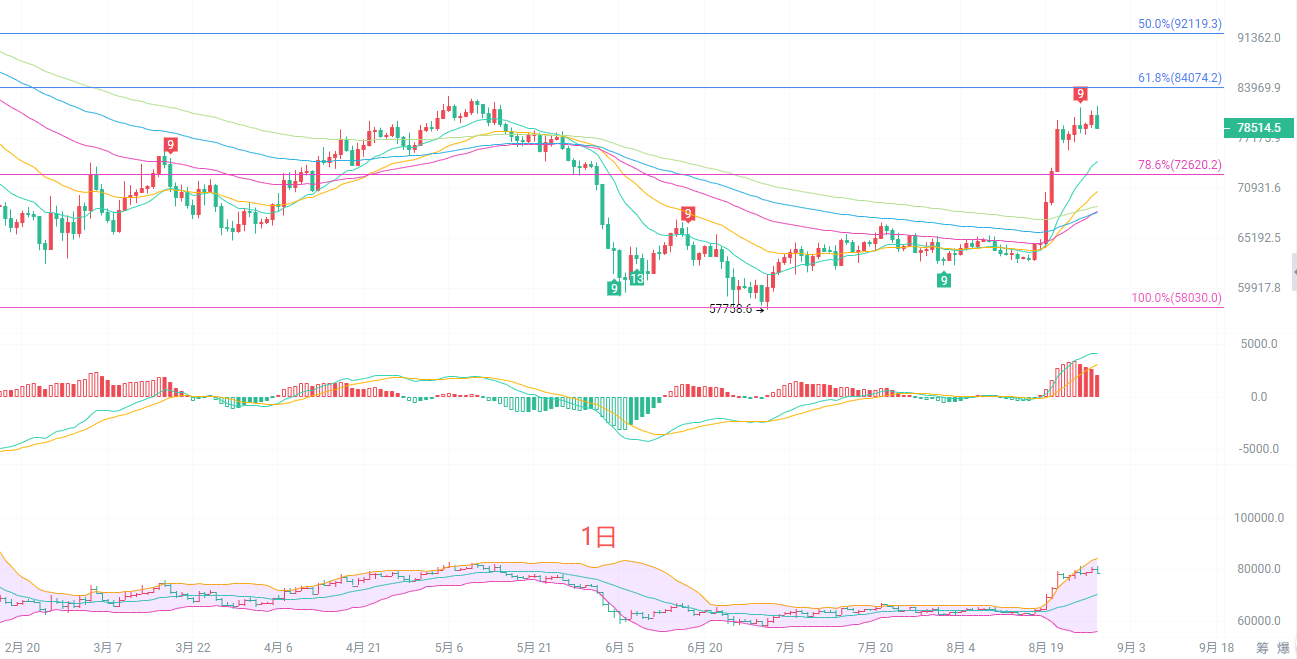
The daily candlestick chart has significantly diverged from the medium to long-term EMA moving averages, and the short-term bullish momentum has weakened. The MACD indicator shows a contraction in the red bars, and the bullish force is beginning to slow down, with the upper Bollinger Band forming clear pressure and the key resistance in the range of 8340084000. The support level below at 72620 is the 78.6% Fibonacci support level of the current rally and an important defensive point for short-term bulls. On the daily chart, the overall trend remains bullish, but after consecutive rises, there is a strong demand for pullback and repair, and it's unlikely the price will directly continue to rise violently; it’s not advisable to blindly chase after the price.
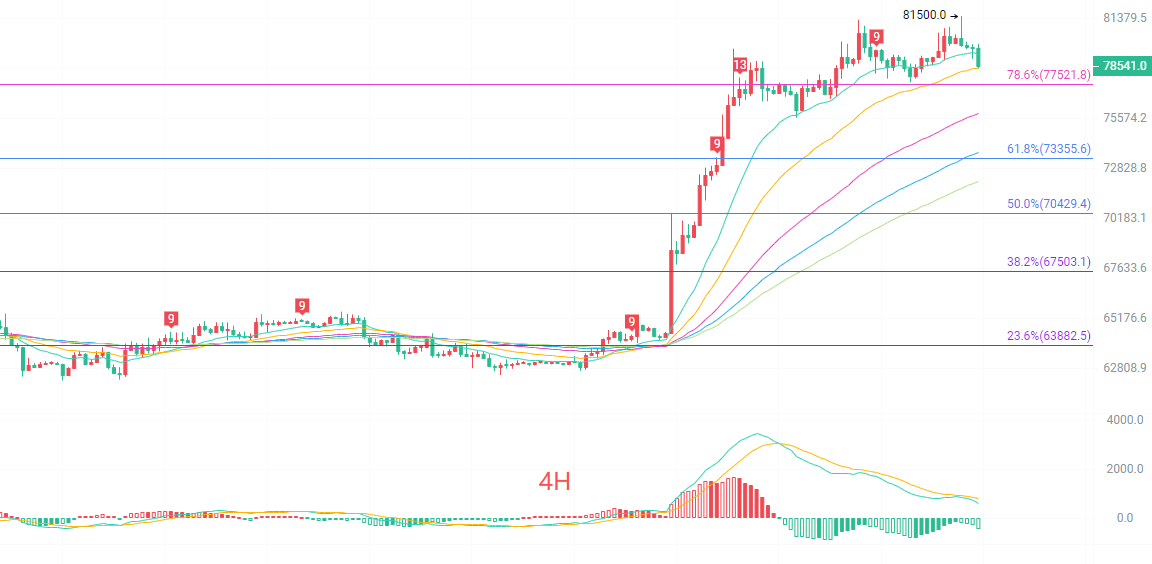
The four-hour candlestick chart peaked at 81500 and faced a pullback, with the current price at 78750. The 4-hour MACD has formed a death cross, transitioning from red to green bars, and short-term bearish strength is being released, with the price pulling back to near the EMA15 moving average. After the price pierced through the upper Bollinger Band, it has retraced, switching the trend from unilateral rise to high-level volatility. The first resistance above is 7950080200, with strong resistance near the previous high of 81500. The key support below is 77500, with further strong support at 75200. Until the 4-hour level consolidates above 80200 again, restarting a new round of unilateral rise is difficult; the short-term is very likely to maintain high-level volatility to digest previous gains, and bulls and bears will continue to wrestle.
Short-term reference:
Move up from 78000 to 77500, stop loss at 77000, target at 81200 to 84000.
Move down from 81000 to 81500, stop loss at 81500, target at 79000 to 78000.
Specific operations should be based on real-time data from the market; for more detailed information, you can consult the author. There may be delays in article publication; the suggestions are for reference only, with risks borne by yourself.

Warm reminder: The above content is solely created by the author's public account. The ads at the end of the article and in the comments section are unrelated to the author. Please discern carefully, and thank you for reading.
免责声明:本文章仅代表作者个人观点,不代表本平台的立场和观点。本文章仅供信息分享,不构成对任何人的任何投资建议。用户与作者之间的任何争议,与本平台无关。如网页中刊载的文章或图片涉及侵权,请提供相关的权利证明和身份证明发送邮件到support@aicoin.com,本平台相关工作人员将会进行核查。